Purification of Hepatitis B Virus Surface Antigen for Vaccine Products: Impact of Ligand Density on HBsAg Purification By Immunoaffinity ChromatographyPurification of Hepatitis B Virus Surface Antigen for Vaccine Products: Impact of Ligand Density on HBsAg Purification By Immunoaffinity Chromatography
According to the World Health Organization (WHO), more than 350 million people worldwide are chronic carriers of hepatitis B virus (HBV) (1). Around 25% of carriers develop liver cirrhosis and/or carcinoma, making HBV responsible for the deaths of one million people annually (1).
The virus has a spherical shape with a lipoprotein coating mostly of HBV surface antigen (HBsAg) (2). Knowing that, drug developers have created recombinant HBV vaccines based on HBsAg synthesized in yeast or mammalian cells (3, 4). For such purposes, transformed cells are cultured in industrial-scale fermentors, after which expressed antigen is collected, purified, and formulated into spherical particles that expose the highly immunogenic “a” antigenic determinant region (5).
The Center for Genetic Engineering and Biotechnology (CIGB) in Havana, Cuba, produces HBsAg used in manufacture of recombinant vaccines against HBV (6). Because of the center’s efforts, Cuba is one of the few countries in the world that inoculates its population below 15 years old against HBV. Thus, no cases of hepatitis B in children of that age have been reported in Cuba since 2007 (6).
During biomanufacturing of recombinant HBsAg, the main purification step is immunoaffinity chromatography (IAC) (6), a technique first implemented in the 1930s. Since the inception of affinity chromatography about 50 years ago (7), it has become an invaluable tool in the life sciences, because it can isolate proteins to a high level of purity in a single purification step (8, 9), facilitating resolution of subsequent purification steps and saving time and money (10). The main components of an IAC medium are the support and ligand, which usually are agarose and monoclonal antibodies (MAbs), respectively. A support is selected for its large surface area, controllable porosity, sufficient hydrophilicity to prevent nonspecific adsorption of contaminants, and mechanical stability at high pressure (10, 11). Usually, the term ligand refers to a molecule that interacts with a target molecule. To be used as such, MAb is immobilized onto agarose. Then, a sample containing target proteins is applied for isolation (9, 12).
We hypothesize that ligand density is critical to the success of an IAC process for HBsAg purification, because even small changes in that parameter can open up multiple sites of protein adsorption and cause heterogenous ligand distribution. Such problems can diminish antigen adsorption capacity, antigen elution capacity, and finally, antigen recovery.
Materials
Zetarose CL4 matrix from emp Biotech serves as the support in our immunosorbent. Like Sepharose CL-4B matrix (Cytiva), the Zetarose product has 2–4% solid-material content. Therefore, the ligand density obtained at the end of a MAb coupling process, expressed as the amount of MAb per milligram of dried material, can be high (with 4% solid content) or extremely high (2% solid material). Such variability can cause ligand leakage and undesirable variation in immunosorbent purification capacity across lots.
The accuracy of ligand-density control must be improved. Consider a case in which the affinity constant of the MAb used as a ligand is high (>108 mol-1) and the antigenic epitope recognized by the MAb paratope is repeated in the same antigen molecule or particle. In this case, the total strength of the interaction considering all involved epitopes and paratopes, called avidity, is one or two orders of magnitude higher than the affinity constant value per se, because different factors play a role in stabilizing the interaction between the antigen and antibody (13).
The CB.Hep-1 MAb is a mouse γ-immunoglobulin (IgG2k) specific for the “a” determinant of HBsAg. The sequence recognized by the MAb’s paratope, clarified over 20 years ago, is located in the first loop of the “a” determinant (14). The MAb also has a high affinity constant ranging from 109 mol-1 to 1010 mol-1 (15). The HBsAg originally identified in sera from patients infected with HBV — often called the “Australia antigen” — can present as a sphere of ~21 nm in diameter or in a filamentous or tubular shape ~21 nm wide and up to several hundred nanometers in length. Recombinant HBsAg expressed by yeast cells has shown similar properties to protein isolated from human sera. Electron microscopy revealed a complex macromolecular aggregate composed of proteins (75% of total weight) and carbohydrates (25% of total weight). The HBsAg amino acid sequence and composition are responsible for antibody induction in vaccinated humans, with the “a” antigenic determinant being the main epitope used to generate a protective immune humoral response (16, 17). It has been reported that the 22-nm HBsAg particles are assembled from 100 to 120 monomers (18), which indicates that the epitope recognized by the corresponding CB.Hep-1 MAb paratope can be repeated up to 100–120 times in each HBsAg particle.
Considering such factors, we studied the impact of CB.Hep-1 ligand density on the efficiency of IAC processes performed to purify HBsAg produced in Pichia pastoris for use in HBV vaccines.
Experimental Methods
Production of Ascites Rich in CB.Hep-1 MAb: Murine hybridoma 48/1/5/4, the secretor of CB.Hep-1 MAb, was generated by fusing spleen cells of BALB/c mice (immunized with native HBsAg preparations) with Sp2/0-Ag14 myeloma cells. To induce ascites, one million cells were injected intraperitoneally into BALB/c mice weighing 22–24 g (19).
MAb Purification: Ascites fluid was collected and stored at –20 °C, thawed at 37 °C, clarified and filtered through a 0.45–0.22-μm capsule, then loaded onto a BPG 100/500 glass chromatography column (Cytiva) packed with Sepharose CL-4B Fast Flow protein A resin (Cytiva). Equilibrium and washing buffers of 150 mmol/L phosphate-buffered saline (PBS, pH 8.0) were introduced by linear flow at 100 cm/h, and CB.Hep-1 MAb was eluted from the column using 0.1 mol/L citric acid (pH 5.0) and 0.1 mol/L citric acid (pH 3.0) at a linear flow rate of 100 cm/h. Next, we incubated the elution samples with the second elution buffer for an hour and then neutralized them with 2 mol/L tris (Merck) under gentle agitation. Subsequently, we performed sample buffer exchange to 0.020 mol/L tris and 0.150 mol/L NaCl (pH 7.6) in a BPG 200/750 column packed with 21 L of Sephadex G-25 (Cytiva) gel-filtration medium. Later, purified MAb was concentrated by ultrafiltration (instrument from Sartorius) and filtered using a 0.22-µm capsule under sterile conditions.
Activation of Zetarose CL4 Matrix: We activated Zetarose matrix with cyanogen bromide (BrCN), following the modified activation procedure reported by Porath, Axen, and Ernback (20). Using that protocol, we eliminated the need for a drying step with 40% acetone.
Ligand Immobilization: We performed buffer exchanges for the purified MAb samples to 100 mmol/L Na2CO3, 100 mmol/L NaHCO3, and 500 mmol/L NaCl (pH 8.3) by gel-filtration chromatography in a column packed with 21 L of Sephadex G-25 coarse-grade gel. Then, the activated matrix was hydrated with 1 mmol/L HCl in a ratio of 5 L/L of matrix and equilibrated with 100 mmol/L Na2CO3, 100 mmol NaHCO3, 500 mmol/L NaCl (pH 8.3) in a ratio of 1.5 L/L of matrix. Next, we added the MAb solution to the activated support to obtain the desired ligand densities (2.80, 3.00, 3.20, 3.60, and 3.80 mg of MAb for each mL of support), stirring for two hours at 23 °C. Free active groups were neutralized with 200 mmol/L glycine (pH 8.0) in a ratio of 2 L/L of matrix. Two alternating washes followed. The first used 100 mmol/L sodium acetate (C2H3NaO2) and 500 mmol/L NaCl (pH 4.0); the next wash involved 100 mmol/L Na2CO3, 100 mmol/L NaHCO3, and 500 mmol/L NaCl (pH 8.3) (1 L/L of matrix). The respective immunosorbents were stored in 150 mmol/L PBS (pH 7.2) and 0.01% thimerosal.
Evaluation of Immunosorbent Performance Using Purified HBsAg Samples: We performed IAC of purified antigen samples in PD-10 columns packed with 8.14 mL of immunosorbent, equilibrated with 45 mL of 20 mmol/L tris, 3 mmol/L ethylene diamine tetraacetic acid (EDTA), and 0.5 mol/L NaCl (pH 7.39) at a linear flow rate of 4.65 cm/h. Samples were applied at a theoretical ratio of 155 µg HBsAg/mg of MAb with a linear flow rate of 4.65 cm/h. Thus, the volumes applied were 3.50, 3.80, 4.10, 4.70, and 6.20 mL for each ligand density (2.80, 3.00, 3.20, 3.60, and 3.80 mg/mL, respectively). The wash step used 20 mmol/L tris, 3 mmol/L EDTA, and 1 mol/L NaCl (pH 7.38) at 7.67 cm/h. During elution, we used 20 mmol/L tris, 3 mmol/L EDTA, 0.5 mol/L NaCl, and 3 mol/L potassium thiocyanate (KSCN) at 7.76 cm/h. We performed 23 purification cycles.
Immunosorbent Challenge with Unpurified HBsAg Samples: Unpurified HBsAg samples (5.06 mL) were applied directly to immunosorbent packed in PD-10 columns at a ratio of 155 µg of HBsAg/mg of MAb and using 4.65 cm/h as the linear flow rate. The washing step used 20 mmol/L tris, 3 mmol/L EDTA, and 1 mol/L NaCl (pH 7.38) at 7.67 cm/h of linear flow. Subsequent elution involved application of 20 mmol/L tris, 3 mmol/L EDTA, 0.5 mol/L NaCl, and 3 mol/L KSCN, flowed through at 7.67 cm/h. Matrices were regenerated after each purification cycle by applying 60 mL of 0.1 mol/L tris and 0.5 mol/L NaCl (pH 8.51), 100 mL of purified water, and 60 mL of 0.1 mol/L C2H3NaO2, 0.5 mol/L NaCl (pH 4.52).
We measured adsorption capacity and efficiency, elution capacity and efficiency, and antigen recovery and purity (including ligand leakage) during five purification cycles.
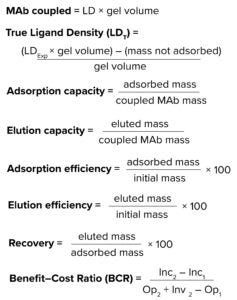 Equations: Chromatographic parameters.*Inc = income, Inv = investment, Op = operational costs.
Determination of Chromatographic Parameters
The “Equations” box on the previous page lists mathematical expressions that we used to determine key parameters.
MAb Quantification: Polystyrene enzyme-linked immunosorbent assay (ELISA) plates were coated for 20 min at 50 ± 2 °C with 10 µg/mL of HBsAg (100 µL/well) in 0.1 mol/L Na2CO3 and 0.1 mol/L NaHCO3 (pH 9.6). Next, 100-µL samples were applied to each well, including those for standard curve points and controls. The plates were placed in a humid chamber and incubated for an hour at 37 ± 2 °C. Plates were washed four times with a solution of 0.15 mol/L PBS and 0.1% Tween-20 polysorbate 20 (MilliporeSigma), then incubated for an hour at 37 ± 2 °C with a sheep-derived polyclonal antimouse IgG preparation conjugated with horseradish peroxidase (MilliporeSigma). The plates were washed again five times, and the reaction was developed with 100 µL of substrate solution comprising 5 mg of orthophenylenediamine (OPD), 5 µL of H2O2, 10 mL of substrate buffer (0.090 mol/L C6H8O7.H2O and 0.200 mol/L Na2HPO4, pH 5.5, from MilliporeSigma). The reaction was stopped at 20 min with 50 µL of 1.5 mol/L H2SO4 and the absorbance was determined at 492 nm in a microELISA reader (TiTertek, Multiskan MC340) (15).
Total Protein Quantification: We determined total protein concentration with a Lowry assay, using bovine serum albumin (BSA) as reference material (21). Values for the applied standard curve ranged from 100 g/mL to 500 g/mL.
HBsAg Concentration: HBsAg absorbance was measured at 280 nm on an Ultrospec 2000 ultraviolet–visible light (UV-vis) spectrophotometer (Pharmacia Biotech). We ascertained antigen concentrations using the expression CHBsAg = A/5, in which
CHBsAg represents the concentration of surface antigen (mg/mL), A refers to a sample’s UV absorbance value, and 5 is the molar extinction coefficient.
HBsAg Purity: We followed a sodium dodecyl sulfate–polyacrylamide gel electrophoresis (SDS-PAGE) procedure described by Laemmli et al. to evaluate the purity of recovered antigen (22).
Ligand Leakage: Well plates were covered with sheep-derived polyclonal antimouse antibodies overnight at 2–8 °C. Then, the plates were blocked for 30 min at 37 ± 2 °C. After washing, samples were eluted from the immunosorbent and incubated for three hours at 37 ± 2 °C with 1% skim milk and 150 mmol/L PBS (pH 8.0). After another washing step, plates were incubated with 100 µL/well of a goat-derived antimouse polyclonal antibody conjugated to horseradish peroxidase (MilliporeSigma). The reaction was developed using 100 µL/well of 0.05% OPD and 0.015% H2O2 in citrate buffer (pH 5.0) and stopped with 50 µL of 1.25 mol/L H2SO4 per well. Absorbance values were measured in a Multiskan ELISA reader using a 492-nm filter (15).
Carbohydrate and Lipid Content: We followed a spectrophotometric method described by Carney to ascertain carbohydrate content in IAC eluates (23). Measurements were based on the presence of sugar hydrolysis and acid degradation, as evidenced by hydroxymethylfurfural formation and other derivatives during reaction with anthrone in a strongly acidic medium.
We investigated eluate lipid content based on sample reactivity with sulfuric acid/phosphoric acid and vanillin, following the procedure described by Woodman and Price (24).
Statistical and Variable Analysis: We averaged findings from each experimental run. Statistical processing was validated by a hypothesis test, an analysis of variance (ANOVA), and a Kruskal–Wallis test. The level of significance applied was always 95%. In all cases, we used Statgraphic Centurion XV (version 15.2.06, Statistical Graphics Corp.) and Microsoft Excel software.
Results and Discussion
Immobilization of biomolecules onto solid surfaces has been applied widely, including for affinity chromatography and analytical methods (25, 26). After 50 years, affinity chromatography remains a powerful tool for purifying biologically active molecules (7, 27). It has revolutionized molecular biology, biochemistry, biotechnology, and medicine.
Affinity chromatography separates biochemical mixtures based on specific interactions between antigens and antibodies, enzymes and substrates, or receptors and ligands. High selectivity is achieved by allowing interaction and binding of target molecules with a stationary phase. Undesired material elutes first. Then, target proteins are eluted from the solid support using particular solutions or solvents (28).
IAC ranks among the most popular affinity-based bioseparation methods. MAbs have helped expand its applications (29). Such technology brings an unlimited number of ligands because MAbs can be produced against almost any compound. Currently, it seems that the number of IAC applications will continue to grow — at least for single-step isolation of target proteins during proof-of-concept studies for biological activity. However, high costs for MAb production and ligand leakage, among other factors, could limit the effectiveness of large-scale applications for pharmaceutical uses.
Many IAC support materials are commercially available (30). The most popular support is agarose, which is useful for IAC because it does not absorb biomolecules to a significant extent, has good flow properties, and can tolerate extremes of pH, ionic strength, and denaturants. Examples of agarose-based matrices include
• cross-linked beaded agarose (e.g., Sepharose resin from Cytiva and WorkBeads 40 size-exclusion chromatography (SEC) resins from
Bio-Works)
• highly cross-linked beaded agarose (Praesto resins from Purolite and Superose resins from Cytiva)
• dextran covalently linked to agarose (Superdex resin from Cytiva).
Several methods can be applied to immobilize ligands (31). Immobilization of proteins on agarose is complex, partly because of interacting forces in combination. That principle was demonstrated first using a highly reactive cyanate ester (32, 33). For agarose supports, BrCN activation has been the most popular method for attachment of ligands used to bind target proteins. During that process, ligands are linked covalently to activated hydroxyl groups of agarose beads. Target proteins associate with ligands by means of isourea binding.
Conversely, the charge of the binding isourea can disrupt its linkage with a ligand, creating several problems during purification of target proteins. For instance, constant leakage of bound antibody can contaminate the resulting drug substance with undesired ligand traces. Thus, multipoint ligand attachment often is applied. Large numbers of active groups combined with low ligand densities can help to reduce leakage.
The nature of the antigen–antibody complex is equally important to consider. A high antibody affinity constant is a critical parameter for IAC. The method involves harsh antigen elution conditions that can increase ligand leakage, diminish ligands’ antigen-recognition capacity, and damage the structure of the chromatographic support. The affinity constant is even more critical to evaluate if a process involves high-affinity antibodies with multiepitopic antigens. In such cases, avidity is perhaps the most important parameter. High values will indicate increases in antibody–antigen interaction over the affinity constant.
The interaction of CB.Hep-1 MAb and HBsAgs is one such case in which to assess antibody affinity and avidity carefully (15). That is why we studied the impact of CB.Hep-1 MAb ligand density on IAC efficiency and ligand leakage during purification of HBsAg, with the goal of learning how to increase elution capacity and efficiency.
To perform such testing, we needed to introduce a modified procedure to keep the Zetarose CL4 support hydrated during BrCN activation. Modifications were required because an optimized protocol for Zetarose CL4 resin had yet to be validated. The protocol we applied is one that has been standardized for industrial-scale activation of Sepharose CL-4B resins — and a method used by our teams for over 30 years. We observed slight differences in Zetarose CL4 resin behavior despite the samples’ being activated using the same procedure.
MAb coupling efficiency with the Zetarose CL4 support ranged from 90.81% to 95.29%, with ratios of true to expected ligand densities ranging between 95.36% and 99.47%. Those results did not accord with values reported for the Sepharose CL-4B BrCN-activation method (34). Because no correlation was estimated between the expected ligand density and coupling efficiency (R2 = 0.1292), we postulate that the relatively low coupling efficiency observed in our study occurred because MAb concentrations were below the expected ligand density (Table 1). In previous experiments with Zetarose CL4 and Sepharose CL-4B resins, we have obtained higher coupling-efficiency values when the MAb concentration in the coupling reaction was greater than or equal to the expected ligand density (data not shown). Another explanation is that the number of active groups was insufficient, but that is unlikely to have been the case because we used the same BrCN-activated support for all studied materials, and doing so would have generated consistent ligand densities in the resulting immunosorbents.

Table 1: Results of CB.Hep-1 MAb coupling to 10-mL samples of Zetarose CL4 support; LD = ligand density, concent. = concentration.
The coupling efficiencies achieved enabled obtainment of IAC media with ligand densities of 2.67, 2.86, 3.15, 3.58, and 3.78 mg of MAb/mL of immunosorbent, with each bead of support holding 6.36 × 10¹⁰, 6.81 × 10¹⁰, 7.31 × 10¹⁰, 8.58 × 10¹⁰, and 1.13 × 10¹¹ MAbs, respectively (Table 1). Thus, there was a 1.78-fold difference in ligand density between the lowest and highest values obtained. These values correspond with those calculated by Hayworth and Hermanson (34).
IAC Efficiency: Figure 1a–f depicts 23 purification-cycle profiles from purified HBsAg samples in the studied immunosorbents at an average ratio of 138.2 ± 13.9 μg HBsAg/mg MAb. The antigen application rate is important because values >250 μg of HBsAg/mg of MAb can diminish antigen-elution capacity and efficiency. The profiles show the same trend for adsorption capacity, elution capacity, adsorption efficiency, elution efficiency, and recovery, with progressive decreases in values over each purification cycle.
Those trends demonstrated that the studied immunosorbents presented limitations for IAC and have relatively short stability for HBsAg purification. An IAC support must be used for a higher number of purification cycles to be cost-effective. For instance, protein A chromatography resins usually are stable for more than 100 cycles. However, the values and trends that we observed when using Zetarose CL4 supports do not differ significantly from what can be obtained using Sepharose CL-4B resin and 4.0 mg of MAb/mL of immunosorbent (<19 purification cycles). In our case, the immunosorbent with the worst adsorption capacity was the 3.15 mg MAb/mL material, which showed a drastic decrease (12.74%) in adsorption capacity at the eighth purification cycle. The most stable supports were those with ligand densities of 2.67 mg/mL and 3.15 mg/mL (Table 2).
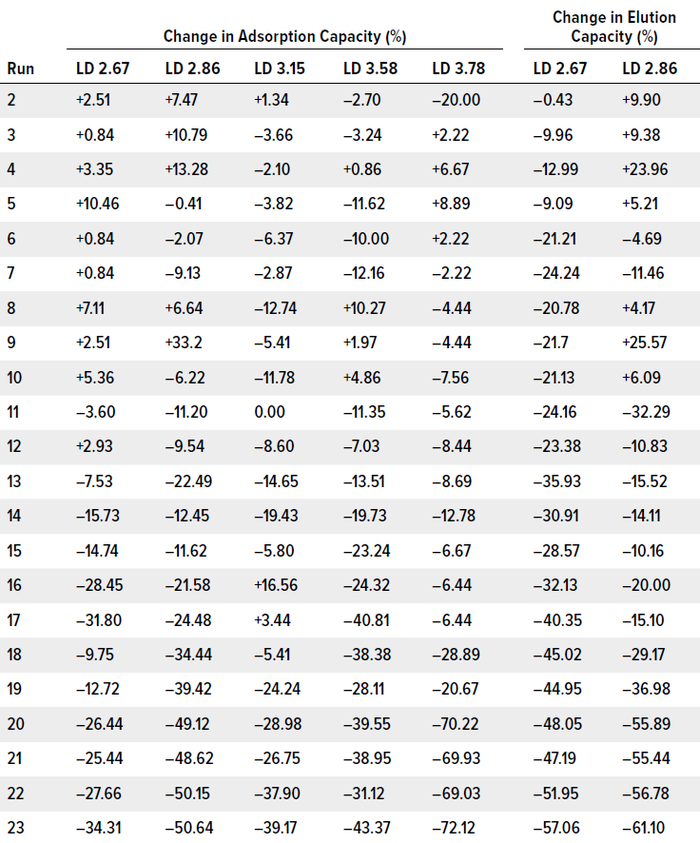
Table 2: Changes to adsorption and elution capacity of CB.Hep-1 MAb–based immunosorbents through 23 purification cycles; gains and losses are calculated relative to values from the first cycle (100%). Immunosorbents that lost >10% of initial capacity over at least five consecutive cycles were deemed unstable. (LD = ligand density, mg/mL).
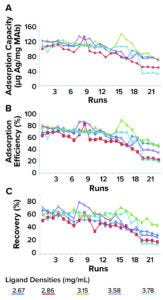
Figure 1a–c: Stability of CB.Hep-1 MAbbased immunosorbents through 23 purification cycles when applying purified samples of HBsAg.
As indicated in Figure 1 and Table 2, all tested immunosorbents showed relatively similar trends for HBsAg elution capacity. Thus, we can conclude that immunosorbent efficiency depends more on support characteristics than on ligand density. Differences in curve slope were detected only in the elution capacity of the sample with a ligand density of 3.15 mg/mL (y = – 0.871x + 103.1). Equations describing the behavior of the other tested immunosorbents are as follows:
• 2.67 mg/mL, y= –3.343x + 101.7
• 2.86 mg/mL, y = –3.536x + 97.59
• 3.58 mg/mL, y = –3.128x + 119.96
• 3.78 mg/mL, y = –3.019x + 97.59.
The most stable medium was that with 3.15 mg/mL, which showed a steady reduction in elution capacity down to purification cycle 20. The 2.86 mg/mL and 3.58 mg/mL immunosorbents were less stable, presenting concerns at cycle 11. The medium with 2.67 mg/mL became unstable during the second purification cycle.
The ratio of resin-bead pore size to antigen size works against diffusion of HBsAg into chromatographic supports. That consideration becomes even more important depending on the amount of MAb coupled to the matrix (Table 1). It has been reported that bead pores must be at least 20× larger than the size of the target protein to achieve good diffusion. Pores in Zetarose CL4B resin beads are only 10× larger than HBsAgs (20,000 kDa and 2,000 kDa, respectively, when expressed as a fractionation range).
Process conditions such as flow rate and target protein concentration in the mobile phase also influence the amount of HBsAg that can diffuse into and out of support pores. For instance, strong elution conditions applied during each cycle (e.g., use of a chaotropic agent, such as 3 mol/L KSCN) can damage immobilized antibodies by destabilizing the water interfering with hydrophobic interactions, thus diminishing adsorption and elution capacity.
MAb Leakage: Most random-immobilization procedures, including BrCN activation of Zetarose CL4B support, facilitate binding with exposed residues such as lysine, which usually are located on MAb surfaces rather than paratopes. This chemical condition induces multipoint MAb attachment and consequently reduces antigen recognition capacity by conformationally changed — and thus compromised — MAb paratopes. Multipoint attachment also decreases ligand leakage drastically.
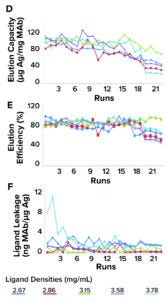
Figure 1d–f: Stability of CB.Hep-1 MAbbased immunosorbents through 23 purification cycles when applying purified samples of HBsAg.
Figure 1 shows MAb leakage profiles when unpurified HBsAg samples are as applied to the tested immunosorbents. The percentages of MAb released from the column ranged as follows:
• 2.67 mg/mL: 0.06% ± 0.04%
• 2.86 mg/mL: 0.02% ± 0.02%
• 3.15 mg/mL: 0.02% ± 0.01%
• 3.58 mg/mL: 0.04% ± 0.01%
• 3.78 mg/mL: 0.06% ± 0.05%.
Those results indicate that the amount of MAb retained in the support after each purification cycle was >99% in all cases. Consequently, the majority of leached-ligand values were below approved limits (3 ng of MAb/μg of HBsAg). The lowest values were observed in the 2.86 and 3.15 mg/mL immunosorbents, for which all values fell below allowable limits during all purification cycles. The highest amounts of ligand leakage were detected in the immunosorbents with the lowest and highest ligand densities (2.67 and 3.78 mg/mL). In the former medium, leakage stemmed from relatively low levels of antigen elution, which generated a large MAb-to-HBsAg ratio. In the latter case, leakage probably occurred because relatively fewer sites were available for multipoint MAb attachment (Table 1).
We continued our study by comparing results from tests of the 3.15 mg/mL immunosorbent with data from experiments using unpurified HBsAg samples. For these final tests, we did not use the immunosorbents with the lowest ligand densities (2.67 and 2.86 mg/mL), because they eluted comparatively little HBsAg (1.66 ± 0.37 mg and 1.65 ±
0.46 mg, respectively) (Table 3). We challenged the immunosorbents with unpurified HBsAg because, in previous experiments, we have observed differences in media behavior when applying purified or unpurified samples. For instance, aggregation of HBsAg particles in a sample can limit their diffusion into resin beads, thus diminishing chromatographic efficiency. Characteristics of unpurified HBsAg samples are described in Hardy et al. (6).
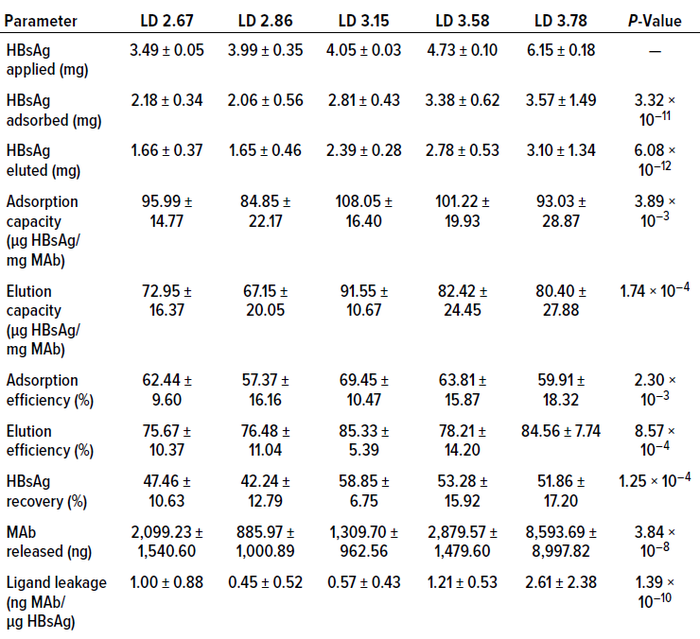
Table 3: Averaged results from experimental runs using CB.Hep-1 MAb-based immunosorbents of different ligand densities (LDs, mg/mL) on purified HBsAg samples.
During testing of the unpurified samples, we identified statistically significant differences in several parameters, including amount of antigen absorbed, amount of antigen eluted, average adsorption capacity, average elution capacity, elution efficiency, antigen recovery, and amount of MAb released from the column (Tables 4 and 5). Our results indicate that those parameters depend significantly on the characteristics of the applied samples. Regarding amounts of MAb released from the columns, differences might be explained by degradation of MAb coupled to the matrix, which could have been produced by the action of proteases present in the unpurified material. Nevertheless, data relating to the amount of MAb released from the column were highly dispersed. Further study is needed to come to a clear conclusion about that topic.
The unpurified materials did not show statistically significant differences in adsorption efficiency and ligand leakage, which remained below the approved limit. Thus, those results did not seem to be sample dependent.
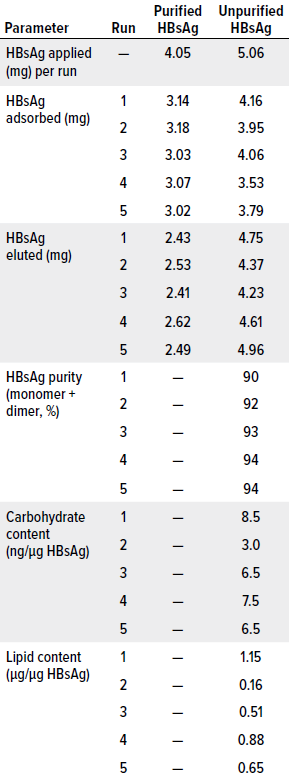
Table 4: Results from the first five cycles of a chromatography process based on a CB.Hep-1-MAb–based immunosorbent using purified or unpurified HBsAg samples. Tested media had a ligand density of 3.15 mg of MAb/mL of support, amounting to 26.05 mg of MAb applied.
We observed, however, that HBsAg elution rates were much higher when unpurified samples were applied to the 3.15 mg/mL immunosorbent than when using purified material. That result could be explained by density differences across the applied samples and by the influences of contaminants on HBsAg diffusion into the support beads. Perhaps, when unpurified samples are used, the antigens interact more with MAbs located on the bead surfaces and/or around the support pores. Therefore, the antigens would experience less interference upon release from the column. Of great importance, however, is that increased elution efficiency also improved HBsAg recovery by 20.53% (Table 4). That could enable production of 20% more vaccine doses than what could be made using material eluted from purified samples.
Other parameters measured in the immunosorbent challenged with unpurified samples included the purity, carbohydrate content, and lipid content of eluted material. Eluted-antigen purity is critically important because subsequent purification steps are selected to increase purity levels further to values approved for active pharmaceutical ingredients (APIs). In the case of HBV vaccines based on HBsAg, the purity of the antigen eluted from an IAC column should be >80% (6).
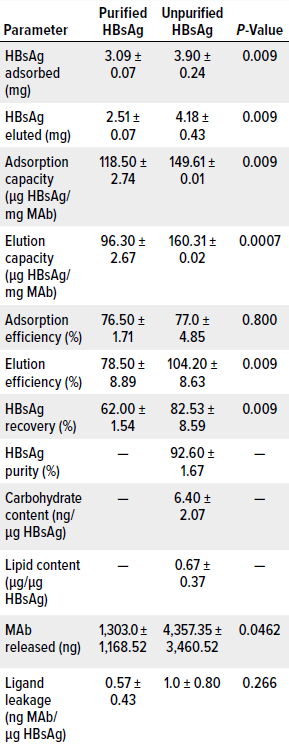
Table 5: Average results from the first five cycles of a chromatography process based on CB.Hep-1-MAb–coupled immunosorbent; runs used purified or unpurified HBsAg samples. All tested immunosorbents had a ligand density of 3.15 mg of MAb/mL of support, amounting to 26.05 mg of MAb applied. P-values were determined by Kruskal–Wallis test.
Concerning that level, we plotted standard chromatograms during all purification cycles in this study. The chromatograms were characterized by two peaks. The first, wide peak corresponded with sample components that passed through the column during sample application and column washing, whereas the second, narrower peak corresponded with HBsAg eluted using 3 mol/L KSCN. Processes that began with unpurified samples generated purity levels >90%, with an average value of 92.6 ± 1.67% (Table 5). They also exhibited sodium dodecyl sulfate–polyacrylamide gel electrophoresis (SDS-PAGE) profiles similar to those obtained for the HBsAg reference material, which is characterized by a monomer band at 24 kDa and a dimer band at 48 kDa (Table 4, Figure 2). These results accord with findings reported by Hardy et al. and Valdés et al. (6, 36). Bands not associated with the monomer or dimer (8% of the bands) seem to correspond with an HBsAg trimer, but that cannot be said with certainty, because we did not perform a Western blot with HBsAg-specific antibodies to confirm their nature. Ultimately, however, reducing the ligand density to 3.15 mg/mL did not affect the purity of the antigen eluted from the column, and doing so achieved API-grade purity.
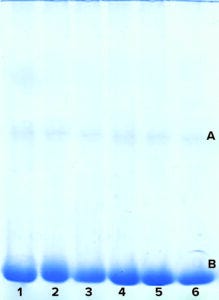
Figure 2: Purity of HBsAg samples, as measured by sodium dodecyl sulfate– polyacrylamide gel electrophoresis (SDSPAGE) in experiments with 3.15 mg/mL CB.Hep-1 MAb-based immunosorbent applying unpurified samples of HBsAg; rows 1–5 represent eluates of the five purification cycles. Row 6 is HBsAg reference material. The band marked A indicates a dimer (48 kDa); B indicates a monomer (24 kDa).
We studied the 3.15 mg/mL immunosorbent’s capacity to remove carbohydrates and lipids because HBV vaccines should be free from or have extremely low levels of such contaminants. Our measurements indicate an average carbohydrate content of 6.40 ± 2.07 ng/μg of HBsAg, which equals 0.128 ± 0.04 μg per vaccine dose (20 μg HBsAg). That value is 23× lower than the accepted limit and represents significantly better carbohydrate clearance than what can be achieved using Sepharose CL-4B resin (6).
Lipid content averaged 0.67 ± 0.37 μg/μg of HBsAg, which corresponds to 13.38 ± 7.48 μg per vaccine dose (20 μg of HBsAg). Such results are similar to those reported by Hardy et al., who used Sepharose CL-4B as a support (14.0 ±0.28 μg/20 μg of HBsAg) (4). Our results also are below the accepted limit of 25 μg/20 μg of HBsAg. Thus, subsequent purification steps to remove carbohydrates and lipids are unnecessary.
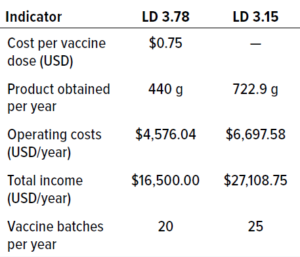
Table 6: Comparison of the main economic indicators for immunosorbents based on CB.Hep-1 MAb for purification of HBsAg; LD = ligand density (mg/mL).
Cost Considerations: We performed a benefit–cost analysis to identify the process that generated the highest and best results with the lowest amount of resources, including economic investments, consumables and equipment, and requirements for technical efficiency and workload. Benefit–cost ratios (BCRs) were calculated for the immunosorbents with ligand densities of 3.78 mg/mL and 3.15 mg/mL, assuming one year of operation and a value of US$0.75 per vaccine dose. Table 6 compares the main factors for both processes. Our analysis revealed that reducing immunosorbent ligand density to 3.15 mg/mL could result in a BCR value >1, meaning that the change would be feasible. We project that using the 3.15 mg/mL density could decrease immunosorbent production costs by 16.7%, which is extremely important considering the high costs of MAb production.
Optimizing Ligand Density
Application of purified HBsAg samples enabled us to conclude that increasing immunosorbent ligand density can improve antigen adsorption significantly (2.18–3.57 mg). The immunosorbent with 3.15 mg of CB.Hep-1 MAb/mL of immunosorbent showed the highest adsorption capacity, adsorption efficiency, elution capacity, and antigen recovery. Materials with ligand densities of 3.15 mg/mL and 2.86 mg/mL released the least amount of MAb from their columns and showed the lowest ligand-leakage values. Material with 3.78 mg/mL adsorbed and eluted the largest amounts of HBsAg but also resulted in the greatest amount of ligand leakage. With immunosorbents of 2.86–3.78 mg/mL, ligand leakage was directly proportional to the ligand density. The most stable immunosorbent tested contained
3.15 mg/mL of MAb.
Application of unpurified HBsAg samples significantly influenced the amount of antigen adsorbed and eluted as well as immunosorbent adsorption capacity, elution capacity, elution efficiency, HBsAg recovery, and MAb release from the column. However, use of unpurified samples made little impact on adsorption efficiency and ligand leakage per amount of eluted antigen (probably because of the dispersion of values). The immunosorbent with 3.15 mg of MAb/mL of Zetarose CL4 matrix showed a high removal factor for carbohydrates and lipids. It also proved to have the most suitable ligand density for purification of HBsAg. That material can be used over 23 purification cycles with an average recovery >50%. It results in ligand leakage below the approved limit
(3 ng of MAb/μg of HBsAg). And compared with immunosorbents of higher ligand densities, that ligand density enables a notable reduction in immunosorbent production costs. Ultimately, Zetarose CL4 chromatography matrix represents a suitable material for pharmaceutical-grade immunopurification of HBsAg.
Acknowledgments
We thank Drs. Derek Levinson, Alistair Hurst, Ruediger Welz, and Uwe Möller from emp Biotech (Germany) for theoretical and technical assistance and for supplying Zetarose CL4 samples. Thanks also go to Tatiana Álvarez and José Montero and to technicians José García and Guirmaray Silva from CIGB for their assistance during experiments.
References
1 Global Policy Report on the Prevention and Control of Viral Hepatitis in WHO Member States. World Health Organization: Geneva, Switzerland, 2013; https://apps.who.int/iris/handle/10665/85397.
2 Gish RG, et al. Chronic Hepatitis B: Virology, Natural History, Current Management, and a Glimpse at Future Opportunities. Antiviral Res. 121, 2015: 47–58; https://doi.org/10.1016/j.antiviral.2015.06.008.
3 Lestari CSW, Novientri G. Advantages of Yeast-Based Recombinant Protein Technology as Vaccine Products Against Infectious Diseases. IOP Conf. Series — Earth Environ. Sci. 913, 2021: 012099; https://doi.org/10.1088/1755-1315/913/1/012099.
4 Patzer E, et al. Cell Culture Derived Recombinant HBsAg Is Highly Immunogenic and Protects Chimpanzees from Infection with Hepatitis B Virus. Nat. Biotechnol. 4, 1986: 630–636; https://doi.org/10.1038/nbt0786-630.
5 Gavilanes F, González-Ros JM, Peterson DL. Structure of Hepatitis B Surface Antigen: Characterization of the Lipid Components and Their Association with the Viral Proteins. J. Biol. Chem. 257(13) 1982: 7770–7777; https://doi.org/10.1016/S0021-9258(18)34448-X.
6 Hardy E, et al. Large-Scale Production of Recombinant Hepatitis B Surface Antigen from Pichia pastoris. J. Biotechnol. 77(2–3) 2000: 157–167; https://doi.org/10.1016/s0168-1656(99)00201-1.
7 Cuatrecasas P. Protein Purification By Affinity Chromatography. J. Biol. Chem. 245(12) 1970: 3059–3065; https://doi.org/10.1016/S0021-9258(18)63022-4.
8 Subramanian A. Immunoaffinity Chromatography. Mol. Biotechnol. 20, 2002: 41–47; https://doi.org/10.1385/MB:20:1:041.
9 Fitzgerald J, et al. Immunoaffinity Chromatography: Concepts and Applications. Meth. Mol. Biol. 1485, 2017: 27–51; https://doi.org/10.1007/978-1-4939-6412-3_3.
10 Moser AC, Hage DS. Immunoaffinity Chromatography: An Introduction to Applications and Recent Developments. Bioanalysis. 2(4) 2010: 769–790; https://doi.org/10.4155/bio.10.31.
11 Wilchek M, Miron T. Thirty Years of Affinity Chromatography. React. Funct. Polymers. 41(1–3) 1999: 263–268; https://doi.org/10.1016/S1381-5148(99)00042-5.
12 Linhardt RJ, Abell CW, Denney RM. Monoclonal Antibodies and Immobilized Antibodies. Appl. Biochem. Biotechnol. 15(1) 1987: 53–80; https://doi.org/10.1007/bf02798506.
13 Landry JP, et al. Measuring Affinity Constants of 1,450 Monoclonal Antibodies to Peptide Targets with a Microarray-Based Label-Free Assay Platform. J. Immunol. Meth. 417, 2015: 86–96; https://doi.org/10.1016/j.jim.2014.12.011.
14 Fernández de Cossio M, et al. Development of a Mouse Monoclonal Antibody for the Purification of a Yeast-Derived Recombinant Hepatitis B Surface Antigen. Minerva Biotechnologica 9, 1997: 76–84.
15 Valdés R, et al. A Summary of the Manufacture, Biochemical Characterization, and Virological Safety Demonstration of the Mouse MAb CB.Hep-1 Used To Produce the Hepatitis B Vaccine. Bioprocessing J. 8(3) 2009: 34–52; https://bioprocessingjournal.com/afp/J83-valdes.pdf.
16 Golsaz-Shirazi F, et al. Localization of Immunodominant Epitopes Within the “a” Determinant of Hepatitis B Surface Antigen Using Monoclonal Antibodies. Arch. Virol. 161(10) 2016: 2765–2772; https://doi.org/10.1007/s00705-016-2980-y.
17 Joan K-T H, Beena J-R., Hans-Jürgen N. Hepatitis B Virus (HBV) Subviral Particles as Protective Vaccines and Vaccine Platforms. Viruses. 12(2) 2020; https://doi.org/10.3390/v12020126.
18 Ganem D, Varmus HE. The Molecular Biology of the Hepatitis B Viruses. Annu. Rev. Biochem. 56, 1987: 651–694; https://doi.org/10.1146/annurev.bi.56.070187.003251.
19 Fontirrochi G, et al. A Mouse Hybridoma Cell Line Secreting IgG and IgM Antibodies with Specificity for the Hepatitis B Virus Surface. Biotecnología Aplicada 10(1) 1993: 24–30; https://elfosscientiae.cigb.edu.cu/PDFs/Biotecnol%20Apl/1993/10/1/p%2024%20-%2030.pdf.
20 Porath J, Axen R, Ernback S. Chemical Coupling of Proteins to Agarose. Nature 215(5109) 1967: 1491–1492; https://doi.org/10.1038/2151491a0.
21 Lowry DH, et al. Protein Measurement with Foling Phenol Reagent J. Biol. Chem. 193(1) 1951: 256–269.
22 Laemmli UK. Cleavage of Structural Proteins During the Assembly of the Head of Bacteriophage T4. Nature 227(5259) 1970: 680–685; https://doi.org/10.1038/227680a0.
23 Carney LS. Proteoglycans. Carbohydrates Analysis: A Practical Approach. Chaplin MF, Kennedy JF., Eds. IRL Press: Washington, DC, 1986: 135–136.
24 Woodman DD, Price C. Estimation of Serum Total Lipids. Clin. Chem. Acta 38(1) 1972: 39–43; https://doi.org/10.1016/0009-8981(72)90205-7.
25 Hage DS. A Survey of Recent Advances in Analytical Applications of Immunoaffinity Chromatography. J. Chromatog. B Biomed. Sci. Appl. 715(1) 1998: 3–28; https://doi.org/10.1016/s0378-4347(97)00621-x.
26 Hage DS. Affinity Chromatography: A Review of Clinical Applications. Clin. Chem. 45(5): 593–615 (1999).
27 Hage DS, et al. Pharmaceutical and Biomedical Applications of Affinity Chromatography: Recent Trends and Developments. J. Pharm. Biomed. Anal. 69, 2012: 93–105; https://doi.org/10.1016/j.jpba.2012.01.004.
28 Firer MA. Efficient Elution of Functional Proteins in Affinity Chromatography. J. Biochem. Biophys. Meth. 49(1–3) 2001: 433–442; https://doi.org/10.1016/s0165-022x(01)00211-1.
29 Köhler G, Milstein C. Continuous Cultures of Fused Cells Secreting Antibody of Predefined Specificity. Nature 256(5517) 1975: 495–497; https://doi.org/10.1038/256495a0.
30 Gustavsson PE, Larsson P. Support Materials for Affinity Chromatography. Handbook of Affinity Chromatography. 2nd ed. Hage DS, Cazes J, Eds. CRC Press: Baton Rouge, LA, 2005: 15–33.
31 Hermanson GT. Immobilization of Ligands on Chromatography Supports. Bioconjugate Techniques. 3rd ed. Academic Press: Cambridge, MA, 2013: 589–740; https://doi.org/10.1016/B978-0-12-382239-0.00015-7.
32 Kohn J, Wilchek M. A New Approach (Cyano-Transfer) for Cyanogen Bromide Activation of Sepharose at Neutral pH, Which Yields Activated Resins, Free of Interfering Nitrogen Derivatives. Biochem. Biophys. Res. Comm. 107(3) 1982: 878–884; https://doi.org/10.1016/0006-291x(82)90604-0.
33 Kohn J, Wilchek M. Mechanism of Activation of Sepharose and Sephadex By Cyanogen Bromide. Enzyme Microb. Technol. 4(3) 1982: 161–163; https://doi.org/10.1016/0141-0229(82)90109-0.
34 Hernández R, et al. Stirrer Tank: An Appropriated Technology To Immobilize the CB.Hep-1 Monoclonal Antibody for Immunoaffinity Purification. J. Chromatog. B 754(1) 2001: 77–83; https://doi.org/10.1016/s0378-4347(00)00590-9.
35 Hayworth DA, Hermanson GT. Calculate the Number of Immobilized Proteins per Bead of Agarose Affinity Support. Thermo Fisher Scientific: Waltham, MA, 2014; https://www.thermofisher.com/us/en/home/life-science/protein-biology/protein-biology-learning-center/protein-biology-resource-library/protein-biology-application-notes/calculate-number-immobilized-proteins-per-bead-agarose-affinity-supports.html.
36 Valdés R, et al. Vaccine Manufacture: Bringing Down Costs — Stability of CB.Hep-1 MAb and Immunosorbent Employed in the Rec-HBsAg Immunopurification for Hepatitis B Vaccine Manufacturing. Pharma. Manufact. Packing Sourcer 15(128) 2010: 76–79; http://www.samedanltd.com/magazine/15/issue/128/article/2656.
Mayté Quintana is a chemical engineer, Williams Ferro is head of MAb production, Airela Llamo is an engineer, Tatiana González is a graduate student, Miguel Castillo is a chemist, Yenisley Medina is an operational specialist for MAb purification processes, Yanet Villegas is a laboratory technician, and corresponding author Rodolfo Valdés is head of the monoclonal antibody department at Centro de Ingeniería Genética y Biotecnología, PO Box 6162, Avenue 31, No. 15802, Cubanacán, Playa, Havana, C.P. 10600; [email protected]; 53-7-2504101.
The authors declare no conflicts of interest. This article is adapted from “Impact of Ligand Density on Hepatitis B Virus Surface Antigen Immunoaffinity Chromatography Efficiency and Ligand Leakage,” published originally in the June 2020 edition of the Journal of Validation Technology.
You May Also Like


