Virus Assay Variation Is the Main Source of Variation in Viral Clearance Studies: Retrospective Analysis of a Large Data SetVirus Assay Variation Is the Main Source of Variation in Viral Clearance Studies: Retrospective Analysis of a Large Data Set
Biopharmaceuticals produced from mammalian cell cultures are susceptible to viral contamination. That risk is mitigated by applying complementary approaches. Those include extensive testing of cell banks, selecting low-risk raw materials, testing cultivations for viruses, and documenting the capacity of a purification process to inactivate and remove viral contaminants. The latter commonly is referred to as viral clearance and usually expressed as a log reduction value (LRV).
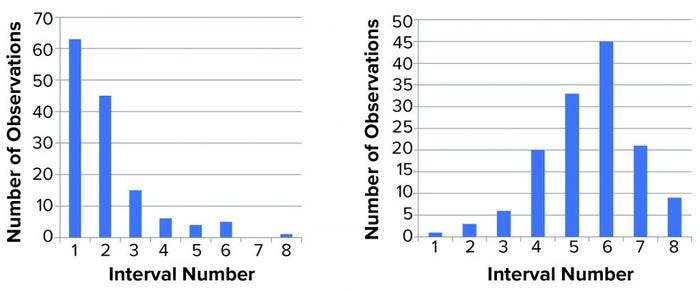
Figure 1: Distribution of titer (left) and log(titer) (right) values; we performed 139 determinations of titer of a stock positive-control material. The range (lowest to highest value) was divided into eight equally sized intervals (1–8), and the number of data points within each interval was counted and shown in a histogram. For a normal distribution, a symmetrical distribution around a mean value is expected.
Novo Nordisk has performed several viral clearance studies for different processes and process steps. The availability of that large data set enabled a comprehensive statistical analysis. Below, we present data from viral clearance studies using minute virus of mice (MVM) as a model virus. We conducted these studies for over 10 years, following current guidelines (1, 2).
Several regulations provide guidance on how viral clearance validation should be performed, including which model viruses to use and how to calculate the LRV factor. The key guideline document in this context is ICH Q5A(R1) (1). It provides a wealth of information with points to consider on how best to address studies of viral clearance. The guideline states that “viral clearance studies should include the use of statistical analysis of the data to evaluate the results. The study results should be statistically valid to support the conclusions reached.”
Although ICH Q5A(R1) states how precise virus-quantitation assays should be, it does not provide guidance on how the required statistical analysis of LRV could or should be performed. So biopharmaceutical manufacturers have interpreted the issue differently.
Viral clearance is studied using scaled-down versions of individual unit operations, such as chromatographic steps. A scaled-down system must represent the larger manufacturing-scale process to provide applicable data. Once a valid scaled-down model has been established, biomanufacturers run the process with process material deliberately spiked with virus.
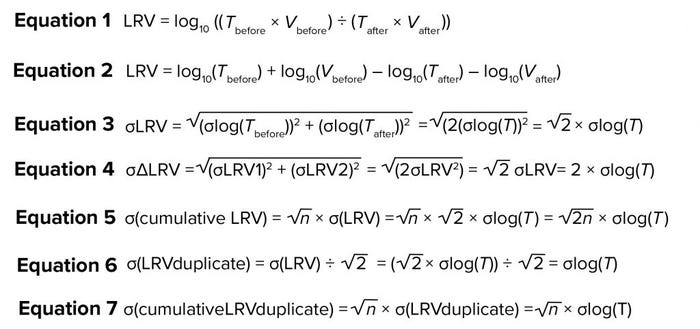
Concentrations (titers) of virus are measured in spiked process material and in resulting product fractions. Based on the titer T and volume V, LRV is calculated as in Equation 1 in the “Equations” box. Herein, we analyze a large data set of both titer and LRV determination to gain understanding of the variation in virus quantitation and its contribution to variance in LRV for individual steps and for overall (cumulative) LRV.
Analysis of Variance for Virus Quantitation Assay
ICH Q5A(R1) defines the following requirement for assays used to determine LRV: “The 95% confidence limits for results of within-assay variation normally should be on the order of ±0.5 log10 of the mean.” Implicitly, therefore, variation should be calculated for log(titer). Demonstration of a log-normal distribution will affect statistical evaluation of titer and LRV data. Variation in titer determination must be addressed during assay validation using standardized methods (1, 3). Although log(titer) typically is assumed to have a normal distribution, that assumption rarely is addressed during validation activities. Thus, we have evaluated the assumption closely.
For more than six years, Novo Nordisk has been using a single stock of MVM as a positive control in all MVM assays performed. The virus was stored in aliquots at temperatures lower than –70 °C in culture media without serum. When required for use, an aliquot was thawed for analysis, and the remaining amount was discarded to prevent virus loss during repeated freeze–thaw cycles. The assay used is a standard limiting-dilution assay: Serial tenfold dilutions of a test article are inoculated on permissive cells (eight wells per dilution), incubated at 37 °C, and the readout is based on cytopathogenic effect. Titer is determined as median tissue-culture infectious dose (TCID50) using Spearman–Kärber methods and expressed as TCID50/mL. During a six-year period, we performed 139 determinations of the stock solution (Appendix A, listed after References and Acknowledgments).
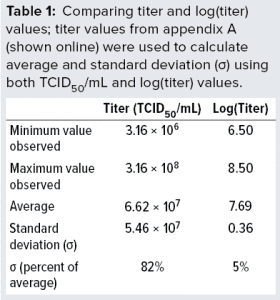 The data demonstrate full stability of the virus. Those 139 replicate values were used to determine minimum, average, and maximum values obtained. We also calculated the standard deviations (σ) and compared them with average values, as listed in Table 1. We calculated both absolute values of titers and values for log(titer). Table 1 lists a data summary for numerical and log-transformed titer values. The σ percentage of the average is very different for titer and log(titer). For any measuring system, a relative σ of 82% is an extreme value. But a value of 5% often is seen.
We then characterized the distribution of the data within each data set. Initially, we used a simple “group and graph” approach. The range (minimum to maximum) for each set of data (titer or log(titer)) was divided into eight equally sized intervals. The number of data points within each interval was determined and used to make the histogram in Figure 1. Those profiles show that numerical values are not distributed evenly around a mean value. The log(titer) values have a bell-shaped distribution with a high degree of symmetry. That type of graph provides a first illustration of titer variation that can be understood easily.
Figure 2 shows the same data set in normal quantile plots, which are used to visualize the extent to which a variable is normally distributed. If a variable is normally distributed, then the normal quantile plot approximates a diagonal straight line. Log(titer) showed good correlation with a normal distribution. The plot for titer, however, showed a marked deviation from normal distribution. Based on that, we considered log(titer) to be normally distributed. Thus, the requirement for precision of log(titer) set forth in ICH Q5A(R1) seems perfectly reasonable.
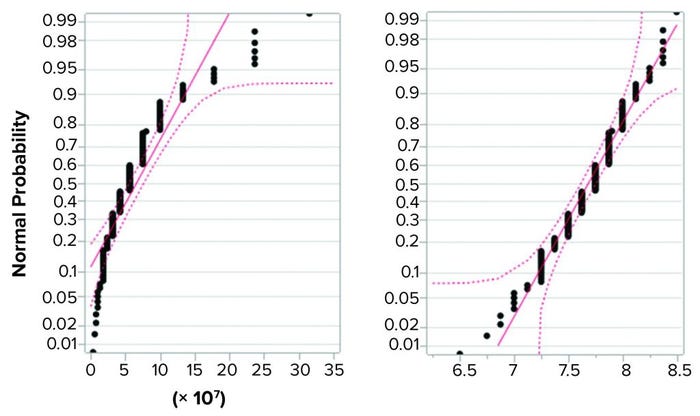
Figure 2: Normal quantile plot for titer (left) and log(titer) (right); a total of 139 determinations of titer of a stock positive control material were performed, and the resulting values were examined for fit with a normal distribution. Log(titer) showed good correlation with a normal distribution (right), but titer showed a marked deviation from normal distribution (left).
Analysis of Variance for a Large Data Set of Duplicate Determination of LRV
Data Set Used: For more than 10 years, we have conducted several viral clearance studies using the MVM assay described above. We studied different process steps: For this analysis, we first selected studies comprising duplicate determinations. Second, we removed studies without virus recovery. That was done because LRV in those cases would not reflect the actual clearance by the process step, but rather an estimated “minimal value” of no relevance to the statistical analysis described below. Our approach resulted in a total of 57 studies to be included in the analysis (Appendix B, listed after References and Acknowledgments).
For those 57 studies, the difference observed between individual determinations (e.g., for a given purification step) was calculated as ΔLRV. That difference reflects the combined variation for that particular process step (e.g., variation introduced through titer determinations, process step execution, and other factors). Equation 2 shows the calculation of LRV rewritten from Equation 1.
If we assume that variation in volume is negligible, then the contribution to variation from titer determination comes from the log10(Tbefore) and log10(Tafter). Because the assay for Tbefore and Tafter is the same, the value of σ is the same. So, σlog (Tbefore) = σlog(Tafter) = σ. Based on that and assuming that σlog(Tbefore) and σlog(Tafter) are independent of each other, the assay contribution to variation of LRV can be written as Equation 3. So, the contribution from the assay on σLRV will be about 1.4 σlog(T). This means that if samples from the same study are titrated repeatedly, the variation observed in LRV are expected to be 1.4 × σlog(T).
Now consider two separate viral clearance validation studies for a particular purification step, each with determination of LRV (LRV1 and LRV2, respectively). The difference between those two determinations (ΔLRV) will come from variations from the assay and from the process step. Initially, we can assume a situation in which virus removal is exactly the same in both experiments. In such a case, the only contribution to variation would be from the assay. Equation 4 shows how that contribution can be calculated using the previous equation. Thus, the effect of assay variance on ΔLRV variance can be predicted. Those calculations address only the influence from titer determination.
In some cases, two experiments will have different virus-reduction values. So the variance will be higher than expected from calculations above. From a virus safety perspective, variation in virus reduction is important. The real challenge is to determine that variation on the backdrop of variation coming from the virus assay.
The MVM assay used for all studies has been validated and meets the required precision for use in LRV studies (1, 3). During that validation, we determined σlog(T) to be 0.21 (data not shown). Using Equation 4, the contribution to σ(ΔLRV) would be 0.42.
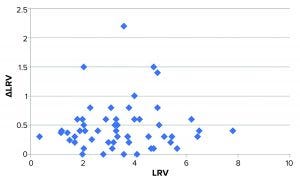
Figure 3: Plot of ΔLRV (numerical) as a function of LRV; the bulk of data points distribute fairly evenly around approximately 0.4. Four data points deviate markedly from this.
What Real Data (Duplicate Runs) Tell Us: Observed variation for our 57 studies was 0.62. That value is higher than expected from titer determination alone. Considering that titer determination is only one of several contributors to variation, this higher value is not surprising. We find it interesting, however, that the difference between expected and observed variation is no greater than 0.20. That indicates that the variation from virus titration is indeed a major contributor to the overall variation of LRV.
We speculated whether the variation (expressed as ΔLRV) depends on the magnitude of LRV (e.g., higher variation for effective viral clearance steps). Figure 3 shows a plot of ΔLRV as a function of LRV. If ΔLRV depended on LRV, then the plot would increase (data points would follow a diagonal in the plot). That is not the case, however.
The virus assay also could be the main source of variation — which would not be surprising. Some studies display larger-than-normal ΔLRV. The data set in Figure 3 shows that four experiments stand out with ΔLRV significantly greater than one. Table 2 lists those four experiments.
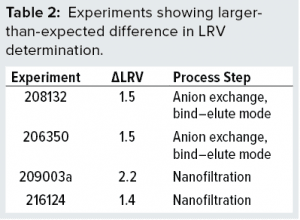 To understand our results better, we evaluated those four experiments. In the two anion-exchange studies, both virus and protein bind to the column. The bound protein is released by gradient elution. Further analysis using polymerase chain reaction (PCR) showed that virus eluted immediately following the protein of interest. That suggests that binding properties for the virus and protein are similar. So even small variations in tailing-edge cut could influence the amount of virus going into a peak fraction significantly. In such cases, minor variations in process-step execution can be expected to translate into LRV variation.
Experiment 209003a is a virus-filtration study using a 20-nm filter. It contains the first two values of a series of six replicates (the next four are in 209003b and 209003c). By chance, the lowest and highest of all six values appeared first and thus grouped together in 209003a. If σ is calculated for all six values, then σ(LRV) is 0.80. That value is considerably above the expected value of 2 × 0.21. So the output from this particular nanofiltration step does vary significantly more than expected from titration alone. Thus, there is a true difference in virus removal among those studies (209003a, -b, and -c). At the time (in 2009), the reason for that high variation was unknown.
Experiment 216124 also is a virus-filtration study using the same type of 20-nm filter. Follow-up experiments confirmed that the variation was larger than predicted based on assay variation alone. Investigative studies showed values ranging from 2.1 to 6 log or more for this particular step (data not shown). Those results were discussed with the filter manufacturer, and high viral load on the filter was identified as a possible cause. Reducing the viral load immediately resulted in more reproducible LRV, confirming viral load to be an important factor for reproducibility of this nanofiltration step. That effect also might explain the large variation observed in experiment 209003a because that one also was performed with a high virus load. Experiment 209003a was performed in 2009 — before we identified virus load as a critical factor for LRV observed in virus filtration. Because the project was closed in the meantime, study 209003 has not been revisited. Therefore, potential cause has not been verified formally for experiment 209003a.
It is important to note that high viral load is an artifact introduced during viral clearance studies and does not represent a real-life scenario. Thus, the poor reproducibility we observed in the above experiments is due to experimental conditions and does not reflect a reproducibility issue with the process steps. If data points for those poorly reproducible experiments are omitted from statistical analysis, then the observed σΔLRV is 0.43 (based on the remaining 51 data points), which is almost identical to that expected from virus analysis alone. So for robust steps (not prone to variation from process execution), the variation observed (difference between duplicates) corresponds to that expected from assay variation.
Lessons Learned
Lessons learned from the immediate statistical analysis presented of observed LRV can be summarized:
Increased LRV does not seem to result in larger variation in LRV.
For robust steps, variation in LRV can be predicted from variation in titer determination.
For the four studies with extraordinarily high ΔLRV, we identified plausible causes. In one case, elution conditions were similar for the protein of interest and for MVM, causing a significant contribution to overall LRV variation from the process step. In the other case, overloading a filter with virus caused poor and irreproducible virus retention. Virus filters in real-life situations are not met with such high concentrations of virus.
Rather, such filters should reduce undetectable quantities of virus to even lower levels.
If conditions leading to such high variation can be eliminated, then the variation in LRV determination is — for practical applications — related to the variation in titer determination alone. Even with no variation in virus reduction, LRV will vary between replicates. Interpreting such differences as being process-step variance would be unfounded statistically.
The challenge that remains is how to detect minor variations in virus reduction on the backdrop of LRV variance generated by the virus assay itself. Arguably, every viral clearance study should be repeated a sufficient number of times to achieve a reliable estimate of the σ of LRV for that particular process step. That could require several repeats. From a practical and economical perspective, such an approach is infeasible.
Our data set contains only studies performed with MVM as model virus. A similar analysis has been performed for another commonly used model virus, including murine leukemia virus (MuLV). The general conclusions are the same, but because substantially fewer studies were available for analysis (LRV in duplicate and with virus recovery) the conclusion is less well substantiated for that virus (data not shown). However, it does fit with the observation that if a step is robust, then LRV variation is dictated by the variation in virus determination.
Implications for Variance of Cumulative LRV
Availability of a reliable estimate of LRV variation for individual steps enables estimation of the variation (and hence confidence interval) for the cumulative viral clearance of an entire purification process. If the variations for the individual steps are known, then σ for the cumulative viral clearance can be calculated as shown in Equation 5, in which n is the number of steps contributing to cumulative clearance. That calculation is made under the assumption that variation of individual steps is independent.
That equation is for single determinations of LRV. If average of duplicate values is used for cumulative LRV, then σ(LRVduplicate) can be calculated by using Equation 6, which then leads to Equation 7 for the cumulative. If more than duplicate determinations are performed, then those calculations can be modified accordingly.
Although our results supplement previously published data by McAllister et al. and Ruppach (4, 5), the approach is different. We applied prior knowledge on assay precision to predict the effect of assay precision on LRV results. That enabled a cleaner view of process variance. Our approach also excluded all data points in which no virus was recovered (e.g., none of our data points are “larger than” values). That eliminated experimental noise generated by variation in viral spike levels. Finally, by basing our analysis on a large number of studies (n = 57), each with duplicate determination of LRV, we were able to separate process steps into those that fell within the expected (assay driven) variation and other steps that displayed more.
Assay Variation Is Key
Our data analysis for virus titrations and viral clearance studies has given valuable insight into the mechanisms leading to variation in LRV determination. Log(titer) values are normally distributed, which enables us to predict the impact of titer determination on LRV.
Provided that a processing step is robust (not prone to variation from process execution), we conclude that the major source of variance in viral clearance studies is in fact the assay used for quantitation of virus. Based on our results, a reasonable estimate of 95% confidence intervals can be made for cumulative clearance of a purification process. Such an estimate could form the foundation for statistical analysis as required by ICH Q5A(R1).
The large differences found between duplicates could indicate poor robustness of a given purification step. For such cases, estimating the actual variation is not easy. One practical and simple way of addressing that situation is to use the lowest value observed for calculating cumulative LRV with estimate of σ based on assay variation. Although that method certainly is not irreproachable from a statistical standpoint, it may be a reasonable practice when limited information is available.
In line with those considerations, we recommend the following approach for documenting viral clearance:
Perform duplicate determinations of LRV.
For studies in which ΔLRV is within that expected based on σlog(T), the average LRV value is reported.
For studies in which ΔLRV is larger than expected based on σlog(T), the lowest LRV value is reported.
Calculate cumulative clearance as the sum of LRV values as stated in the second and third points above.
Based on the number of steps and σlog(T), calculate confidence intervals for cumulative clearance.
The approach above could provide suitable statistical support when reporting the results of viral clearance in biopharmaceutical manufacturing processes, as required by ICH Q5A(R1) guidelines.
Acknowledgments
The authors are thankful to Peter Thyregod, Dept. 3680 CMC Process and Training Support, Novo Nordisk A/S, for statistical assistance during preparation of this manuscript.
References
1 ICH Q5A(R1): ICH Harmonized Tripartite Guideline — Viral Safety Evaluation of Biotechnology Products Derived from Cell Lines of Human or Animal Origin, Step 5. International Council for Harmonization of Technical Requirements for Pharmaceuticals for Human Use: Geneva, Switzerland, 1997.
2 CPMP/BWP/268/95: Note for Guidance on Virus Validation Studies: The Design, Contribution and Interpretation of Studies Validating the Inactivation and Removal of Viruses. The European Agency for the Evaluation of Medicinal Products: Amsterdam, the Netherlands, February 1996.
3 ICH Q2(R1): ICH Harmonised Tripartite Guideline — Validation of Analytical Procedures: Text and Methodology, Step 4. International Council for Harmonization of Technical Requirements for Pharmaceuticals for Human Use: Geneva, Switzerland, November 2005.
4 McAllister PR, et al. Use of a Statistical Strategy to Evaluate Sources of Variability in Viral Safety Experiments for a Recombinant Biopharmaceutical. Dev. Biol. Stand. 88, 1996; 111–121.
5 Ruppach H. Log10 Reduction Factors in Viral Clearance Studies. Bioprocess. J. 12(4) 2014: 24–30; http://dx.doi.org/10.12665/J124.Ruppach.
Appendices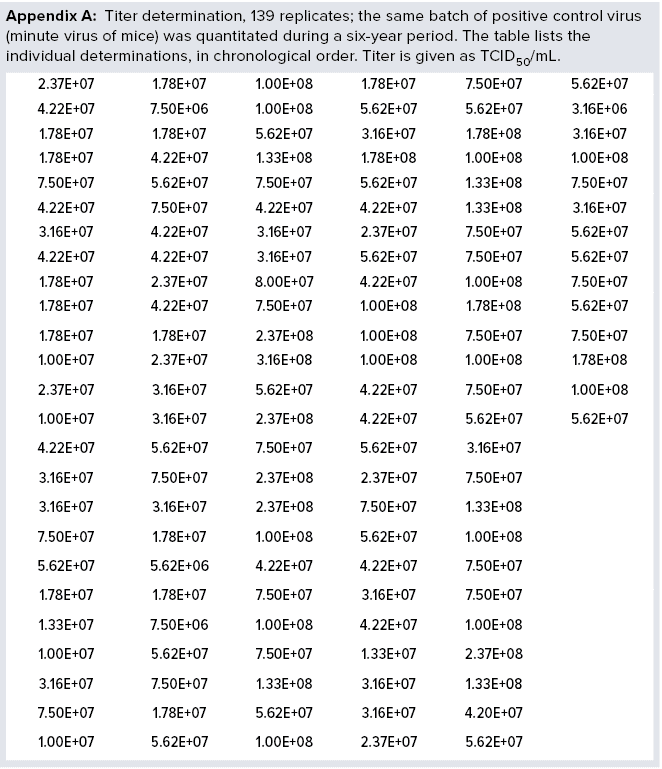

S. Kamstrup is principal scientist at Novo Nordisk A/S, Dept. 2299 BioPharm API Manufacturing Development, Nybrovej 80, DK-2820 Gentofte, Denmark; 45-3075-8598; [email protected]. J.L. Thomsen is development scientist at Novo Nordisk A/S, Dept. 609 Virology.
The authors declare that they have no competing interests.
You May Also Like


