Biological Characterization Using Protein Crystal MeasurementsBiological Characterization Using Protein Crystal Measurements
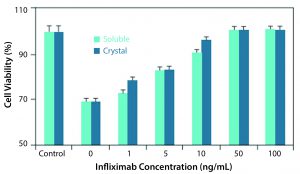
Figure 1: Comparison of soluble and crystalline infliximab in an in vitro bioactivity assay
Monoclonal antibodies (MAbs) have become important therapies and are projected to generate US$125 billion in sales by 2020 (1). Given that potential revenue, biopharmaceutical companies are highly motivated to find novel ways to deliver their drug products and extend patent lifetimes. Many such therapies are administered intravenously at low concentration and large volumes (2).
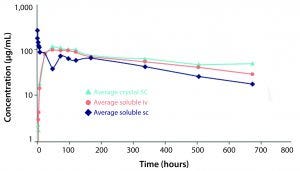
Figure 2: Comparison of pharmacokinetic profile of soluble infliximab administered subcutaneously (SC) and intravenously and of crystalline infliximab administered SC (light blue)
Althea’s Crystalomics technology facilitates delivery of traditional biotherapeutics with high concentration, low viscosity, and low volume by arranging a drug’s individual molecules in an ordered crystal lattice. The technology is a portfolio of patents surrounding crystallization, crosslinking, and complexation of proteins for therapeutic use. It includes know-how for finding ideal crystallization conditions and stable crystalline formulations as well as technologies to develop good manufacturing practice (GMP) processes for crystalline-suspension drug products. For patients, this allows for increased comfort using smaller needles through a subcutaneous injection rather than a lengthier intravenous infusion. Protein crystals produced with the Crystalomics platform also can be conjugated to obtain sustained-release properties, transforming daily treatments into weekly ones. The in vitro and in vivo efficacy profiles of crystalline therapies have proven to be just as effective as their soluble, larger-volume counterparts (3) (Figures 1, 2).
Formulation Development
In developing crystal drug-product suspensions for our client collaborators, we encounter several challenges (4). Excipients must be adjusted from the mother liquor crystallization solution into a formulation that is suitable for patient injection and contains ingredients that are generally recognized as safe (GRAS). Crystals that dissolve, aggregate, or are unstable are of no use. During formulation of crystal suspensions, the zeta potential of the crystals in a formulation buffer is of special note. Particles with a zeta potential under –25 mV or over +25 mV tend to repel each other and remain separate due to electrostatic repulsion (5).
Particle Characterization
Once several formulation candidates are identified, an extensive biophysical characterization of the crystal suspension for each candidate begins. MANTA Instruments, Inc.’s ViewSizer 3000 instrument allows formulators to capture particle-size distribution (PSD), rate of crystalline formulation, rate of dissolution, and (soon) zeta potential, all with only 1–2 mL of sample required. By combining several critical assays into a single measurement, this system has proven to be invaluable for conserving time and sample.
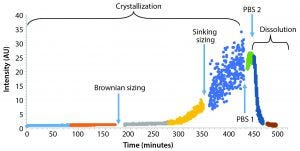
Figure 3: Monitoring detector intensity over time; crystal particles remained submicron in size for the first five hours. Size determination was determined by sinking speed for larger particles after about six hours. Addition of PBS at two time points stopped crystallization reaction and began dissolving the crystals, respectively.
The ViewSizer 3000 system is an advanced instrument for particle counting and sizing. It tracks particle Brownian motion (nanoparticle tracking analysis, NTA). Unlike conventional NTA that uses one laser (one wavelength) to illuminate particles in the colloid, the instrument incorporates a patent-pending system of three solid-state lasers with wavelengths of 450 nm, 520 nm, and 650 nm (typically), which match sensitivity profiles of the color video camera. By varying the power of the lasers (typically, blue has effective power inside a sample cuvette of 70 mW, green has 12 mW, and red has 8 mW), users can extend the range of particle sizes that the software can easily observe and track. That overcomes the basic drawback of conventional NTA: inability to size particles that form polydisperse samples. It turns out that such varying powers at different wavelengths also are crucial for detecting particles that change their size in time because of crystallization or dissolution.
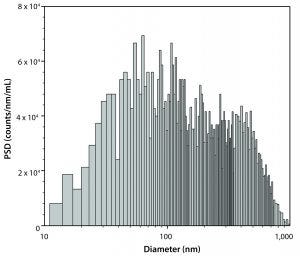
Figure 4: Submicron particle-size distribution measured at approximately three hours
Typically, samples for Brownian sizing require particles that are round with a ratio of ellipsoidal axis of <3 (this limitation stems from the assumptions of Einstein’s theory of Brownian motion). Viscosity of diluent should be less than about 4 cP. (An overly viscous diluent prevents measurable Brownian motion (Figure 4). The detection limit for particles in water that has viscosity of about 1 cP is <2 μm in diameter.) The refractive index of particles should be different from that of a diluent to achieve enough light scattering on particles. (Typically, refractive indices of >1.4 for particle-forming colloids in water n = 1.33 are considered good enough).
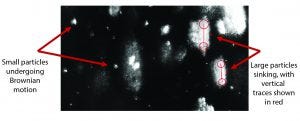
Figure 5: Composite of 300 video frames (7.5 s at 40 fps) of one video recorded at about 5.5 hours shows both smaller particles that undergo Brownian motion and very large ones that sink with a constant speed. By using the Stokes equation and known density of crystals, we can estimate that the diameter of the larger particles was more than 10 μm. Concentration was about 1.1 × 10⁶ particles/mL.
Experiment
Figure 3 shows an experiment of crystallization and dissolution that lasted about 8 h. During the first few hours, the rate of sample crystallization was very slow. After about 180 minutes of constant mixing of the colloid, we measured particle-size distribution by tracking the particles’ Brownian motion. Results showed a profile with a D50 particle diameter of 338 nm and a total particle concentration of about 2.5 x 10⁷ particles/mL. After nearly 300 minutes of the crystallization, the rate of crystallization increased considerably. Concentration and size of the largest particles (>5 μm in diameter) were sufficient to have particle size measured based on sinking speed (Figure 5).
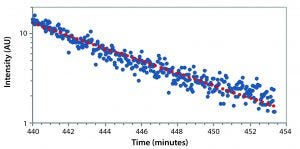
Figure 6: Monitoring crystal dissolution with decrease in detector intensity
After about 420 minutes, we added 1 mL of standard phosphate-buffered saline (PBS) into 2 mL of colloid, which stopped the process of crystallization. Addition of another 1 mL of PBS at 440 minutes into the experiment started quick dissolution of the particles. Figure 6 is an expanded version of the dissolution section from the initial figure.
We tracked the whole process of crystallization and dissolution automatically by observing varying intensity of scattered light recorded by the camera of the Brownian sizing instrument and processed by the standard ViewSizer 3000 software. This analysis included the length of recorded videos (typically several frames every few seconds, with mixing of the sample between videos), speed of mixing (revolutions of a stirrer per minute), control of the colloid’s temperature within 0.1 °C, and recording average total intensity of recorded images (frames) for each video as a time series.
The ViewSizer 3000 system saves time by removing the need to schedule image capture. It provides previously unattainable real-time size-distribution data at low volumes. By having insight and control over the crystallization reactions at low volumes, thus saving MAb product. Insights from the ViewSizer 3000 enable effective control of crystallization reactions, which is very helpful for the identification of ideal crystallization conditions and stable crystalline formulations.
References
1 Ecker DM, Jones SD, Levine HL. The Therapeutic Monoclonal Antibody Market. mAbs 7(1) 2015: 9–14.
2 Yang MX, et al. Crystalline Monoclonal Antibodies for Subcutaneous Delivery. PNAS 100(12) 2003: 6934–6939.
3 Kovarcik DP, Wittbold W. Protein Crystals: Reshaping Traditional Biotherapeutic Formulations. Drug Dev. Delivery 16(5) 2016.
4 Crystalomics Formulation Technology. Althea: San Diego, CA; http://altheacmo.com/wordpress/wp-content/uploads/2014/11/CrystalomicsBrochure_DownloadablePDF.pdf.
5. Yadav S, Shire SJ, Kalonia DS. Factors Affecting the Viscosity in High-Concentration Solutions of Different Monoclonal Antibodies. J. Pharm. Sci. 99(12) 2010: 4812–4829.
Corresponding author William Wittbold is the manager for Crystalomics technology transfer at Ajinomoto Althea Inc; [email protected]. Kuba Tatarkiewicz is a vice president of engineering at MANTA Instruments; [email protected].
William Wittbold and Kuba Tatarkiewicz
You May Also Like

