Comparing Culture Methods in Monoclonal Antibody Production: Batch, Fed-Batch, and PerfusionComparing Culture Methods in Monoclonal Antibody Production: Batch, Fed-Batch, and Perfusion
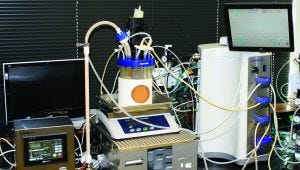
Photo 1: Perfusion setup using Repligen’s ATF-2 cell retention device — BioFlo 320 (right) controls gassing, pH, DO, and stirring in the bioreactor (center), and the Repligen controller (left) monitors pressure and alternating tangential flow through the hollow-fiber filtration device
Recombinant protein manufacturing with Chinese hamster ovary (CHO) cells represents over 70% of the entire biopharmaceutical industry (1). In fact, human monoclonal antibodies (hMAbs) produced by CHO cells have played a major role in both the diagnostic and therapeutic markets for decades. One of the first human–mouse chimeric MAbs to obtain FDA approval was Roche’s rituximab treatment for non-Hodgkin’s lymphoma, chronic lymphocytic leukemia, and rheumatoid arthritis. Since that approval in 1997, scores of chimeric, humanized, and human MAbs have gained approval and entered clinical use. More are coming in the future as many blockbuster MAb-based treatments reach the “patent cliff.” Indeed, process development and optimization are under way at many research and development (R&D) facilities as a number of companies race to develop biosimilars: highly similar copies of currently approved therapeutic hMAbs.
In development of all pharmaceutical production processes, including those involving hMAbs produced by CHO cells, decisions regarding the best process parameters and methods are made based on cost, time, and titer comparisons. Often, multiple scalable platforms are examined before a final process is transferred to pilot- or scale-up laboratories (2–8). Significant R&D time and dollars are invested to increase yields, reduce costs, and improve current bioreactor and bioprocess technologies (7). The objective of our research project was to compare the performance of batch, fed-batch, and perfusion processes — the three primary methods for hMAb production — using a single, laboratory-scale bioprocess controller.
In the batch method, all nutrients are supplied in an initial base medium. The fed-batch method adds nutrients once they are depleted. The perfusion method circulates medium through a growing culture, allowing simultaneous removal of waste, supply of nutrients, and harvesting of product. We compared two perfusion processes that differed in the way that cells are retained in a bioreactor. In one setup, we used an alternating tangential-flow (ATF) filtration device, which uses hollow-fiber filters to retain cells. In the second setup, we cultivated cells in a packed-bed bioreactor in which they were immobilized on a solid support matrix.
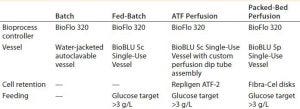
Table 1: Parameters common to the tested methods for production of a human monoclonal antibody (hMAb)
Materials and Methods
We compared four methods for hMAb production, controlling all experimental runs with an Eppendorf BioFlo 320 bioprocess control station. It’s important to note that except for the vessel and motor, no hardware changes were made between the individual runs. Table 1 overviews the four experimental setups.
Cell Line and Medium: All experiments used a suspension CHO cell line (from TPG Biologics, Inc.) expressing an hMAb that is a potential biosimilar. We cultivated the cells in CD-FortiCHO medium supplemented with 8 mM l-glutamine and 1% Gibco anti-clumping agent (both from Thermo Fisher Scientific). We prepared the bioreactor inoculum by cultivating cells in single-use baffled polycarbonate shake flasks (VWR International) in a New Brunswick S41i CO2 incubator shaker set at 100 rpm and 5% CO2, with passive humidification.
We inoculated cells from a cryopreserved stock vial at a density of 0.3 × 10⁶ cells/mL in a 125-mL flask with a 20% fill volume. After passaging them every other day for a week, we scaled-up the culture volume by increasing the flask size from 125 mL to 250 mL, 500 mL, and finally 1 L — all while keeping the inoculation density, percentage fill, and other parameters constant. Using this method, we inoculated each bioreactor with cells that were at about the same passage and duration of culture after thawing.
Vessels: For the batch experiment, we used a 2-L Eppendorf water-jacketed, autoclavable glass vessel. For the fed-batch process, we cultivated cells in an Eppendorf BioBLU 5c single-use vessel. For the ATF perfusion experiment, we connected a BioBLU 5c single-use vessel with a Repligen ATF-2 filtration device through an AseptiQuik fitting (0.375-in. hose barb fitting from Colder Products Company, Photo 1). For the packed-bed perfusion, we used a BioBLU 5p single-use vessel prepacked with Eppendorf Fibra-Cel disks.
Bioreactor Control and Process Parameters: The BioFlo 320 bioprocess control station controlled each experiment. It is easily programmable to give precise control of temperature, agitation, gas supply for sparging and overlay, pumping for addition and removal of liquids, and exhaust with heating or condensation. And it can use sensors for pH, dissolved oxygen (DO), reduction–oxidation, and CO2 for measurement and control.
Cultures were agitated at 100 rpm. The glass vessel and BioBLU 5c single-use vessels were equipped with a pitched-blade impeller. For the packed-bed bioreactor, we used a basket impeller. We measured DO using an ISM polarographic sensor (Mettler Toledo) and controlled it at 50% by sparging air or O2 at a flow of 0.02–1.00 SLPM in the three-gas automatic mode. We measured pH using a potentiometric sensor (autoclavable vessel) or optical pH probe (single-use vessels) and controlled it at 7.0 (deadband = 0.2) through a cascade to CO2 (acid) and 0.45 M sodium bicarbonate (base).
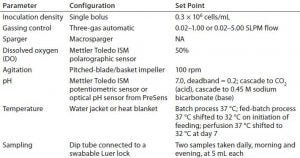
Table 2: Overview of process parameters for all cell culture runs; NA = not applicable
All cultures were inoculated at a final density ranging from 0.30 to 0.45 × 10⁶ cells/mL (with a target of 0.3 × 10⁶ cells/mL). We cultivated cells initially at 37 °C. In the batch run, we held that temperature constant. Because a temperature shift to 32 °C is common practice for increasing CHO cell protein expression, we decreased the temperature over the course of the longer processes: In the fed-batch run, we decreased it to 32 °C on initiation of feeding; in the perfusion processes, we shifted the temperature to 32 °C at day 7. Table 2 summarizes important process parameters. Inoculation density, gassing control, DO control, and agitation were the same for all four experiments.
We took two samples from the bioreactor daily (one in the morning and one in the evening) to check offline values such as pH, cell density, viability, glucose, ammonia (NH3), glutamate, lactate, and hMAb concentration. To collect the highest-quality sample from growing cultures, we connected a sterile 5-mL syringe to the sample port Luer lock, then removed and discarded a dead volume of 5 mL. Then we collected a second 5-mL sample in a new syringe to provide a fresh, viable sample for analytics and fresh sample storage. Later we accounted for that daily volume loss when calculating the fed-batch feed amounts.
We measured cell density and viability (by the Trypan blue exclusion method) using a Vi-Cell XR viability analyzer (Beckman Coulter), and we measured pH using an Orion Star 8211 pH meter (Thermo Fisher Scientific). Using the offline pH value, we restandardized the controller’s optical pH calibration daily to prevent discrepancies between online and offline measurements. We measured glucose, NH3, glutamate, lactate, and hMAb using a Cedex bioanalyzer (Roche). With the obtained offline glucose concentration, target glucose concentration in cultures was achieved by pumping an appropriate amount of 200 g/L of sterile glucose into the culture twice daily.
Direct cell counting was not possible for cultures grown in the packed-bed bioreactor because cells were growing in or on Fibra-Cel disks. However, it is possible to correlate cell growth with glucose consumption trends. We analyzed the cell density and glucose consumption trend in the ATF perfusion run and used the results to estimate cell density in the BioBLU 5p bioreactor. Triphasic glucose consumption represents lag phase, log phase, and a plateau for stationary phase. We used the trendline equations from each phase to calculate cell density.
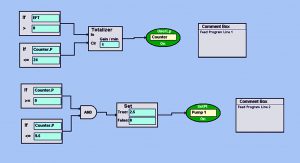
Photo 2: BioCommand block-logic automated feed program turns on the pump at a set point of 2.5 mL/min every day for 30 min (from 9:00 to 9:30 am). This allows a slow and steady feed each day so as not to shock growing cultures with rapid changes in osmolality or temperature. Set points such as pump speed (which control volume delivered) and duration of feed can be customized as the volume of a culture increases over time.
Feeding and Perfusion Control: In the fed-batch process, we fed the culture starting on day 3 with CD EfficientFeed C AGT nutrient supplement (Thermo Fisher Scientific) at 3% of the working volume per day. We automated that feed using Eppendorf’s BioCommand batch control supervisory control and data acquisition (SCADA) software. With a pump set point of 2.5 mL/min, we set the pump to run for 30 minutes each day at 9:00 am. Photo 2 shows this automated program.
Using logical function blocks, Feed Program Line 1 establishes a 24-hour clock (the “Counter”) that runs for 24 hours before resetting to zero. Feed Program Line 2 uses the Counter loop to turn on Pump 1 at a set point of 2.5 mL/min for 30 minutes, thus automating a slow-rate daily nutrient feed. In addition to using that nutrient feed, we bolus-fed the culture with glucose to a final target concentration of >3 g/L twice daily. To accomplish that, we used the offline glucose concentration to calculate an appropriate dose of 200 g/L sterile glucose, as mentioned above. The process ended when cell viability and density of the culture began to decline.
In both perfusion processes, we performed bolus glucose feeding as described above, with a final target concentration of >3 g/L. In the ATF-enabled perfusion, we set the filtration rate to 1 L/min, as recommended by the manufacturer. On day 12, cell density had risen to >60 × 106 cells/mL. To prevent filter clogging, we increased the ATF flow rate to 1.2 L/min, where it remained until the end of the experiment.
During cultivation, cell density reached a point at which the demand for DO was too high for the 1-SLPM maximum flow sparge drawer. So we used a 5-SLPM maximum flow overlay drawer using the same three-gas automatic gassing control algorithm. But the tube was connected from the controller’s overlay outlet to the vessel’s sparge inlet. Thus, a maximum flow of 5 SLPM could be achieved.
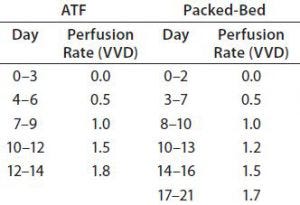
Table 3: Perfusion rates of ATF and packed-bed perfusion processes; VVD = vessel volumes per day
For both perfusion experiments, we determined perfusion rates as follows: Based on culture health as indicated by growth rate and metabolite concentration, we steadily increased the perfusion rate in vessel volumes per day (VVD). Our goal was to keep NH3 levels <6 mmol/L and prevent consumption of lactate by adjusting glucose concentration and perfusion rate. Table 3 lists the adjustments we made over time. Cultures were perfused with medium prepared as described above but with one modification: Perfusate glutamine concentration was 2 mM. We decreased glutamine feeding concentration to reduce ammonia production.
Results
For each of the four cultivation conditions, we compared cell growth and viability, metabolic profile, and the total amount of product expressed.
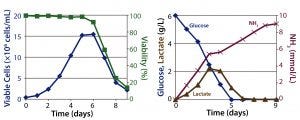
Figure 1: Batch culture results; (left) cell density and percent viability, (right) metabolic profile
Batch Culture: The batch process reached a peak viable cell density of 1.5 × 10⁷ cells/mL on day 6 before sharply declining. On day 5, the cells had consumed all of their initially supplied glucose. Lactate concentration increased up to 2.2 g/L by day 4. Time-shifted to the decrease of glucose concentration, it then decreased — which suggests that those cells underwent a metabolic switch from glucose to lactate consumption. Ammonia concentration increased continually up to 9 mmol/L on day 9 as a result of cell death (Figure 1). Within 9 days, the culture had produced a total amount of 0.9 g hMAb.
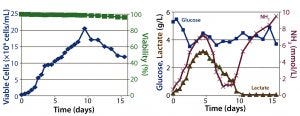
Figure 2: Fed-batch culture results; (left) cell density and percent viability, (right) metabolic profile
Fed-Batch Culture: In the fed-batch process, we fed the culture daily starting from day 3 with glucose and CD EfficientFeed C AGT nutrient supplement. As a result, glucose concentration remained >3 g/L throughout the entire process. We achieved a peak viable cell density of 2 × 10⁷ cells/mL. By contrast with the batch process, cell viability remained near 100% even after 14 days of culture, most likely because of the constant supply of glucose and other nutrients. Feeding the culture also delayed the onset of lactate consumption, which began around day 5 and was not complete until day 10.
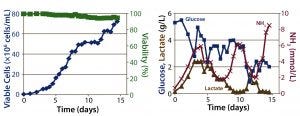
Figure 3: ATF perfusion results; (left) cell density and percent viability, (right) metabolic profile
Similarly, within the first five days of the process, ammonia concentration increased to ~4 mmol/L, then dropped back to initial levels temporarily before climbing to toxic levels late in the run (Figure 2). This phenomenon is attributed to metabolic changes that occur in response to high lactate concentrations, as has been documented (9). Within 16 days, the culture had produced a total amount of 4.5 g of hMAb.
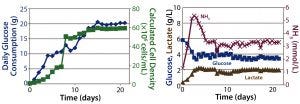
Figure 4: Packed-bed perfusion results; (left) cell density calculated from glucose consumption, (right) metabolic profile
Perfusion Cultures: We compared two perfusion processes that used different methods for cell retention. The ATF filtration method ran for 14 days, and the packed-bed perfusion ran for 21 days. The former process reached a peak cell density of 7.4 × 10⁷ cells/mL at >90% viability and produced a total antibody titer of 11.5 g. The latter process reached a peak cell density of ~ 6 × 10⁷ cells/mL and produced 7.4 g of antibody. We increased the perfusion rates over the course of these processes to a maximum of 1.8 VVD and 1.7 VVD, respectively (Table 3).

Table 4: Comparing peak cell densities and antibody titers obtained in the different processes
For both perfusion cultures, we targeted glucose to be ≥3 g/L. In the ATF process, glucose concentration varied. That can be attributed to the fact that the consumption rate was so much higher than in the fed-batch process that it was challenging to keep up with cellular demands. In the packed-bed perfusion, we expected a high consumption rate and therefore managed to keep glucose levels more stable. In both processes, lactate concentration remained <2.5 g/L which provided for a different ammonia trajectory than in the fed-batch. Ammonia levels increased and decreased based on our perfusion rate changes (Figures 3 and 4). Table 4 summarizes the peak cell densities and antibody titers obtained in all these different processes.
Discussion
The BioFlo 320 system allows for seamless transition between bioprocess protocols, which enabled us to compare the performance of batch, fed-batch, and perfusion processes using a single bioprocess control station. This was critical to our study because the ease of transitions among methods was part of our evaluation.
With the ATF perfusion process, we achieved a noteworthy peak cell density of 7.4 × 10⁷ cells/mL, producing 11.4 g of antibody within two weeks. That represents 12-fold and 2.5-fold increases of product output compared with our batch and fed-batch processes, respectively. It is twofold higher than is reported elsewhere for antibody production using a similar MAb-producing CHO cell line in an ATF perfusion process (10).
The choice of which culture mode to use for production depends on budget, time available, and the quantity of hMAb required. Simple batch cultures may be the least expensive and fastest approach to production of very small hMAb quantities, given the use of simple equipment and processes with minimal human intervention over periods as short as five days, with a comparably low volume of medium. Fed-batch culture provided a fivefold increase in hMAb yield, but over a substantially longer period, requiring much more human intervention and equipment that is more complex, although medium use remained low.
The ATF perfusion method provided the highest yields of both viable cells and hMAb. However, it required additional capital investment and laboratory space for the ATF filtration unit and controller, with operation of complex equipment, taking multiple daily samples, and monitoring of vessel volumes. It also used a much larger quantity of cell culture medium. Setup of the packed-bed vessel involved simply connecting it to the control station for standard monitoring of vessel volume, and sampling was uncomplicated. Moreover, the method produced peak cell densities close to that of the ATF process but without additional capital equipment or complex operations.
Application of single-use equipment is on the rise in bioprocess development because it reduces turn-around times and cross-contamination risks. We used BioBLU single-use vessels successfully for our fed-batch process as well as both perfusion culture modes. Adding an ATF filtration device and using a solid growth-support matrix in a packed-bed vessel both allow for simple cell retention with higher cell and product yields. Much greater productivity can be achieved through prolonged perfusion culture with up to two or three months of continuous antibody harvesting after a single inoculation.
References
1 Jayapal KP, et al. Recombinant Protein Therapeutics from CHO Cells: 20 Years and Counting. Chem. Eng. Prog. 103(7) 2007: 40–47.
2 Sherman M, et al. Continuous Cell Culture Operation at 2,000-L Scale. BioProcess Int. 14(7) 2016: S22–S28.
3 Luo J, et al. Comparative Metabolite Analysis to Understand Lactate Metabolism Shift in Chinese Hamster Ovary Cell Culture Process. Biotechnol. Bioeng. 109(1) 2012: 146–156; doi:10.1002/bit.23291.
4 Dean J, Reddy P. Metabolic Analysis of Antibody Producing CHO Cells in Fed-Batch Production. Biotechnol. Bioeng. 110(6) 2013: 1735–1747; doi:10.1002/bit.2482.
5 Li F, et al. Cell Culture Processes for Monoclonal Antibody Production. mAbs 2(5) 2010: 466–477; doi:10.4161/mabs.2.5.12720.
6 Zhang H, et al. Rational Development of a Serum-Free Medium and Fed-Batch Process for a GS-CHO Cell Line Expressing Recombinant Antibody. Cytotechnol. 65(3) 2013: 363–378; doi:10.1007/s10616-012-9488-4.
7 De Jesus M, Wurm FM. Manufacturing Recombinant Proteins in kg-Ton Quantities Using Animal Cells in Bioreactors. Eur. J. Pharm. Biopharm. 78(2) 2011: 184–188; doi:10.1016/j.ejpb.2011.01.005.
8 Sauer PW, et al. A High-Yielding, Generic Fed-Batch Cell Culture Process for Production of Recombinant Antibodies. Biotechnol. Bioeng. 67(5) 2000: 585–597; doi:10.1021/bp9602360.
9 Lao MS, Toth D. Effects of Ammonium and Lactate on Growth and Metabolism of a Recombinant Chinese Hamster Ovary Cell Culture. Biotechnol. Prog. 13(5) 1997: 688–691; doi:10.1021/bp9602360.
10 Poles-Lahille A, et al. Evaluation of Single-Use Bioreactors for Perfusion Processes. BMC Proc. 7(S6) 2013: 101; doi:10.1186/1753-6561-7-S6-P101.
Stacey S. Willard is a senior bioprocess technical applications specialist, Amanda Suttle is an associate scientist, Xiaofeng (Kevin) Han is a research scientist, Michelet Dorceus is a bioprocess applications specialist, and corresponding author Ma Sha is director of technical applications at Eppendorf, Inc., 175 Freshwater Boulevard, Enfield, CT 06082; 1-860-253-6649; [email protected]; www.eppendorfna.com. Pei-Jiun Chen is president of TPG Biologics in Taipei, Taiwan.
You May Also Like


