After production and purification of biopharmaceuticals generated by cell culture expression systems, endogenous cell line proteins — commonly referred to as host-cell proteins (HCPs) — sometimes contaminate finished products. HCPs can elicit an immune response following administration of those drugs to patients (1), and cause potentially deleterious side effects. It is therefore imperative to minimize HCP contamination in finished biologics. Regulatory health authorities require monitoring of HCP contamination. They expect validation of each purification process to demonstrate its capability to consistently remove HCPs to an acceptable level from batch to batch, according to the 47th report of the World Health Organization’s Expert Committee on Biological Standardization (2).
PRODUCT FOCUS: PROTEIN BIOLOGICS
PROCESS FOCUS: MANUFACTURING
WHO SHOULD READ: PRODUCT AND PROCESS DEVELOPMENT, ANALYTICAL, FORMULATIONS, AND QA/QC PERSONNEL
KEYWORDS: HOST-CELL PROTEIN, Sp 2/0 CELLS, IMMUNOASSAYS, DATA ANALYSIS SDS-PAGE, STAINING, WESTERN BLOTTING
LEVEL: ADVANCED

Myriad distinct cell culture systems are used in manufacturing. Because of the molecular complexity of cell culture systems and the uniqueness of individual manufacturing processes, no standard HCP detection methodology or specifications of HCP contamination are defined in any regulatory guideline. Different manufacturing processes (e.g., perfusion bioreactors or fed-batch cultures) can generate different expression profiles of HCPs from the same production cell line that can be detected by regular gel electrophoresis (data not shown). The range of protein expression profiles from varied manufacturing processes justify development of a process-specific method for HCP detection.
Assay methodologies traditionally used for detecting HCPs include sodium dodecyl sulfate polyacrylamide gel electrophoresis (SDS-PAGE) with silver staining, high-pressure liquid chromatography (HPLC), Western blot, and enzymelinked immunosorbent assay (ELISA) (3,4). Recently, a slot blot system has been developed (5). An ELISA is the most preferred assay format to support process development and lot release because of its advantages over other methodologies: high sensitivity, specificity, objectivity, throughput, and robustness. Some precedents demonstrate successful development of HCP detection ELISAs in prokaryotic expression systems (6,7,8,9). But no report has yet been published on development of an HCP detection ELISA for any therapeutic biologic produced in mammalian expression systems.
Here we report for the first time the development of a process-specific ELISA for detection of HCPs in one of our biopharmaceutical products: a fully human monoclonal antibody IgG1, Golimumab (trade-named Simponi), which is manufactured using a perfusion bioreactor process. This commercial product is approved for treatment of rheumatoid arthritis. The production cell line used to generate the antibody is the commonly used mouse myeloma cell line Sp 2/0, for which a commercially generic HCP detection ELISA is available from Cygnus Technologies (www.cygnustechnologies.com). The purpose of our study was to develop, characterize, and establish an in-house, process-specific Sp 2/0 HCP detection ELISA and then evaluate its performance in direct comparison with the Cygnus ELISA. We ultimately hoped to determine whether
the in-house method is adequate for detecting and monitoring levels of HCP in our product at different stages of manufacturing
the Cygnus ELISA was suitable to evaluate HCP concentration in process intermediates and final drug product.
Similar performance between the two would offer us the flexibility of relying on the Cygnus ELISA for all future analyses and obviate the necessity of generating in-house HCP detection reagents.
Materials and Methods
Generation of Sp 2/0 HCP Lysate: We inoculated a 3-L perfusion bioreactor with a null-plasmid Simponi mock-transfected Sp 2/0 cell line and cultured the cells in production media. Cells were pelleted by centrifugation for 10 minutes at 930g, 4 °C, washed four times with cold phosphate-buffered saline (PBS), then lysed on ice for 30 minutes in 0.1% NP-40, 1.2 mM EDTA, and PBS containing protease inhibitors. Lysate was clarified by centrifugation for 30 minutes at 930g, 4 °C, and sterile filtered with 0.22-µm filters, then stored at –70 °C in aliquots. We quantified the HCP content using a Bradford protein assay from Bio-Rad Laboratories (www.bio-rad.com) following the manufacturer’s protocol.
Generation of Anti-HCP Antibodies: Bioburden and Limulus amoebocyte lysate (LAL) testing were performed on in-house–generated Sp 2/0 HCP lysates to determine microorganism and bacterial endotoxin levels. For antisera generation, we immunized New Zealand White (NZW) rabbits on a schedule outlined in Figure 1. Three NZW rabbits were injected intradermally with 500 µg of HCP lysate in complete Freund’s adjuvant on days 0, 7, 14, 28, and 56, and again on day 84 if necessary. The animals were bled on days 45, 52, 66, 73, and 80. We tested the antisera titer using a standard ELISA with the Sp 2/0 lysates as coating antigens until the titer plateaued.

Figure 1: ()
For purification of anti-HCP IgGs from the rabbit hyperimmunized sera, we diluted sera of production bleed from three rabbits (#4631, #4632, and #4842) threefold in 50 mM sodium phosphate, 150 mM NaCl, and 0.1% Tween 20 (v/v) with PBS-T at pH 7.4 before loading 100-mL XK 26 columns packed with Amersham MabSelect resin from GE Life Healthcare (www.gelifesciences.com). We washed the columns with two column volumes of water-for injection (WFI) and equilibrated them with two column volumes of PBS-T (pH 7.4). After loading them, we washed the columns to baseline with two column volumes of PBS-T (pH 7.4). Protein A affinity–purified IgGs eluted in 0.1 M sodium citrate at pH 3.5, with the pH adjusted to ~7.0 by a 1 M Tris-ba
se solution. All eluates were concentrated and diafiltered into eight exchanges of PBS, then stored at –70 °C in aliquots.
Polyacrylamide Gel Electrophoresis, Silver Staining, and Western Blotting: For one dimensional (1D) gel electrophoresis, we diluted protein samples 1:1 in Laemmle sample buffer from Bio-Rad with (reducing) or without (nonreducing) 0.015 mg/mL dithiothreitol (DTT). We heated the dilutions at 95 °C for two minutes, then diluted them with 1 M Tris buffer containing 0.1 mg/mL iodoacetamide before heating for an additional minute at 95 °C. Then we loaded the samples onto precast, 10–20% gradient polyacrylamide gels from Daiichi Pure Chemicals (www.daiichichem.jp) prefocused at 10 mA per gel for 20 minutes, then ran them at 25 mA per gel until the dye front reached the bottom of the gels.
To perform two-dimensional (2D) electrophoresis analysis on HCPs, we mixed a total of 17 µg of HCP proteins with 200 µL of rehydration buffer, which was prepared by mixing 8 µL of the ampholyte at pH 3–10 from Bio-Rad with 1 mL of destreak rehydration buffer from GE Healthcare. We then loaded the samples onto the focusing tray in Protean IEF cell IPG strips from Bio-Rad covered by 1.8 mL of mineral oil (also from Bio-Rad) and kept them at room temperature overnight. The next day, wet wicks from Bio-Rad were inserted underneath both ends of those IPG strips. We ran the rehydrated strips at 8,000 V for 40,000 Vhr and 500 V for maintenance in Protean isoelectric focusing cell. Then we treated separated IPG strips at room temperature for 10 minutes in an equilibration buffer (50 mM Tris at pH 8.8 with 6 M urea, 30% glycerol, 2% SDS, and 0.002% bromophenol blue) containing 2% DTT and then for 10 minutes in an equilibration buffer containing 2.5% iodoacetamide. Equilibrated strips were inserted onto 8–16% Criterion precast polyacrylamide gels from Bio-Rad, sealed by agarose (also from Bio-Rad), and run at 150 V for 90 minutes. One gel was silverstained, and the duplicate gel was transferred to a PVDF membrane for immunoblotting against HCPs.
Staining: For Coomassie blue staining we used a Coomassie Brilliant Blue G-250 kit from Thermo Scientific Pierce Protein Research (www.piercenet.com). We used a silver staining kit from Thermo Scientific Owl (www.owlsci.com) for all silver staining procedures according to the manufacturer’s instructions. To perform silver staining of 2D gels, we fixed gels for 10 minutes in fixing solution 1 (50 mL methanol, 10 mL acetic acid, and 40 mL water), and 15 minutes in fixing solution II (30 mL methanol, 10 mL acetic acid, 55 mL water, and 5 mL fixing reagent provided by the kit). Fixed gels were pretreated for 10 minutes in a pretreatment solution (50 mL methanol, 45 mL water, and 5 mL pretreatment reagent provided by the kit). After performing two consecutive five-minute water washes, we stained the gels for 15 minutes in silver staining solution (5 mL staining solution A and 5 mL solution B from the kit in 90 mL of water). After performing two more consecutive five-minute water washes, we developed the gels for about five minutes in a developer solution. Then we stopped color development and stored the gels in water until their imaging.
For Western blotting, we transferred proteins to PVDF membranes from Bio-Rad in Trisglycine–20% methanol buffer for an hour at 100 V. Following transfer, the membranes were blocked overnight in 5% dry milk/PBS at 2–8 °C, washed three times with either in-house (0.1% Tween-20/PBS) or wash buffer from the Sp 2/0 HCP Western Blot detection kit (Cygnus Technologies), and probed using either the in-house rabbit anti-HCP IgG (1:50 in 0.1% w/v BSA) for an hour or the Cygnus goat anti-HCP horseradish peroxidase (HRP)–linked IgG for two hours. We washed the membrane blotted with our in-house anti-HCP IgG three times and probed it for an hour using a 1:5,000 dilution of goat anti-rabbit HRP detection antibody from the Jackson Laboratory (www.jax.org). Both membranes were washed and incubated with HRP substrate from Bio-Rad for ~20 minutes before reaction termination with super Q H2O and followed by image acquisition.
We captured images of stained gels and blotted PVDF membranes using a BioRad GS-800 densitometer. We analyzed the 2D gel images using Progenesis SameSpot software from Nonlinear Dynamics Ltd. (www.nonlinear.com).
Development of Sp 2/0 HCP ELISA: To generate detection antibody for the ELISA, we used Endogen EZ Link kits from Pierce to biotinylate purified rabbit anti-HCP IgGs according to the manufacturer’s protocol. Briefly, 3 mL of rabbit IgG at 2 mg/mL was incubated with 10 mM biotin solution for two hours on ice using a rotary platform. Following the biotinylation reaction, IgGs were dialyzed in PBS overnight at 4 °C, aliquoted, then stored at –70 °C until use. Nunc Maxisorp 96-well EIA plates (www.nuncbrand.com) were coated overnight with 1 µg per well of rabbit anti-HCP capture antibody in 100 µL PBS, at 4 °C. The following day, we washed those plates in 0.1% PBS-T, blocked them in 1% BSA/PBS for an hour at 37 °C, washed them again, and incubated them with a series of concentrations of HCP lysates from 1 to 1,000 ng/mL for an hour at 37 °C. Following incubation, the plates were washed and incubated with 1:2,500 to 1:15,000 dilutions of biotinylated detection antibody on a shaker (300 –350 rpm) for an hour at room temperature to empirically determine the optimal detection antibody concentration. We washed the plates and incubated them with Endogen streptavidin-conjugated horseradish peroxidase (SA-HRP) from Pierce on a shaker for an hour at room temperature. Then plates were washed and incubated with 100 µL/well o-phenylenediamine (OPD) substrate for 10 minutes in the dark. We stopped the HRP reaction by adding 50 µL/well of 4 N sulfuric acid and analyzed the plates at 490 nm (absorbance) and 650 nm (reference) using a standard plate reader.
Data Analysis: For standard curve generation, we plotted theoretical HCP concentrations (based on Bio-Rad protein assay determination for our in-house lysate and the manufacturer’s stated concentration for Cygnus lysate) as a function of mean optical density (OD) for replicate samples. The results were fitted by four-parameter nonlinear regression using the SoftMax Pro program from Mindvision Software (www.mindvision.com). Standard curves for each ELISA were generated using the HCP lysate that corresponded to each assay. We determined the measured HCP concentration of individual experimental replicates by interpolation from standard curves, then averaged them to determine mean HCP concentration, which was presented along with standard deviation (Std. Dev) and coefficient of variance (%CV). We calculated the percent recovery of HCP lysates by dividing the mean HCP concentration by the theoretical concentration (determined using the Bio-Rad protein assay or manufacturer specification), then multiplying by 100%. And we calculated the percent recovery of HCP spiked into a reference standard Simponi matrix by dividing the difference between the measured HCP concentrations from spiked and unspiked samples by the HCP theoretical concentration, then multiplying by 100%.
Results
Characterizing In-House – Generated HCP Lysates and Rabbit Anti-HCP Polyclonal Antibodies: To support the manufacturing process of our therapeutic antibody and monitor the level of HCPs potentially present in it, we needed a specific and robust immunoassay. Mock-transfected Sp 2/0 host cells were grown in a perfusion bioreactor using a process identical to the
one used for manufacturing the Simponi product. We generated two individual batches of cell lysates from mock-transfected Sp 2/0 cells treated with a low concentration of the detergent. In-house prepared lysates were used as immunogens for generating rabbit hyperimmune sera against Sp 2/0 HCPs. We used lysates from mock-transfected cells because they closely approximate our production cell line proteins without the product.
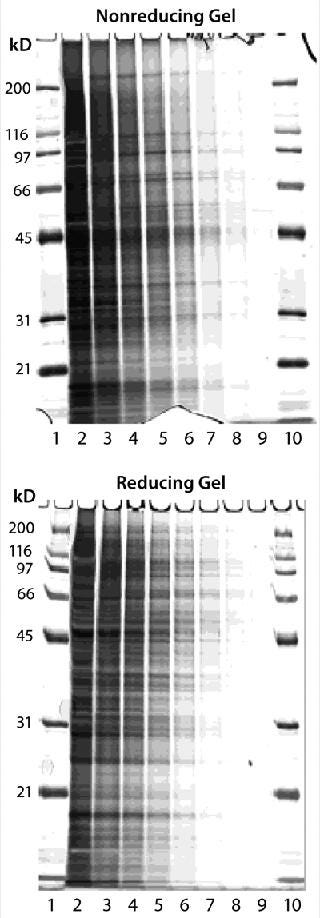
We performed nonreducing and reducing SDS-PAGE analyses on the Sp 2/0 lysates. Silver staining of the gels revealed that the in-house– prepared lysates consisted of a complex mixture of cellular proteins, with minimal protein degradation during preparation (Figure 2), as demonstrated by a wide spectrum of molecular weights. We observed protein clustering in the low–molecular-weight range when protease inhibitors were absent (data not shown). Then we used the lysates as immunogens to generate polyclonal rabbit anti-HCP sera, immunizing three NZW rabbits according to the Figure 1 schedule. The rabbit anti-HCP IgGs were purified using a Protein A column from all three immunized rabbit antisera. We did not use an affinity column with immobilized HCP because of concern regarding poor recovery of the polyclonal antibodies. Recovery could be negatively impacted by denaturation of antigen upon immobilization, denaturation, or loss of HCP antibody upon elution. We used Western blotting and ELISA to screen the three rabbit anti-HCP antibodies, and all three were highly reactive to the HCP lysates (data not shown).

Figure 2: ()
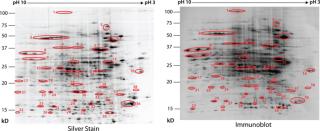
To characterize the spectrum of proteins recognized by our rabbit anti-HCP antibodies, we used 2D gel electrophoresis and compared the HCP protein profiles between silver-stained gels and the HCP immunoblots. A total of 17 µg of Sp 2/0 HCP proteins was separated by 2D gel electrophoresis as described above. We performed twin sets of gels. After electrophoresis, one set was processed using silver staining, and the other was transferred to PVDF membrane and subsequently blotted with the rabbit anti-HCP antibody (#4631). Protein spots observed on the HCP immunoblot were aligned against those identified on the silver-stained HCP gel by Progenesis SameSpot soft ware. We found 369 spots detected on the HCP immunoblot to match the same spots out of a total 423 proteins on the silverstained gel, indicating that 87% of the HCP proteins were reactive with and recognized by the HCP antibody reagent (Figure 3). For easy viewing, we manually circled and numbered representative spots identified by both immunoblot and silver staining in Figure 3. We concluded that nearly all HCP proteins can be detected by the in-house–generated anti-HCP antibody.

Figure 3: ()

Figure 4: ()
Development of Sp 2/0 HCP Detection ELISA: Despite a lack of clear regulatory guidance on acceptable limits of HCPs, several publications have estimated the level that can potentially elicit a measurable immune response in humans (3,5). Based on those estimates and the maximal dosing scenario for antibody therapeutics, sensitivity of the intended HCP ELISA assay should be targeted to detect about 1 ng of HCP per milligram (or ppm) of antibody product.
We developed a standard sandwich ELISA method as described above. Purified anti-HCP IgGs served as a capture antibody, and biotinylated anti-HCP IgGs were the detection antibody. ELISAs demonstrated that all three anti-HCP IgG preparations exhibited specific binding to HCP lysates, with IgG preparation #4631 demonstrating the best performance characteristics based on sensitivity (greatest OD measurements at a fixed antibody concentration) and assay reproducibility (low%CV) (Table 1).
Table 1: Performance of HCP detection antibodies 4631, 4632, and 4842

Table 1: Performance of HCP detection antibodies 4631, 4632, and 4842 ()
A spike/recovery study of the HCP lysate spiked into the Simponi primary reference standard (PRS) demonstrated recovery efficiencies across the linear range of the assay, 63–109% recovery for anti-HCP IgG preparation #4631, 78–360% recovery for #4632, and 63–95% recovery for #4842 (Table 2). We observed no reactivity in unspiked PRS material or production media, demonstrating specificity of the anti-HCP IgG preparations (data not shown). Also, rabbit preimmune serum exhibited no reactivity at dilutions corresponding to 10 µg/mL or less of the anti-HCP IgG (Table 3). Because preparation #4631 had the best overall performance characteristics, we used it as both the capture and detection reagent for all subsequent ELISAs.
Table 2: HCP spike/recovery in 100 μg/mL simponi primary reference standard; efficiency of antibodies 4631, 4632, and 4842

Table 2: HCP spike/recovery in 100 μg/mL simponi primary reference standard; efficiency of antibodies 4631, 4632, and 4842 ()
Table 3: HCP spike/recovery in 100 μg/mL simponi primary reference standard: comparing anti-HCP antibody and preimmune sera

Table 3: HCP spike/recovery in 100 μg/mL simponi primary reference standard: comparing anti-HCP antibody and preimmune sera ()
We defined our quantification limit (QL) as the lowest tested concentration of HCP lysate spiked into the Simponi PRS materials at which percent recovery is 80 –120% and%CV for replicate samples is <20%. QLs were 16 and 8 ng/mL, respectively, when HCP lysate was spiked into 1 mg/mL (Table 4) and into 5 mg/mL (Table 5) of Simponi solution. The latter showed a better QL possibly because higher concentrations of IgG were present, which can stabilize HCPs within the lysate. We determined the final validated assay sensitivity to be 3.9 ng/mL or 0.78 ng HCPs per mg of product (or 0.78 ppm).
Table 4: Determination of the HCP ELISA quantification limit (QL) in a 1-mg/mL Simponi primary reference standard

Table 4: Determination of the HCP ELISA quantification limit (QL) in a 1-mg/mL Simponi primary reference standard ()
Table 5: Determination of the HCP ELISA quantification limit (QL) in a 5-mg/mL Simponi primary reference standard

Table 5: Determination of the HCP ELISA quantification limit (QL) in a 5-mg/mL Simponi primary reference standard ()
We used the ELISA to monitor and validate the manufacturing process for removing residual HCPs to support late-stage development of our product. HCP results from the validated ELISA were obtained from five different phase 3 clinical lots and two process validation lots at different manufacturing steps, and they directly demonstrated the consistent clearance of HCPs by the Simponi manufacturing process. The initial level of HCP in the harvest ranged 200 –2,700 ng per milligram of Simponi IgG, and it was substantially reduced at the direct product capture (DPC) step. HCP levels present in DPC eluates ranged from
Because the HCP level was below QL before cation exchange, we also conducted spike studies to determine the clearance capacity of two sequential purification steps after the DPC step: CE and anion-exchange (AE) chromatography. HCP spike study data (using the ELISA) demonstrated an additional clearance capacity of at least 1.34 log10 by the CE process and at least 0.90 log10 by the AE process for a cumulative clearance of at least 2.23 log10 (170-fold) for both steps combined. Given the observed maximum HCP levels of 8.3 ng HCP/mg product at DPC step and the 2.24 log10 (~170-fold) clearance observed for the chromatography, formulated bulk (FB) HCP levels are expected to be 10 based on a minimum observed level in harvest of 200 ng/mg and a maximum calculated level in FB of 0.048 ng/mg Simponi IgG. All lot-release data have confirmed the HCP levels presented in FB to be below the QL. This clearly demonstrates that our Simponi manufacturing process can robustly remove HCPs as potential impurities.
Looking Ahead
An example of further detailed characterization of the HCP levels present in the formulated bulk from manufacturing consistency lots is described in the conclusion of this article in an upcoming issue. Part 2 will also compare the specificity and sensitivity of our in-house ELISA with the commercially available generic Sp 2/0 HCP detection ELISA to determine suitability of the latter for HCP detection in or product. The principles and methods described here for generating an in-house, process-specific ELISA can also be applied to other manufacturing processes with different production cell lines.
About the Author
Author Details
Edward Savino is senior associate scientist, Bing Hu is senior research scientist, Jason Sellers associate scientist, Andrea Sobjak is senior associate scientist, and Nathan Majewski is research scientist in pharmaceutical development; Sandra Fenton is associate director of biologics research; and corresponding author Tong-Yuan Yang is associate director of biologics clinical pharmacology at Centocor Research and Development Inc., 145 King of Prussia Road, Radnor, PA 19087, 1-610-889-4566; [email protected].
REFERENCES
1.) Bloom, SR. 1979. Autoimmunity in Diabetics Induced By Hormonal Contaminants of Insulin. Lancet 1:14-17.
2.) WHO Technical Report Series No. 878 2000.WHO Expert Committee on Biological Standardization: Forty-Seventh Report, World Health Organization, Geneva:1998.
3.) Eaton, LC. 1995. Host Cell Contaminant Protein Assay Development for Recombinant Biopharmaceuticals. J. Chromatogr. A 705:105-114.
4.) Hoffman, K. 2000. Strategies for Host Cell Protein Analysis. BioPharm 13:38-45.
5.) Zhu, D, AJ Saul, and AP. Miles. 2005. A Quantitative Slot Blot Assay for Host Cell Protein Impurities in Recombinant Proteins Expressed in E. coli. J. Immunol. Meth.
306:40-50.
6.) Anicetti, VR. 1986. Immunoassay for the Detection of E. coli Proteins in Recombinant DNA Derived Human Growth Hormone. J. Immunol. Meth. 91:213-224.
7.) Chen, AB. 1992. Quantitation of E. coli Protein Impurities in Recombinant Human Interferon-Gamma. Appl. Biochem. Biotechnol. 36:137-152.
8.) Dagouassat, N. 2001. Development of a Quantitative Assay for Residua l Host Cel l Proteins in a Recombinant Subunit Vaccine Against Human Respiratory Synctial Virus. J. Immunol. Meth. 251:151-159.
9.) Wan, M. 2002. An Enzyme-Linked Immunosorbent Assay for Host Cell Protein Contaminants in Recombinant PEGylated Staphylokinase Mutant SY161. J. Pharm. Biomed. Anal. 28:953-963.
10.) ICH Q6B 1999. Specifications: Test Procedures and Acceptance Criteria for Biotechnological/Biological Products. Fed. Reg. www.ich.org/fileadmin/Public_Web_Site/ICH_Products/Guidelines/Quality/Q6B/Step4/Q6B_Guideline.pdf 18:44928.
11.) Office of Biologics Research and Review 1995.Points to Consider in the Production and Testing of New Drugs and Biologicals Produced by Recombinant DNA Technology, US Food and Drug Administration, Rockville.
You May Also Like


