Clearance of Persistent Small-Molecule Impurities: Alternative StrategiesClearance of Persistent Small-Molecule Impurities: Alternative Strategies
WWW.GRAPHICSTOCK.COM
Small-molecule impurities that bind to and copurify with protein biopharmaceuticals traditionally have been removed using bind-and-elute (BE) chromatography. However, that approach may be undesirable for a number of reasons. For instance, it may present a facility-fit challenge or provide a lower process yield than what is acceptable.
A common scenario in which BE chromatography may be undesirable is in removal of unreacted conjugation reagents. Bioconjugates represent an important and growing class of pharmaceuticals that include PEGylated proteins, vaccines, and antibody–drug conjugates (ADCs) (1–8). The latter, for example, are produced by combining a monoclonal antibody (MAb) or MAb-like molecule with a reactive payload reagent to form a conjugate (9). Following that reaction, unreacted payload molecules (“free drug”) must be removed from the process stream to very low levels because they are highly toxic. That is typically achieved using diafiltration, which exploits the size difference between MAbs (and ADCs) and free drug molecules for separation. In some instances, the free drug may interact with or bind to some antibodies (but not conjugating) and thus copurify with them.
Small-molecule affinity ligands used in early processing steps also can copurify with product. Leached affinity ligands often must be controlled to low levels due to concerns over potential toxicity. For example, dye affinity ligands have found use for commercial manufacture of recombinant albumin and have shown potential for antibody purification (10–12).
Copurifying fermentation and cell culture reagents represent yet another case in which BE chromatography may not be the downstream unit operation of choice. These substances can interfere with some column chromatography steps by reducing the capacity, selectivity, or lifetime of resins. So it may be desirable to reduce or remove them early in a process before the capture column.
Finally, detergents and surfactants are known to bind to proteins and copurify with them. Removal is further complicated by the fact that such substances tend to form micelles, which can have low ultrafiltration/ diafiltration (UF/DF) sieving coefficients under ordinary conditions.
Here we describe three different approaches to removing persistent small-molecule impurities that can bind to protein products. Using an antibody and Cibacron blue (CB) F3GA dye as a model system, we evaluate two-stage diafiltration, flowthrough chromatography, and carbon filtration systems. A mathematical model incorporating binding of the dye to the antibody simulates diafiltration behavior. Also, you can find supplementary material online: MATLAB source code that can be used to perform simulations similar to those described herein (www.bioprocessintl.com/download/matlab-cv-diafiltration-bound-impurity).
Materials and Methods
Chemicals: Propylene glycol came from Alfa Aesar. Sodium chloride and l-arginine came from JT Baker. Bis-tris and bis-tris HCl came from Sigma-Aldrich. And Cibacron blue F3GA dye came from Polysciences.
Protein Preparation and Dye Addition: A MAb expressed by Chinese hamster ovary (CHO) cells using standard techniques was purified using protein A chromatography. We concentrated the purified protein and buffer exchanged it into pH 6.0 bis-tris buffer or pH 6.0 bis-tris with 50 mM NaCl for use in subsequent small-molecule clearance studies. The “Test MAb” box summarizes the properties of this MAb.
Test MAb Properties |
|---|
pI: 9.4 (measured by capillary isoelectric focusing) Molecular Weight: 148,000 Da Extinction Coefficient: 1.470 mg/mL–1cm–1 at 280 nm |
We prepared mixtures of the MAb with CB dye by mixing stock MAb solutions at 20 g/L in bis-tris buffers at pH 6.0 with a stock solution of Cibacron blue dye (1 g/L in bis-tris buffers at pH 6.0).
Protein and Dye Concentration Measurements: We measured protein concentrations by absorbance at 280 nm using a NanoDrop 2000c UV-vis spectrophotometer from Thermo Scientific. Using the same instrument, we measured Cibacron blue dye concentrations by absorbance at 620 nm.
UF/DF Experiments: To perform single-stage diafiltration experiments, we prepared solutions in 50 mM bis-tris at pH 6.0 with three different MAb concentrations (2.5 g/L, 10 g/L, and 20 g/L) and an initial dye concentration of either 0.25 g/L or 0.5 g/L. Diafiltration was carried out against 50 mM bis-tris at pH 6.0. We used Pellicon 3 UltraCel membranes from EMD Millipore for all experiments, with a feed flow rate of 360 LMH and a target transmembrane pressure (TMP) of 20 psi. And we measured retentate CB dye concentration directly by absorbance at 620 nm.
For two-stage diafiltration experiments, we first diafiltered against a buffer containing a salt or modulator to disrupt the dye–protein interaction, then switched to a diafiltration buffer free of salt or modulator. The first stage was two to four diafiltration volumes (DV), and the second stage was performed for an additional 4–6 DV. For these experiments, the starting protein concentration was 10 g/L, and the initial CB dye concentration was 0.25–0.5 g/L.
Flow-Through Chromatography Experiments: Using Amberchrom CG161M resin from Dow Chemical packed into Tricorn columns (5-mm diameter, 20-cm height) from GE Healthcare, we carried out flow-through chromatography on an ÄKTA Explorer liquid chromatography system from GE Healthcare. After equilibrating the column with 50 mM bis-tris and 50 mM NaCl at pH 6, we applied a sample containing 10 g/L MAb and 0.5 g/L CB dye to the column for a target load challenge of ~500 g/L of column, followed by an equilibration buffer chase. We collected column flow-through in fractions and tested it for protein and small-molecule impurity concentrations. Fractions containing protein were pooled together so we could calculate overall product yield and impurity concentration.
Carbon-Filtration Experiments: For activated carbon filtration, we used Millistak+ CR filters from EMD Millipore. After equilibrating a filter with 50 mM bis-tris and 50 mM NaCl at pH 6, we applied a sample containing 10 g/L MAb and 0.5 g/L CB dye to a target load challenge of ~300 L/m2 of filter area, followed by an equilibration buffer chase. We collected filtrate in fractions and tested it for protein and dye concentrations. Fractions containing protein were pooled together so we could calculate overall product yield and impurity concentration.
Computer Simulations and Software: We used a Microsoft Excel spreadsheet to evaluate a mass balance equation for diafiltration, assuming no impurity binding. Under conditions of impurity binding, we integrated the mass-balance ordinary differential equation numerically using the Bulirsch-Stoer algorithm as implemented in Tenua open-source software. MATLAB source code for performing simulations similar to those described herein is included as supplementary material online. To generate graphs, we exported the simulation data and ÄKTA chromatograms to SigmaPlot graphing software from Systat Software.
Results and Discussion
Nomenclature |
|---|
A = membrane area (m2)Ci = concentration of the total (free + bound) impurity in the retentate (mol/L)Ci,0 = initial concentration of the total impurity in the retentate (mol/L)Ci,free = concentration of the free impurity in the retentate (mol/L)Ci,bound = concentration of the bound impurity in the retentate (mol/L)Cp = concentration of the total (free + bound) protein in the retentate (mol/L)Cp,free = concentration of the free protein in the retentate (mol/L)Jv = filtrate flux through the membrane (L/(m2 h))K = equilibrium constant (M–1) n = number of binding sitesND = number of diavolumesSi = sieving coefficient of the impurityV = volume of the retentate solution (L) |
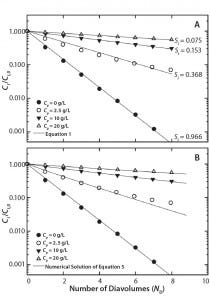
Figure 1: Single-stage diafiltration experiments for different initial protein concentrations (A) modeled assuming no protein-impurity binding with Equation 1 and (B) modeled assuming protein-impurity binding with a numerical solution of Equation 5 and parameters from Table 1
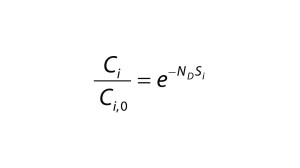
Diafiltration Experiments and Simulation: Figure 1A graphs results from single-stage diafiltration experiments performed with different protein concentrations. As protein concentration increases, the rate of dye clearance decreases. To quantify that difference, we fit the impurity profiles to Equation 1, which can be obtained from a mass balance assuming no dye binding and constant retentate volume.
Solid lines in Figure 1A show the solution of Equation 1 obtained with the corresponding impurity sieving coefficient Si. The value obtained for the case of Cp = 0 mg/mL is very close to unity and therefore represents an intrinsic sieving coefficient for an unretained small molecule. The apparent sieving coefficients obtained with protein present are much lower and serve to illustrate the impact of protein-binding on the rate of dye clearance.
Equation 1
Equation 2
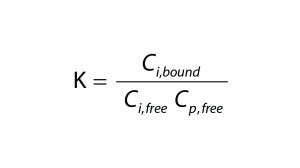
To quantify the impact of protein-binding on dye clearance, we followed an approach similar to that described by Shao and Zydney (13). For reversible binding, the equilibrium constant, K, is defined according to Equation 2, in which Cp,free is the free protein concentration and Ci,free and Ci,bound represent free and bound concentrations of the impurity, respectively. Concentrations of free impurity, total impurity, and total protein come from Equation 3, in which n represents the number of impurity binding sites on a protein, Ci is the total impurity concentration, and Cp is the total protein concentration.
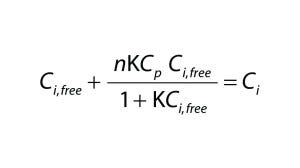
Equation 3
Assuming that a protein is completely retained by the filter membrane, the mass balance of an impurity is described by the differential equation (Equation 4), in which V is the retentate volume, Jv is the filtrate flux through the membrane, and A is the membrane area. Equation 3 can be solved for Ci,free using the quadratic equation.
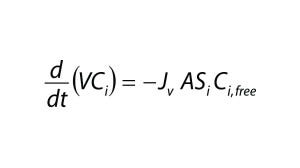
Equation 4
Substituting that into Equation 4 and assuming constant volume diafiltration, we obtain Equation 5. We integrated this form of the mass-balance equation numerically with parameters shown in Table 1 to obtain the results in Figure 1B. We identified a single set of n and K values, fit by trial and error, which captured Ci/Ci,0 as a function of ND under all conditions tested.

Equation 5
However, the model deviated slightly from our experimental results for the case of Cp = 2.5 g/L at high ND. Although the number of binding sites appears to be high (n = 35), it is also roughly consistent with results obtained by Rao and Zydney (14). In a detailed study, they fit binding of CB dye to bovine serum albumin (BSA) with n = 11 under favorable binding conditions. Given the increase in size and accessible surface area of an antibody compared with BSA, the number of binding sites suggested by our study is not implausible.

Table 1: Parameters used with numerical solution of Equation 5 to obtain results shown in Figure 1b
Shao and Zydney showed that the optimal product concentration for performing diafiltration is reduced in the presence of strong binding impurities (13). Our results confirm that observation, with the apparent impurity sieving coefficient shown in Figure 1A increasing by a factor of five when protein concentration is decreased from 20 g/L to 2.5 g/L.
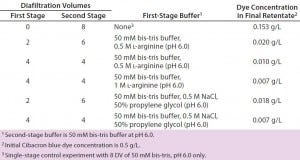
Table 2: Results of two-stage diafiltration experiments
In some instances, however, a more aggressive approach may be required by the nature of the impurity or facility-fit constraints that limit the size of a diafiltration tank or amount of buffer consumption. To enable impurity clearance at higher protein concentration, we tested a two-stage diafiltration procedure in which the first stage consists of a buffer containing a salt or modulator to disrupt impurity–protein interactions, and a second stage serves to remove that salt or modulator. We chose the salt and modulators used in this study because they are inexpensive, have low toxicity, come in compendial grades, and should be easily removed by diafiltration. However, many other available salts or modulators could be suitable for similar purposes. For example, higher molecular-weight glycols, alcohols, urea, and solvents are likely to work as well.
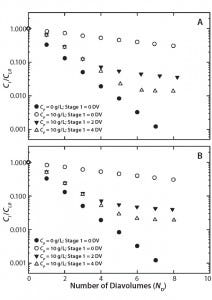
Figure 2: Two-stage diafiltration experiments at 10 g/L protein concentration using (A) first-stage buffer containing 50 mM bis-tris at pH 6.0 with 50% propylene glycol and 0.5 M NaCl and (B) first-stage buffer containing 50 mM bis-tris at pH 6.0 with 0.5 M l-arginine
Figure 2A graphs results from our two-stage diafiltration experiments using propylene glycol and salt as a modulator, and Figure 2B shows results from experiments using l-arginine. In both cases, the twostage procedure dramatically reduced final impurity concentrations compared with a single-stage control experiment. Table 2 summarizes the results of all our two-stage diafiltration experiments. Under the single-stage control conditions, little more than a threefold reduction in impurity concentration was realized after 8 DV. For the two-stage experiments, impurity clearance ranged from a 25- to 71-fold reduction after 8 DV.
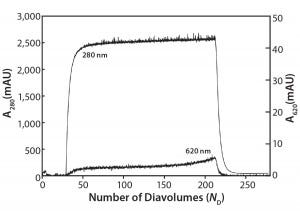
Figure 3: Ambercrom CG161M flow-through chromatography of a MAb at 10 g/L containing 0.5 g/L Cibacron blue dye
Flow-Through Chromatography: Figure 3 shows the results of our Amberchrom CG161 flow-through experiments. Note that protein breaks through sharply (A280 nm curve), whereas the dye breakthrough is more gradual (A620 nm curve), never reaching >1.5% of the load value. The product yield from this experiment is 83%, with a 55-fold reduction in impurity concentration measured for the elution pool compared with the load material.
This technique relies in large part on exclusion of protein from the resin’s internal pore structure, which allows it to be recovered in the unretained flow-through fraction. Dow Chemical reports the pore size of this resin to be 150 Å, and in our laboratory we have used it with good success to efficiently remove PS-80 from antibody preparations (data not shown).
Activated Carbon Filtration: Filter cartridges containing immobilized activated carbon that can be used for biopharmaceutical protein purification are a relatively recent innovation available from several major manufacturers. Although the technology has been used in protein purification for decades (e.g., to remove lipids from albumin preparations), it has suffered from a number of drawbacks. Chief among those was the difficulty of handling loose, dry, activated carbon. Companies have gone to substantial costs preventing contamination of other parts of their facilities with carbon fines as well as to protect their employees. But such problems are now largely a thing of the past.
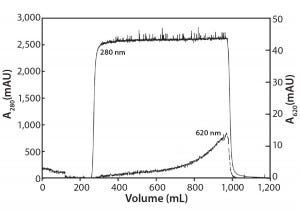
Figure 4: Activated carbon filtration of a MAb at 10 g/L containing 0.5 g/L Cibacron blue dye
Figure 4 shows removal of CB dye using an activated carbon filter. Note that protein again breaks through sharply (A280 nm curve), whereas the CB dye breakthrough is gradual (A620 nm curve) and never reaches >1% of the load value. In this experiment, product yield was 93%, with a 100-fold reduction in impurity concentration. Based on the speed and convenience generally afforded by these filters, activated-carbon filtration appears to be a very attractive option and most likely represents the quickest route to dealing with strong-binding small-molecule impurities.
Consider Activated Carbon First
Here we present three alternative approaches to removing persistent small-molecule impurities without using BE chromatography. For a MAb–CB model system, we evaluated two-stage diafiltration, flow-through chromatography, and activated carbon filtration. To quantify the nature of dye binding to the MAb, we fit diafiltration data to a mathematical model based on the number of binding sites and an equilibrium constant. All techniques studied showed good ability to remove the test impurity. Based on minimal process-development requirements and high throughput typically associated with filtration unit operations, we recommend testing activated-carbon filtration first when confronted with a similar challenge.
The strategies presented herein are targeted to impurities of a hydrophobic nature. The two-stage diafiltration procedure also could remove impurities bound to proteins on the basis of charge by using a high-salt concentration in the first-stage buffer to disrupt their electrostatic interactions. In a study of citrate binding to a Fab, Harinarayan and coworkers addressed clearance of a charged, hydrophilic small molecule by UF/DF in 2009 (15).
Acknowledgments
We thank Bill Wang and Kripa Ram for their review of this manuscript and we thank Professor Giorgio Carta for feedback and advice.
References
1 Trail P, Bianchi A. Monoclonal Antibody Drug Conjugates in the Treatment of Cancer. Curr. Opin. Immunol. 11(5) 1999: 584–588; doi:10.1016/S0952-7915(99)00012-6.
2 Chapman AP. PEGylated Antibodies and Antibody Fragments for Improved Therapy: A Review. Adv. Drug Delivery Rev. 54(4) 2002: 531–545; doi:10.1016/S0169409X(02)00026-1.
3 Harris J, Martin N, Modi M. PEGylation: A Novel Process for Modifying Pharmacokinetics. Clin. Pharmacokinet. 40(7) 2001: 539–551.
4 Gruber W, Scott D, Emini E. Development and Clinical Evaluation of Prevnar 13, a 13-Valent Pneumococcal CRM197 Conjugate Vaccine. Ann. N.Y. Acad. Sci. 1263(8) 2012: 15–26; doi:10.1111/j.1749-6632.2012.06673.x.
5 Poolman J, et al. Impact of the Conjugation Method on the Immunogenicity of Streptococcus pneumoniae Serotype 19F Polysaccharide in Conjugate Vaccines. Clin. Vaccine Immunol. 18(2) 2011: 327–336; doi:10.1128/CVI.00402-10.
6 Junttila T, et al. Trastuzamab-DM1 (T-DM1) Retains All the Mechanisms of Action of Trastuzumab and Efficiently Inhibits Growth of Lapatinib Insensitive Breast Cancer. Breast Cancer Res. Treat. 128(2) 2011: 347–356; doi:10.1007/s10549-010-1090-x.
7 Ryan M, et al. Targeting Pancreatic and Ovarian Carcinomas Using the AuristatinBased Anti-CD70 Antibody-Drug Conjugate SGN-75. Brit. J. Cancer. 103, 2010: 676–684; doi:10.1038/sj.bjc.6605816.
8 Jennings G, Bachmann M. Immunodrugs: Therapeutic VLP-Based Vaccines for Chronic Diseases. Annu. Rev. Pharmacol. Toxicol. 49, 2009: 303–326; doi:10.1146/annurev-pharmtox-061008-103129.
9 Ducry L, Stump B. Antibody-Drug Conjugates Linking Cytotoxic Payloads to Monoclonal Antibodies. Bioconj. Chem. 21(1) 2010: 5–13; doi:10.1021/bc9002019.
10 Santambien P, et al. Immunoenzymatic Assay of Dyes Currently Used in Affinity Chromatography for Protein Purification. J. Chromatogr. A 597(1–2) 1992: 315–322; doi:10.1016/0021-9673(92)80126-F.
11 Curling J. Affinity Chromatography: From Textile Dyes to Synthetic Ligands By Design, Part II. BioPharm Int. 17(8) 2004: 60–65.
12 Riske F, et al. A Potential Generic Downstream Process Using Cibracon Blue Resin at Very High Loading Capacity Produces a Highly Purified Monoclonal Antibody Preparation from Cell Culture Harvest. J. Chromatogr. B 848(1) 2007: 108–115; doi:10.1016/j.jchromb.2006.06.034.
13 Shao J, Zydney A. Optimization of Ultrafiltration/Diafiltration Processes for Partially Bound Impurities. Biotechnol. Bioeng. 87(3) 2004: 286–292; doi:10.1002/bit.20113.
14 Rao S, Zydney A. High-Resolution Protein Separations Using Affinity Ultrafiltration with Small Charged Ligands. J. Mem. Sci. 280(1–2) 2006: 781–789; doi:10.1016/j.memsci.2006.02.035.
15 Harinarayan C, et al. Small-Molecule Clearance in Ultrafiltration/Diafiltration in Relation to Protein Interactions: Study of Citrate Binding to a Fab. Biotechnol. Bioeng. 102(6) 2009: 1718–1722; doi:10.1002/bit.22196.
Corresponding author Alan K. Hunter is a fellow, Andrew Fulton is an associate scientist, Timothy M. Pabst and James Savery are senior scientists, all in purification process sciences at MedImmune, One MedImmune Way, Gaithersburg, MD 20878, USA; 1-301-398-4142; [email protected].
You May Also Like


