Evaluation of a Variable-Pathlength Spectrophotometer: A Comparable Instrument for Determining Protein ConcentrationEvaluation of a Variable-Pathlength Spectrophotometer: A Comparable Instrument for Determining Protein Concentration

WWW.PHOTOS.COM
Protein concentrations in bioprocessing are determined by multiplying the measured absorbance of UV light as it passes through a sample by the protein extinction coefficient. Conventional spectrophotometer measurements are based on a fixed pathlength depending on the cuvette used to hold the sample (typically 10 mm). Only a small portion of the UV curve is linear at that pathlength. As a result, conventional spectrophotometers have a limited linear range and are unable to measure a large range of protein concentrations reliably without dilution of a sample to within linear range.
We used a SoloVPE variable pathlength spectrophotometer (from C Technologies, Inc.) in this study. Such instruments automatically adjust the optical pathlength from 0 mm to 15 mm in 5‑µm increments. They can determine the appropriate pathlength and linearity at significantly higher sample concentrations than those determined by fixed‑pathlength spectrophotometers. Pathlength scanning technology makes that capability possible. Using the slope from absorbance and pathlength relationships, the instrument can rapidly and precisely determine concentrations with samples that otherwise would be significantly outside the linear range of a fixed‑pathlength instrument.
We performed this study to assess comparability of results from a variable‑pathlength spectrophotometer to those of fixed‑pathlength spectrophotometers. We used a two‑part approach to assess comparability. With a targeted study using a concentrated protein pool, we directly compared both types of spectrophotometers across a range of concentrations. Then we compiled measurements generated by both types of spectrophotometers across different sites and molecules and evaluated those results to show comparability.
Materials and Methods Three different laboratories generated data from two fixed‑pathlength spectrophotometers and a variable‑pathlength spectrophotometer for our analyses.
Targeted Study: For the targeted study, we diluted a high‑concentration monoclonal antibody (MAb) solution to create eight stock solutions ranging in concentration from ~2 g/L to ~210 g/L (Table 1). We measured protein concentrations with one of the fixed‑pathlength spectrophotometers and the variable‑pathlength spectrophotometer.
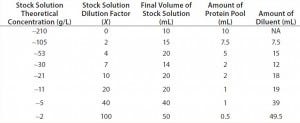
Table 1: Stock solutions tested
Three analysts each measured triplicate concentrations for each stock solution using both types of spectrophotometer. For concentration determination on the fixed‑pathlength spectrophotometer, analysts diluted the stock solutions to an absorbance that was within the linear range of the instrument. Each analyst sampled directly from the stock solutions and performed necessary dilutions, blanking the spectrophotometer with an appropriate buffer before taking measurements, and drawing samples directly from the stock solution. The analysts did not perform background corrections for measurements using the variable‑pathlength spectrophotometer. They calculated concentrations using the known extinction coefficient of the protein.
Historical Study: In this study, analysts measured in‑process protein samples ranging in concentration from ~2 g/L to ~176 g/L — encompassing a variety of products (MAbs and recombinant fusion proteins) — using both fixed‑ and variable‑pathlength spectrophotometers. Scientists from several laboratories provided data from a number of experiments in which both types of spectrophotometer were used to measure the concentration of the same sample.
Results and Discussion
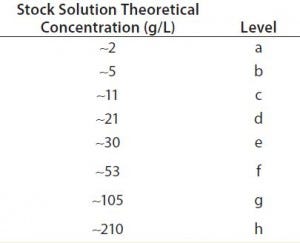
Table 2: Concentration levels measured for the target study
Targeted Study: Three analysts (denoted as X, Y, and Z) measured in triplicate eight different concentration solutions (or levels). This yielded nine data points for each spectrophotometer at each concentration (or level). Table 2 lists the different concentration levels measured.
Measured concentrations for the fixed‑ and variable‑pathlength spectrophotometers were modeled as a function of analyst (random effect), level, and spectrophotometer. Figure 1 shows the plot of residuals from this model as a function of level and spectrophotometer.
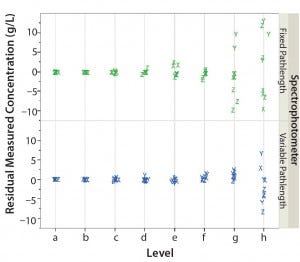
Figure 1: Residual measured concentration (g/L) of fixed‑pathlength and variable‑pathlength spectrophotometers as a function of analyst (X, Y, and Z) and level (a–h)
As the level (sample concentration) increases, the spread in residuals increases. This phenomenon was observed for both types of spectrophotometers, with slightly greater variation for the fixed‑ pathlength spectrophotometer in levels g and h. As a result of similar trends with both spectrophotometers for those levels, it is evident that this behavior is intrinsic to protein concentration measurements and independent of the type of spectrophotometer technology used. Therefore, to further evaluate our data set, we developed a normalization scheme.
To normalize the data set, we used the variable‑pathlength mean concentration at each level as the base for both spectrophotometer data sets. Ideally, each measurement result would be divided by the true concentration. But in this experiment, that concentration is unknown (because a protein pool was used rather than a known standard). Using the same value for both spectrophotometers (variable‑ pathlength level mean) allows for an estimate of the bias (difference in means). Normalization of each measurement result centers all data points on 100%. The following equation shows the calculation used to normalize the data (the fixed and variable pathlengths are for spectrophotometer measurements at a given level):
[(Fixed pathlength) ÷ (Variable‑ pathlength mean)] × 100 %
We modeled the normalized measured concentration for the variable‑ and fixed‑pathlength spectrophotometers as a function of analyst (random effect), level, and spectrophotometer. Figure 2 shows the resulting residual distribution.
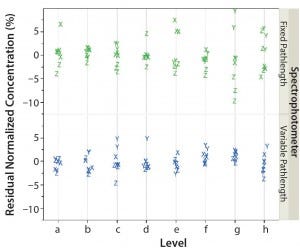
Figure 2: Residual, normalized, measured concentration (%) of fixed‑pathlength and variable‑pathlength spectrophotometers as a function of analyst (X, Y, and Z) and level (a–h)
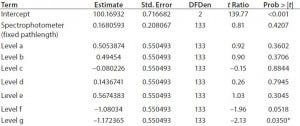
Table 3: Normalized parameter estimates as a function of spectrophotometer and level
We evaluated the normalized parameter estimates from the model to determine whether there was a statistically significant impact on the mean measured concentration as a result of concentration (or level) (Table 3). With the exception of level g, all levels resulted in p‑values >0.05. This indicates that concentration does not have a statistically significant impact on the measurement results for either spectrophotometer type. In addition, for the fixed‑effect test, the p‑value for level is >0.05 (resulting p‑value = 0.1533). That also indicates that concentration does not have a statistically significant effect on measurement results (Table 4).

Table 4: Normalized fixed effect tests for spectrophotometer and level
Finally, for the fixed‑effect test, the p‑value for the spectrophotometers is >0.05 (resulting p value = 0.4207). This indicates that the bias (or difference in means) between the fixed‑ and the variable‑pathlength spectrophotometers is not statistically significant.
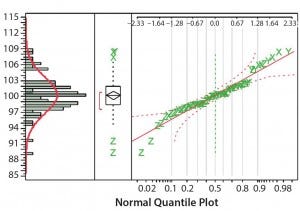
Figure 3: Distribution of the normalized concentration using the fixed pathlength spectrophotometer
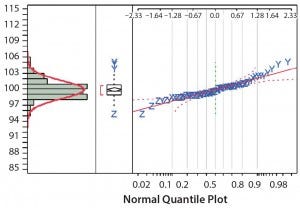
Figure 4: Distribution of the normalized concentration using the variable pathlength spectrophotometer
Figures 3 and 4 plot normalized concentration results for the fixed‑ pathlength and variable‑pathlength spectrophotometers, respectively. The normalized measurement results follow a normal distribution. We used the normalized concentration results to calculate the standard deviation for each spectrophotometer (Table 5).

Table 5: Spectrophotometer precision comparison (SD = standard deviation, CI = confidence interval)
Our analysis shows that the standard deviation of the fixed‑pathlength spectrophotometer is nearly double that of the variable‑pathlength spectrophotometer (3.45% and 1.68%, respectively). The 95% confidence interval on the ratio of the fixed‑pathlength and variable‑pathlength spectrophotometer standard deviations is >1.0 (1.628– 2.602), which indicates that the standard deviation is greater for the fixed‑pathlength spectrophotometer. A resulting p‑value of <0.001 demonstrates that the standard deviation of the fixed‑pathlength spectrophotometer is statistically significant compared with that of the variable‑pathlength spectrophotometer. Based on our evaluation, the variable‑pathlength instrument is more precise than the fixed‑pathlength spectrophotometer.
Historical Study: We used the data set generated during our targeted study to calculate a 95% confidence and 99% coverage tolerance interval (TI) to be used as a basis for comparing data generated across sites, molecules, and product pools. From the normalized fixed‑pathlength spectrophotometer measured concentrations, a 95% confidence/99% coverage TI resulted in a lower tolerance boundary of 89.9% and an upper tolerance boundary of 110.7%.
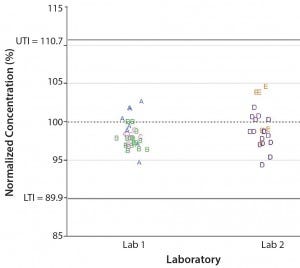
Figure 5: Comparing normalized concentration across laboratories and molecules; UTI, LTI = upper and lower tolerance interval, respectively
To compare our conclusions from the targeted study, we normalized data collected from other sites and molecules by using the same approach that was used for the targeted study. We compared the TI calculated from the targeted study with the normalized data set collected across various laboratories and molecules (Figure 5). Figure 5 shows that all normalized concentration data collected at other laboratories and for various molecules fall within the calculated TI. That indicates that no practically significant difference exists between sites and molecules when we use the variable‑pathlength spectrophotometer to measure protein concentration.
Comparisons
Data evaluated here conclude that a variable‑pathlength spectrophotometer is comparable with a fixed‑pathlength spectrophotometer. Our statistical analyses demonstrate that the bias between the variable‑pathlength spectrophotometer and a fixed‑pathlength spectrophotometer is not statistically significant. Our analyses also confirm that the variable‑pathlength instrument is more precise than a fixed‑pathlength instrument. In addition, we found no practically significant laboratory or molecule differences between both types of spectrophotometer.
Our analyses support the introduction of a variable‑pathlength spectrophotometer as a like‑for‑like replacement for the fixed‑pathlength spectrophotometers that were tested in this study.
Further Reading
Huffman S, Soni K, Ferraiolo J. UV–Vis Based Determination of Protein Concentration: Validating and Implementing Slope Measurements Using Variable Pathlength Technology. BioProcess Int. 12(8) 2014: 66–73.
Briana Lehr is an engineer ([email protected]), John Robinson is an engineer ([email protected]), and Rick Burdick, PhD, is director ([email protected]); and corresponding author Arun Tholudur, PhD, is director ([email protected]) at Amgen, Inc., 4000 Nelson Road, Longmont, CO 80503.
You May Also Like


