Analysis By Size and ChargeAnalysis By Size and Charge
January 1, 2014
An early BPI Lab article addressed the power of liquid chromatographic separations for biopharmaceutical laboratory use (1). Such techniques separate biomolecules based on a number of different properties: size, solubility, hydrophobicity/-philicity, binding affinity. The next most powerful means of separation — and thus high-resolution identification — of nucleic acids and proteins/peptides is based primarily on electrostatic properties: electrophoresis. Although it doesn’t really work in a process or preparative setting, it is a fundamental technique in modern biopharmaceutical laboratories, where it has become a relatively inexpensive, uncomplicated, and fast analytical method. Electrophoresis is often used for monitoring the progress of other protocols.
Techniques such as isoelectric focusing (IEF) offer high-resolution separation of proteins based on their charge differences. Size separation is primary in sodium dodecyl sulfate-polyacrylamide gel electrophoresis (SDS-PAGE). Combining the two for “two-dimensional” gel electrophoresis provides the highest resolution with up to several thousand spots per gel. Scientists can stain proteins to obtain high-resolution patterns for scanning and storage in comprehensive databases (2). As for nucleic acids, nucleotides, and genes, electrophoresis served as the primary technique for mapping the human genome. Recent developments involving capillary technology have attracted interest for even higher-resolution analysis.
A Brief History
Early references to the basic principle of electrophoresis (the movement of charged molecules toward the positive or negative pole of an electric field)appeared in the early 19th century (3). Such work explored the laws of electrolysis proposed by Michael Faraday in the late 18th century as part of early studies in electrochemistry. By the early 20th century, electrochemists had learned how to create moving boundaries of charged particles in U-shaped glass tubes.
Swedish biochemist Arne Tiselius is credited with inventing an apparatus for analytical “moving-boundary” electrophoresis in the 1930s, for which he won the 1948 Nobel prize in chemistry. Based on August Toepler’s 19th-century work in Germany on optical detection of moving boundaries in liquids, Tiselius’s own method did not see widespread use. But his concept was adapted for “zone electrophoresis” methods (using supporting media such as filter paper or gels) in the 1940s and 1950s. British-born American geneticist Oliver Smithies introduced starch gel as an electrophoretic substrate in 1955 (4). By the 1960s, sophisticated polyacrylamide gel methods were making it possible to separate biomolecules electrophoretically based on minute physical and chemical differences. Such analyses brought about the very science of molecular biology. The other medium of choice for modern laboratories is agarose, a gel formed from the polysaccharide agar, which is sourced from seaweed.
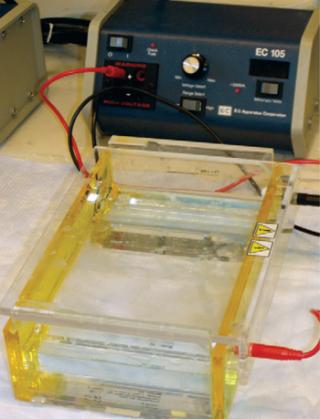
Photo 1:

Photo 1: ()
Like analytical chromatography, electrophoresis has diversified over the years into a family of technologies that includes affinity electrophoresis, capillary electrophoresis, electroblotting, electrophoretic mobility shift assays, isotachophoresis, and pulsed-field gel electrophoresis. Most familiar to biopharmaceutical laboratories are SDS-PAGE and 2-D electrophoresis, certain blotting methods, isoelectric focusing (IEF), and capillary electrophoresis (CE).
Many vendors supply instruments, reagents, molecular-weight markers, and gels for both GMP and “laboratory-use only” work. Among them are Agilent Technology, Avacta Analytical, Bio-Rad Laboratories, EMD Millipore, GE Life Sciences, Horiba, Life Technologies, Lumex Analytics, Perkin Elmer (PE Applied Biosystems), Pierce Chemical, Promega, ProteinSimple, Qiagen, Rockland Immunochemicals, Sigma- Aldrich, and Thermo Scientific. In addition, a number of contract testing laboratories will do the work for you, including Archaezyme, Avacta Analytical, Blue Stream Laboratories, and Kendrick Laboratories. Some service providers are based out of academic/research institutions such as the Center for Functional Genomics in Rensselaer, NY; Macquarie University in New South Wales, Australia; the Mayo Clinic in Rochester, MN; McGill University in Montreal, Quebec; Texas A&M University in College Station, TX; and the University of Massachusetts Medical School in Shrewsbury, MA.
How It Works
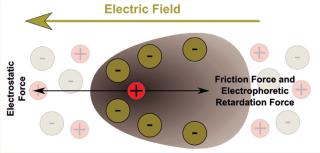
Figure 1 illustrates what happens to charged molecules in an electrified matrix. In simple terms: If the net charge of a molecule is positive, then it will migrate through a gel toward the negative pole; if the net charge is negative, then it will migrate toward the positive pole; and the relative strength of the charges determines how fast and far the molecules go. Because molecular size plays a role, gel electrophoresis and size-exclusion (or “gel filtration”) chromatography are kindred technologies of a sort. Biomolecules being made up of many atoms — some presenting outwardly on the surface and others folding inward — they can be differentiated by minute differences in their apparent charge. And interestingly, such structural differences give each protein or peptide its own isoelectric point (pI), which is the precise pH (acid or alkaline) value at which a given molecule carries no net electric charge — making it effectively “neutral” and stationary in an electric field. That particular property allows for surprisingly precise identification by means of IEF.

Figure 1: ()
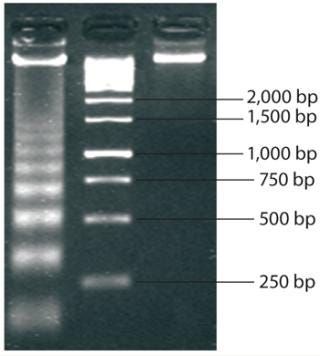
Molecular-weight markers (also called ladders because of their appearance when run on an electrophoretic gel) are standard sets of proteins or nucleic acids used for size comparison. An analyst can approximate the size of a given sample molecule by where it falls in relation to the ladder on an electrophoresis gel. The DNA ladder in Figure 2 illustrates the principle that molecular weight is inversely proportional to migration rate through the matrix.

Figure 2: ()
Isoelectric Focusing: Also known as electrofocusing, this gel electrophoresis technique sorts proteins according to their pI values. IEF involves adding a solution that, like the proteins, contains both positively and negatively charged ions in an immobilized pH-gradient gel. Proteins will migrate through the gel until they reach a region with a pH value equal to their pI point. The sharply defined bands that result give this technique its “focusing” terminology; proteins that differ only by a single ion will be fractionated into clearly separate bands on the gel.
SDS PAGE and Two-Dimensional Gel Electrophoresis: Sodium dodecyl sulfate (SDS) is an anionic organic surfactant compound — CH3 (CH2)11 OSO3 Na — derived from coconut and/or palm oil that is found in many hygiene and cleaning products. It also has the handy laboratory use of denaturing proteins from their normal curled-up structure to simple chains of amino acids. Because it also imparts a negative charge to those molecules in the process, it has found utility in polyacrylamide gel electrophoresis (PAGE). SDS-PAGE forms the basis of 2-D gel processes as well as blotting techniques, which will be the focus of our next installment of BPI Lab (February 2014).
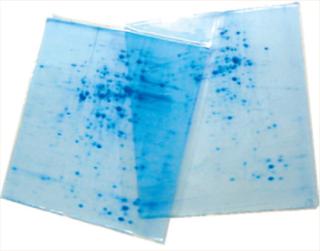
2-D techniques combine SDS-PAGE with isoelectric focusing for high-resolution protein analysis. As Photo 2 shows, the results appear as spots on an x–y axis rather than simple linear bands. And as always, adding that extra “dimension” allows for greater precision in analytical results and provides more information about a given analyte.
Photo 2:

Photo 2: ()
Capillary Electrophoresis: Also unnecessarily termed capillary zone electrophoresis (CZE) — even though no one says “gel zone electrophoresis,” because the “zone” aspect is understood — CE separates ionic molecules according to the ratio of their size to electric charge. Small tubes (capillaries) are filled with an electrolyte solution in a very different apparatus from those used in traditional electrophoresis. This technology has been around since the 1960s, but it is still being refined by companies such as ProteinSimple, whose iCE3 system adds the ability of isoelectric focusing to a CE instrument. UV light detection provides quantitation data, and the system can be automated as well.
Getting Together
Electropherograms are often used to back up, validate, and confirm the results of other analytical methods and manufacturing process steps. The “Archives” box includes several examples of such applications, and you’ll find two more in this issue: Marconi et al. used SDS-PAGE, and Steele and Arias used CE. Consequent to the ubiquity of this analytical technique, many technical conference presentations will include electrophoresis results.
If you’re looking for a focused event, however, the first place to go is the website of the AES electrophoresis society (www.aesociety.org). Its next annual meeting will be held the week of 16–21 November 2014 in Atlanta, GA. You can email the organizers — Rodrigo Martinez-Duarte at Clemson University ([email protected]) and Cullen Buie at the Massachusetts Institute of Technology ([email protected]) — with any questions or to get involved with their program.
The 19th annual LACE meeting (“Latin-American Symposium on Biotechnology, Biomedical, Biopharmaceutical, and Industrial Applications of Capillary Electrophoresis and Microchip Technology”) was held in Lima, Peru, this past 29 November–3 December. Although no information on the 2014 installment of this series is yet available online as of this writing, keep checking the www.latince.com website for that to appear.
Electrophoresis in the BPI Archives at www.bioprocessintl.com
Schleef M, et al. Long-Term Stability Study and Topology Analysis of Plasmid DNA By Capillary Gel Electrophoresis. BioProcess Int. 4(8) 2006: 38–40.
Mørtz E, et al. Proteomics Technology Applied to Upstream and Downstream Process Development of a Protein Vaccine. BioProcess Int. 6(1) 2008: 36–43.
Krishnamurthy R, et al. Emerging Analytical Technologies for Biotherapeutics Development. BioProcess Int. 6(5) 2008: 32–42.
Kunert R, Gach J, Katinger H. Expression of a Fab Fragment in CHO and Pichia pastoris. BioProcess Int. 6(6) 2008: S34–S40.
Manzi AE. Carbohydrates and Their Analysis, Part Three. BioProcess Int. 6(6) 2008: 54–65.
Apostol I, Kelner D. Managing the Analytical Life-Cycle for Biotechnology Products. BioProcess Int. 6(9) 2008: 12–19.
Schmidt J, et al. Monitoring ATP Status in the Metabolism of Production Cell Lines. BioProcess Int. 6(11) 2008: 46–54.
Blevins JS, et al. A Readily Available Source of BSA Consistently Supports Borrelia burgdorferi Cultivation and Differential Gene Expression. BioProcess Int. 7(1) 2009: 26–34.
Lees A, et al. Purifying a Recalcitrant Therapeutic Recombinant Protein with a Mixed-Mode Chromatography Sorbent. BioProcess Int. 7(2) 2009: 42–48.
Lain B, Cacciuttolo MA, Zarbis-Papastoitsis G. Development of a High-Capacity MAb Capture Step Based on Cation-Exchange Chromatography. BioProcess Int. 7(5) 2009: 26–34.
Wang X, et al. Improved HCP Quantitation By Minimizing Antibody Cross-Reactivity to Target Proteins. BioProcess Int. 8(1) 2010: 18–24.
Fike R. Nutrient Supplementation Strategies for Biopharmaceutical Production, Part 3. BioProcess Int. 8(1) 2010: 24–31.
Bengio S, et al. Improving IEX Throughput and Performance with Differentiated Chromatography Sorbents. BioProcess Int. 8(5) 2010: 64–74.
Schwertner D, Kirchner M. Are Generic HCP Assays Outdated? BioProcess Int. 8(5) 2010: 56–62.
Hitchcock AG, et al. Scale-Up of a Plasmid DNA Purification Process. BioProcess Int. 8(11) 2010: 46–54
Siemiatkoski J, et al. Glycosylation of Therapeutic Proteins. BioProcess Int. 9(6) 2011: 48–53.
Squires CH. Pseudomonas fluorescens Expression Technology for Subunit Vaccine Production and Development. BioProcess Int. 9(8) 2011: S36–S39.
Michels DA, Salas-Solano O, Felten C. Imaged Capillary Isoelectric Focusing for Charge-Variant Analysis of Biopharmaceuticals. BioProcess Int. 9(10) 2011: 48–54.
Valasek C, et al. Production and Purification of a PER.C6-Expressed IgM Antibody Therapeutic
. BioProcess Int. 9(11) 2011: 28–37.
Ausubel LJ, et al. Production of CGMP-Grade Lentiviral Vectors. BioProcess Int. 10(2) 2012: 32–43.
Murray EW, et al. A Host Cell Protein Assay for Biologics Expressed in Plants. BioProcess Int. 10(9) 2012: 44–51.
Agrawal V, et al. A High-Yielding, CHO-K1–Based Transient Transfection System. BioProcess Int. 11(1) 2013: 28–35.
Cossins A, Hooker A. Preformulation Development of a Recombinant Targeted Secretion Inhibitor. BioProcess Int. 11(2) 2013: 52–57.
Potty ASR, Xenopoulos A. Stress-Induced Antibody Aggregates. BioProcess Int. 11(3) 2013: 44–52.
Detmers F, Mueller F, Rohde J. Increasing Purity and Yield in Biosimilar Production. BioProcess Int. 11(6) 2013: 36–41.
Schlegel M, Bobinnec Y. Comparability Protocols for Biotechnological Products. BioProcess Int. 11(6) 2013: 30–41.
Berkelman T, et al. Enhanced 2-D Electrophoresis and Western Blotting Workflow for Reliable Evaluations of Anti-HCP Antibodies. BioProcess Int. 11(8) 2013: 50–61.
In Europe, the 20th “International Symposium on Electro- and Liquid-Phase Separation Techniques” was held on 6–9 October 2013 in the Spanish Canary Islands. Again, no 2014 information is yet available, but this well-established conference series will surely be back again for a 21st installment in the fall. Past meetings have occasionally been held in the United States.
Flip through any given issue of BioProcess International, and you’re very likely to find at least one gel image — no matter what the theme of that issue is. Electrophoresis is inextricably tied to the study of molecular biology — and to any technology that purports to put that science to practical use.
About the Author
Author Details
Cheryl Scott is cofounder and senior technical editor of BioProcess International, 1574 Coburg Road #242, Eugene, OR 97401; 1-646-957-8879; [email protected].
REFERENCES
1.) Scott, C 2013. A Powerful Pairing. BioProcess Int. 11:28-33.
2.) Vesterberg, O 1993. A Short History of Electrophoresis Methods. Electrophoresis 14:1243-1249.
3.) Perrett, D 2010. 200 Years of Electrophoresis. Chromatog. Today December:4-7.
4.) Smithies, O 2012. How It All Began: A Personal History of Gel Electrophoresis. Meth. Mol. Biol. 869:1-21.
5.) Handbook 18-1140-62. 2-D.
You May Also Like


