Multivariate Analysis of Biological Additives for Growth Media and FeedsMultivariate Analysis of Biological Additives for Growth Media and Feeds
March 11, 2016
Biological additives such as yeast extracts and peptones are commonly used in growth-media formulations for biopharmaceutical manufacturing. In spite of drivers encouraging companies to reduce variability in mammalian cell culture processes by using chemically defined media, many microbial and mammalian processes continue to use biological additives in their growth-medium formulations and/or feeds. According to Sheffield Bioscience (Kerry, Inc.), at least six of the top 10 licensed mammalian-cell– derived biotherapeutic products are manufactured using biological additives (1).
During process development, it can be difficult to identify which of the biological additives will be appropriate for a particular application because of their complex composition and the number of biological additives available. Multivariate analysis (MVA) techniques are increasingly used to help companies understand the complexity of their biopharmaceutical products and associated manufacturing processes (2). Techniques include statistically based process modeling, sensor calibration, and process comparability (2).
MVA is essentially a regression technique that attempts to account for the variability in real-world variables by capturing variability in new orthogonal variables called principal components (PCs) (3). Correlation between the real-world variables allows for a smaller number of principal components to capture modelable and predictable information from the original, much larger data set.
Here, principal-components analysis (PCA) is used to capture and model the variance in compositional data derived from sixty-five animal-component–free (ACF) biological additives. The resulting model is used to investigate lot-to-lot variability for two biological additives and evaluate products new to the market. A quantitative structure–activity relationship (QSAR) approach is presented here to link composition with culture performance and product titer.
I propose the QSAR-based approach using a factorial design created in principal component space as a way to evaluate the link between additive composition and cell culture performance. A training set consisting of the biological additive-derived PCA scores and simulated performance data from cell culture grown on QSAR selected additives is used to create a partial least squares (PLS) model. The PLS model then can be used to predict the performance of biological additives that were not part of the training set.
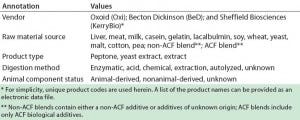
Table 1: Summary of annotations and values used to support data analysis
Materials and Methods
Data Sources and Data Compilation: Data on the chemical composition of 145 biological additives were obtained from publicly available sources published by Oxoid (4), Becton-Dickinson (5), and Sheffield Bioscience (6, 7). Those data represent the typical composition for each biological additive and can be considered as averages derived from a number of manufacturing lots, subsamples, or analyses. The chemical composition of each biological additive was compiled in a spreadsheet and annotated to aid subsequent analysis. The annotations indicate vendor, raw material source, product type, digestion method and ACF status (Table 1). Where measurement units differed between vendors, these measurement units were standarized so that the data sets were comparable.
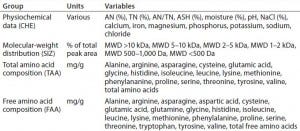
Table 2: Summary of compositional parameters used for principal-component analysis
A training dataset was selected comprised 65 ACF biological additives each with 59 variables describing physiochemical data, molecular-weight distributions, and total and free amino-acid content for each biological additive. Table 2 lists the variables used herein.
Analysis Approach: SIMCA P 11.5 (MKS Umetrics, Sweden) was used for error screening, PCA, and PLS analysis. ACF biological additions were selected from the compiled dataset to construct a PCA models. ACF biological additives came from the compiled dataset to construct PCA models. Variables that were available for ≥80% of products were used for analysis. All variables were preprocessed using mean-centering and univariate scaling before analysis.
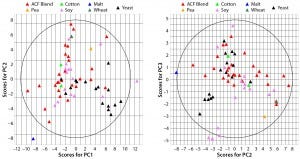
Figure 1: Principal-component score plot of (left) PC1 against PC2 and (right) PC2 against PC3; each point represents a biological additive. Colors indicate source raw material.
Results
PCA of Commercially Available ACF Biological Additives: A total of 59 variables describing each of 65 ACF biological additives were used to develop a PCA model. The resulting model captured 67% of the dataset variance within four PCs. Figure 1 shows the score plots for PCs 1, 2, and 3. The plots show how additive compositions are related to one another. On the left, yeast extracts tend to separate from ACF blends along PC1 (x) axis, whereas ACF blends and soy peptones tend to separate along PC2 (y) axis. Soy peptones and ACF blends tend to separate along PC3 (y) axis on the right.
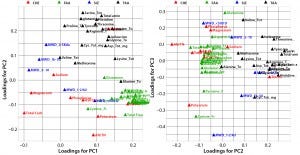
Figure 2: Principal-component loadings plot of (left) PC1 against PC2 and (right) PC2 against PC3; colors indicate variable type — CHE (red), physiochemical data (green), free amino acids (FAA, blue); molecular weight distribution (SIZ, blue), and total amino acid (TAA, black)
Figure 2 shows loading plots of PC1/PC2 (left) and PC2/PC3 (right), summarizing the relationships between the original composition variables and PC1 to PC3. Variable markers are colored according to variable type: physiochemical (CHE); free amino acid (FAA); molecular size distribution (SIZ); and total amino acids (TAA).
PC1 correlates positively with individual and total FAAs and with the percentage of aminonitrogen (%AN). Middle and high-range MW distributions correlate negatively with PC1. As would be expected, a higher degree of hydrolysis (AN/TN) is associated with increased low-range MW species and a higher FAA content. As the left panel of Figure 1 shows, yeast extracts tend to separate from ACF blends along PC1, indicating that yeast extracts are correlated with higher %AN and FAAs with a higher proportion of low-range MW species. PC2 correlates positively with TAA content, and PC3 associates with increased midrange MW species and correlates negatively with low-range MW species. ACF blends and soy peptones are distributed along PC2, indicating that the main cause of variation is due to variable TAA content. Soy peptones separate from ACF blends along PC3, which indicates that those peptones correlate with increased midrange MW species.
PCA Analysis of Batch Variability of ACF Biological Additives: Compositional data from multiple lots of the HyPep 1510 soy peptone and SheffCHO PF ACF blend came from the vendor’s website (7). Those data were compiled into the PCA model as described above.
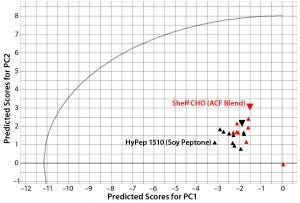
Figure 3: Principal-component scores plot of predicted scores from PC1 and PC2 for lot variability samples of Sheffield Bioscience HyPep 1510 and Sheff-CHO PF products; samples are colored by product. Typical reference samples are indicated by the larger inverted triangles.
Lot-to-lot comparison data from HyPep 1510 and SheffCHO PF ACF blend were used as a prediction set to compare typical reference data captured in the PCA model. Figure 3 compares a plot of predicted scores for each product lot with typical product-reference data (red circles). Because the predicted scores are within the t-test circular boundary of the PCA model, variability within product lots is well modeled. Even though all lots were manufactured to within specified ranges, lot-to-lot variability is clearly visible.
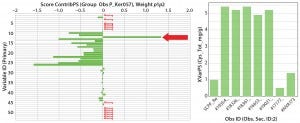
Figure 4: (left) Scores contribution plot for SheffCHO PF media showing model differences between typical reference data (Ker057) and a group of lot samples (arrow indicates that total cysteine content has increased in sample group); (right) total cysteine content in individual lot samples 1 AN (%) 2 TN (%) 3 AN/TN 4 ASH (%) 5 Magnesium 6 Phosphorus 7 Potassium 8 Sodium 9 Total Ala (mg/g) 10 Total Arg (mg/g) 11 Total Asp (mg/g) 12 Total Cys (mg/g) 13 Total glutamic acid (mg/g) 14 Total Gly (mg/g) 15 Total His (mg/g) 16 Total Ile (mg/g) 17 Total Leu (mg/g) 18 Total Lys (mg/g) 19 Total Met (mg/g) 20 Total Phe (mg/g) 21 Total Pro (mg/g) 22 Total Ser (mg/g) 23 Total Thr (mg/g) 24 Tyr 25 Total Val (mg/g) 26 Total amino acids (mg/g) 27 Total free amino acids (mg/g) 28 Free Ala (mg/g) 29 Free Arg (mg/g) 30 Free Asp (mg/g) 31 Free aspartic acid (mg/g) 32 Free Cys (mg/g) 33 Free glutamic acid (mg/g) 34 Free Gln (mg/g) 35 Free Gly (mg/g) 36 Free His (mg/g) 37 Free Ile (mg/g) 38 Free Leu (mg/g) 39 Free Lys (mg/g) 40 Free Met (mg/g) 41 Free Phe (mg/g) 42 Free Pro (mg/g) 43 Free Ser (mg/g) 44 Free Thr (mg/g) 45 Free Trp (mg/g) 46 Free Tyr (mg/g) 47 Free Val (mg/g) 48 MWD 5–10 kDa 49 MWD 2–5 kDa 50 MWD 1–2 kDa 51 MWD 500–1,000 Da 52 MWD <500 Da 53 Total carbohydrate (mg/g)
In Figure 3, SheffCHO PF lots are arranged in a distinct group below the typical reference data (inverted triangles). Lot NVA #1165 is located some distance away from the main group and typical reference data as a result of missing data. The remaining lots are distributed along the PC2 (y) axis, indicating some variability in the TAA content. The contribution plot in the left panel of Figure 4 shows differences between the group of lots (except for NVA #1165) compared with typical reference data. Different SheffCHO PF lots have on average lower TAA content than typical reference data indicate. In particular, SheffCHO PF lots generally have lower total glutamic acid, serine, and valine; they have higher total cysteine content than is reported in typical reference data.
The right panel of Figure 4 shows that cysteine content is fivefold greater across all lots compared with typical reference data. It is also clear from the left side of Figure 4 that although differences between the typical reference data and lots are clear, total FAAs are unchanged.
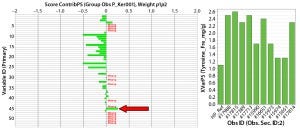
Figure 5: (left) Scores contribution plot for HyPep 1510 media showing model differences between typical reference data (Ker001) and a group of lot samples (arrow indicates that free tyrosine content has increased in sample group); (right) free tyrosine content in individual lot samples 1 AN (%) 2 TN (%) 3 AN/TN 4 ASH (%) 5 Magnesium 6 Phosphorus 7 Potassium 8 Sodium 9 Total Ala (mg/g) 10 Total Arg (mg/g) 11 Total Asp (mg/g) 12 Total Cys (mg/g) 13 Total glutamic acid (mg/g) 14 Total Gly (mg/g) 15 Total His (mg/g) 16 Total Ile (mg/g) 17 Total Leu (mg/g) 18 Total Lys (mg/g) 19 Total Met (mg/g) 20 Total Phe (mg/g) 21 Total Pro (mg/g) 22 Total Ser (mg/g) 23 Total Thr (mg/g) 24 Tyr 25 Total Val (mg/g) 26 Total amino acids (mg/g) 27 Total free amino acids (mg/g) 28 Free Ala (mg/g) 29 Free Arg (mg/g) 30 Free Asp (mg/g) 31 Free aspartic acid (mg/g) 32 Free Cys (mg/g) 33 Free glutamic acid (mg/g) 34 Free Gln (mg/g) 35 Free Gly (mg/g) 36 Free His (mg/g) 37 Free Ile (mg/g) 38 Free Leu (mg/g) 39 Free Lys (mg/g) 40 Free Met (mg/g) 41 Free Phe (mg/g) 42 Free Pro (mg/g) 43 Free Ser (mg/g) 44 Free Thr (mg/g) 45 Free Trp (mg/g) 46 Free Tyr (mg/g) 47 Free Val (mg/g) 48 MWD 5–10 kDa 49 MWD 2–5 kDa 50 MWD 1–2 kDa 51 MWD 500–1,000 Da 52 MWD <500 Da 53 Total carbohydrate (mg/g)
In Figure 3, HyPep1510 lots are positioned in a single group, which includes typical reference data. The group is distributed along the PC1 (x) axis, suggesting some variability in FAAs. Investigation of contribution plots compares differences between typical reference data and the average of HyPep 1510 lots (Figure 5). Contribution weights plotted in the left panel of Figure 5 show no major differences between lots and reference materials. The actual TAA content is reduced for many individual amino acids compared with the reference material. However, free tyrosine content does appear elevated in new HyPep1510 lots. The right panel of Figure 5 shows that free tyrosine content is quite variable in the HyPep 1510 lots compared with the typical reference data. Six out of the 10 HyPep 1510 lots showed twofold increased free tyrosine content over typical reference data.
No data are currently available on culture growth and productivity using those lots, so it is not possible to determine whether variability identified in multiple lots of biological additives has a biological impact. Lot-to-lot variability of biological additives has been shown to affect mammalian cell growth and monoclonal antibody productivity (13). It may be possible to predict the influence of lot-to-lot variability on cell culture growth and productivity if culture performance is evaluated for multiple lots of a biological additive. It then would be possible to correlate compositional variability with culture performance and/or product quality attributes using PLS modeling techniques detailed below.
PCA Analysis of Alternative Commercial Biological Additives: The commercial market for biological additives to supply cell culture and microbial fermentation applications is competitive, with new products continually coming to market. When a vendor has provided sufficient and appropriate compositional data, such new products could be compared quickly using the PCA model.
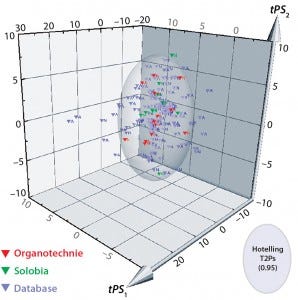
Figure 6: 3D predicted-scores plot for new biological additives manufactured by Solobia (red) or Organotechnie (green); database products shown in grey. Each product is labeled to indicate (N) nonanimal- or (A) animal-derived origin.
The compositional data from 10 additives manufactured by Solobia and 13 additives manufactured by Organotechnie were added to the database. Units were standardized as described in the materials and methods. The new dataset was imported into SIMCA for comparison with the PCA model as a prediction set. Figure 6 is a 3D plot comparing predicted scores for the new products with those for all 145 products in the database. The plot shows that many additives are captured within the Hotelling T2 ellipsoid region, including the new products. Many of the products located outside the Hotelling T2 region are animal derived and distributed along both PC1 and PC2 axes.
Organotechnie products lie within the Hotelling T2 region, which predominantly contains nonanimalderived products, as expected. However, two Solobia products — a potatoderived peptone and a malt extract — lie outside that region, which suggests that those two are significantly different from other additives. A contribution plot comparing potato peptone with the model average (not included here) showed that the potato peptone has elevated levels of total cysteine and threonine. Whether those differences translate into a biological impact remains to be determined.
Linking Biological Additive Composition to Culture Performance Using QSAR: A number of techniques have been used to select and optimize biological additives for cell culture and microbial growth media. One vendor has reported a factorial-design based technique for media optimization that has been developed into a commercially available kit (8, 9). I propose an alternative multivariate modeling approach that uses the QSAR technique to link biological additive composition and culture performance. Extensively applied in drug-discovery applications, QSAR has been used for screening and selection of polypeptide-based drugs (10, 11). But to my knowledge, development and optimization of growth media is a novel application of the technique.
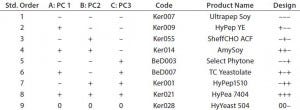
Table 3: QSAR factorial design; design factors were matched with the first three principal components of the PCA model. Biological additives were manually selected from the PCA model that showed the closest match to the design points.
The compositional variability of 65 ACF biological additives has been previously captured in a PCA model. Principal components are orthogonal by definition and can be used in factorial design experiments, with each principal component a design factor (11). Table 3 shows the design points for a two-level, three-factor design with one center point where each factor is a principal component from the PCA model. Each design point is associated with a biological additive by matching its location in the principal-component space of the PCA model. For this design, it was not possible to match the center-point exactly to a given biological additive. However, the center-point mismatch was in PC3, which accounted for much less variance than PC1 and PC1 so it was not considered critical.

Equations 1 and 2
Simulated cell culture performance data are used to demonstrate the QSAR approach because information is currently unavailable for a single cell line grown using each of the biological additives in the design. For the cell culture experiment, the QSAR approach assumes that similar concentrations of biological additives are added either to the basal media before inoculation or as a feed over the duration of the culture. Final product concentration (titer) and integrated viable-cell (IVC) output variables were simulated directly from the chemical composition data using Equations 1 and 2 in a Microsoft Excel spreadsheet. The composition variables used in those equations arbitrarily came from the chemical composition dataset. For simplicity, titer and IVC were simulated using linear equations with the same set of variables assuming no variable interaction. Weightings were selected for each variable to provide values of titer and IVC similar to those found in published literature. Triplicate values of each output variable were generated by adding artificial noise with a standard deviation of ±10%.
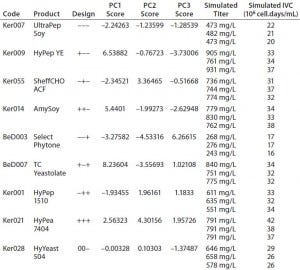
Table 4: QSAR design and simulated output values for final titer and integrated viable cells (IVC)
PCA scores for each design point and triplicate simulated titer and IVC values from Table 4 were used to fit a PLS model (10). The resulting three-component model has R2Y = 0.9 and Q2 = 0.81.
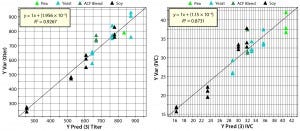
Figure 7: Parity plots comparing predicted with simulated values for titer and IVC predictions; point colors indicate source materials used to produce each biological additive.
Figure 7 shows parity plots comparing cell culture performance data with PLS model predictions for titer and IVC. Both plots show good agreement between predictions and simulated data. Differences between the regression coefficient (R2) in the parity plots suggest that titer model correlation is better than IVC model correlation. Those differences are a function of relative weights of compositional variables used to simulate titer and IVC. Compositional variables that correlate (load) strongly with PC1, 2, and 3 (Figure 2) would be expected to have a strong influence on titer and IVC. Predictions from the PLS model come from PCA score values rather than original compositional data, which demonstrates the PCA model’s ability to capture sufficient information from the chemical composition data to predict titer and IVC using the PLS model derived from the QSAR approach. The PLS model then can be used to predict culture performance for remaining biological additives in the database that were not used as part of the training set.
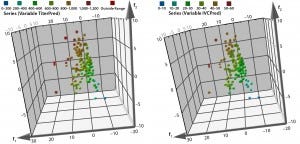
Figure 8: 3D predicted-scores plot from biological additives not used in PCA model training set; color coding indicates the prediction ranges for each biological additive predicted from the QSAR PLS model; (left) titer in mg/L and (right) IVC in 106 cells/mLs/day.
The 3-D score plots in Figure 8 show the ranges of predicted titers and IVCs for remaining biological additives in the database. In this example, biological additives with more positive score values for PC1 and PC2 are predicted to correlate with higher product titers and IVCs.
A New MVA Application
This work demonstrates that PCA modeling can be used to account for the chemical composition of ACF biological additives used in cell culture or fermentation media. The PCA model accounted for 65% of the variance in compositional data from 65 ACF biological additives. As expected, the PCA model showed that composition of the biological additives varied predominantly in FAA content (in PC1). TAA content was largely independent of FAA content because TAA parameters were strongly associated with PC2 whereas FAA parameters were strongly associated with PC1 (Figure 2). Scores plots show that yeast-extract FAA composition is more variable compared with blended ACF peptone FAA composition. That difference reflects a higher degree of control on variability that can be achieved during soy peptone manufacturing when compared with yeast-extract manufacturing.
Compositional analysis for multiple batches of Kerry Bioscience biological additives (Sheffield HyPep 1510 and SheffCHO PF) were compared with the PCA model, which contained typical reference data for each product (Figure 3). Although lot variability for both products was well represented by the PCA model, some lot-to-lot variability was detected when data were compared with the PCA model. The typical reference composition for HyPep 1510 was representative of the test lots. Some minor variability was identified in TAA variable and FAA tyrosine content (Figure 5, left); the latter was found to be twofold higher than the typical reference composition (Figure 5, right).
SheffCHO PF lot PCA scores showed some differences from typical reference composition, falling into a group separated from the typical composition (Figure 4, left). These small differences to were attributed to variability in TAA content — and in particular, total cysteine, total serine, and TAA content. The PCA model identified that total cysteine content was consistently five times greater in lot data than in the typical reference data (Figure 4, right). Because FAA content and physiochemical data do not vary as much, the biological relevance of those differences in TAA content locked up in peptides is unknown. The effects should depend on the ability of a culture to break down polypeptides, a capability that depends on cell line and culture growth characteristics.
PCA provides a simple, visual way to assess multivariate differences in chemical composition of biological additives. It also allows for rapid identification of the root cause of lot-to-lot variability. Additional culture data will be required to establish whether observed lot variability is biologically relevant.
A similar approach was used to evaluate lot variability and evaluate the composition of new products. Those new products will be included in future versions of the PCA model training set. New biological additives manufactured by Solobia and Organotechnie were compared with the PCA model. As expected, predicted scores for many new products were well represented by the PCA model. Two products (malt extract and potato peptone) fell marginally outside the Hotelling T2 limits of the PCA model, suggesting that potato peptone in particular would be a good subject for testing whether compositional differences cause different culture behavior.
A QSAR-based approach can link chemical composition data captured in the PCA model to culture performance. Because the axes of a PCA model are orthogonal, a statistically based factorial design experiment can be used to evaluate a subset of biological additives that represent training set. PLS regression modeling was used to link PCA scores with simulated culture performance. The resulting model makes it possible to establish whether product differences or lot variability are biologically relevant for a cell line under evaluation.
To apply the QSAR method for a new cell line, cultures may be grown in basal media containing different biological additives. But care must be taken to account for improvements resulting from adaptation to new conditions rather than an effect of the biological additive(s). Alternatively, the effect of additives on culture performance can be evaluated using a consistent feeding strategy. Such a strategy typically involves adding feed at intervals after a culture has reached peak cell density. A fixed quantity of feeds made from biological additives shown in Table 3 then can be added to cultures at fixed intervals. QSAR-based models for each new cell line also would provide an opportunity to rapidly evaluate the impact of remaining biological additives in the database and whether cell lines have distinct nutritional requirements.
To simplify this application of QSAR, a subset of biological additives was selected using standard factorial design. Wold et al. suggested that a standard factorial design may not efficiently map the multivariate space captured by a PCA model (10). They recommended using D-optimal experimental designs that provide more efficient coverage of a multivariate space. Such designs use a computer algorithm to select a subset of conditions from a set of fixed conditions to efficiently cover the multivariate space. In addition, designs also can be adapted to use a range of biological additives of different concentrations.
PCA was used to analyze a subset of 65 ACF biological additives from a larger dataset of 145 biological additives. The larger set also has been analyzed, but that is not reported here. As new biological additives or additional analysis become publically available, the dataset will be updated annually.
Approaches described herein can be used to rapidly evaluate new cell lines. The performance of a cell line can be predicted on most commercially available biological additives by carrying out a series of experiments using a much reduced subset of biological additives. That subset can be selected using a design-of-experiment (DoE) approach such as factorial or D-optimal designs. As new biological additives become commercially available, cell line performance then can be predicted using the QSAR-PLS model than can be quickly derived from each cell line.
References
1 Protein Therapeutics. Sheffield Bioscience: Beloit, WI, 2015; www.sheffieldbioscience.com/ protein-therapeutics.
2 Rathore AS, Singh SK. Use of Multivariate Date in Bioprocessing. BioPharm Int. 28(6) 2015: 26–31.
3 Eriksson L, et al. Multi- and Megavariate Data Analysis, Part I: Basic Principles and Applications. MKS Umetrics AB: Umeå, Sweden, 2006; 1–103.
4 Bridson EY. The Oxoid Manual, 8th edition. Oxoid Ltd.: Basingstoke, Hampshire, UK, 1998.
5 BD Bionutrients Technical Manual: Advanced Bioprocessing, Third edition. BD Biosciences: Sparks, MD, 2011.
6 Technical Manual: Supplements for Cell Culture, Fermentation and Diagnostic Medium. Sheffield Bioscience: Beloit, WI, 2013.
7 Product Technical information. Sheffield Bioscience: Beloit, WI, 2015; www.sheffield product.co.uk.
8 DeLong B, et al. Development of an Efficient Medium Optimization Kit for Factorial Matrix Design: A Statistical Approach to Increase Cell Growth and Productivity of Recombinant CHO Cells (poster). Waterside Conference: Beverly Hills, CA, May 2004; www.sigmaaldrich.com/content/dam/sigma-aldrich/docs/Sigma/General_Information/delong_ poster_8.5x11_5-8-03.pdf.
9 Zhang MM, et al. CHO Media Library: An Efficient Platform for Rapid Development and Optimization of Cell Culture Media Supporting High Production of Pharmaceutical Proteins in Chinese Hamster Ovary Cells (poster). SBE’s First Conference on Accelerating Biopharmaceutical Development: San Diego, CA, 2007; www.sigmaaldrich.com/content/dam/ sigma-aldrich/docs/Sigma/General_Information/ chomedialibrary.pdf
10 Wold S. A Multivariate Approach to QSAR. Multi- and Megavariate Data Analysis, Advanced Applications, and Method Extensions, Part 2. Eriksson L, et al., Eds. MKS Umetrics AB: Umeå, Sweden, 2006.
11 Wold S. Peptide QSAR. Multi- and Megavariate Data Analysis, Advanced Applications and Method Extensions, Part 2. Eriksson L, et al., Eds. MKS Umetrics AB: Umeå, Sweden, 2006.
12 Ryan PW et al. Prediction of Cell Culture Media Performance Using Fluorescence Spectroscopy. Anal. Chem. 82(4) 2010: 1311– 1317.
13 Luo Y, Pierce KM. Development Toward Rapid and Efficient Screening for High Performance Hydrolysate Lots in a Recombinant Monoclonal Antibody Manufacturing Process. Biotechnol. Prog. 28 (2012): 1061–1068.
Ronan O’Kennedy, PhD, is founder and principal of ROK Bioconsulting in the United Kingdom; [email protected]; rokbioconsulting.com.
You May Also Like


