Experiences with a Benchtop-Scale Glass Bioreactor: Engineering Data and Cultivation ResultsExperiences with a Benchtop-Scale Glass Bioreactor: Engineering Data and Cultivation Results
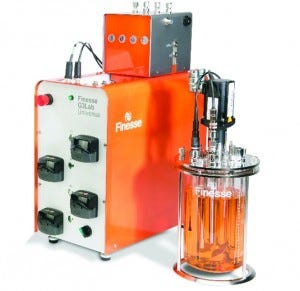
Photo 1: SmartGlass bioreactor with the G3Lab Universal controller
Animal cell lines (the dominant expression systems in biopharmaceutical production processes) are mostly cultivated in stirred bioreactors (1). Although such bioreactors are widely accepted and applicable over a wide range of scales, engineering data for these systems are still lacking. Nevertheless, studies have shown that the correct choice of key parameters (e.g., power input, tip speed, mixing time, and oxygen mass transfer) can influence the growth of animal cell cultures (2). Therefore, detailed characterization is essential. It enables reliable scaling up of production processes and can be used to compare different bioreactors.
Finesse Solutions, Inc. has commercialized its laboratory-scale SmartGlass bioreactor (Photo 1). The system has a maximum working volume of 2 L and is agitated by combined two-stage axial-radial flow impellers. A Finesse G3Lab Universal controller, powered by Finesse TruBio software, operates the bioreactor. In a previous study, initial cultivation results were published for transfected Chinese hamster ovary (CHO) cells that produce secreted alkaline phosphatase (SEAP) (3). Here, we provide the main engineering data for specific power input, mixing time, and oxygen mass transfer. We also demonstrate the suitability of the SmartGlass bioreactor in cultivating an insect cell line used for SEAP expression. Insect cells have high expression rates, are useful for eukaryotic posttranslational modifications, and lack a limit for protein size (1). Insect cells often are used with the baculovirus expression system (BEVS) to produce recombinant proteins and protein-based vaccines (4).
Materials and Methods
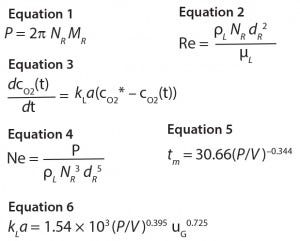
Equations:
We determined the power input through the torque acting on the impeller shaft (MR) using Equation 1, with the impeller speed NR. We took torque measurements using a torque meter (T20WN, Hottinger Baldwin Messtechnik AG). We used a special zero-friction air bearing from IBS Precision Engineering to minimize the dead torque (torque measurement in an air-filled system). A Spider 8 transmitter with Catman easy software (HBM, Germany) performed data acquisition and storage. To guarantee stable measurements, data were recorded over 8 minutes for each operational condition. Power input was measured for impeller Reynolds numbers (Re) in the range of 150–26,600, according to Equation 2, in which ρL, μL, and dR represent the liquid density, viscosity, and impeller diameter, respectively. Low Reynolds numbers (<2,500 ) were achieved for elevated liquid viscosities (to 60 mPa*s) using sucrose solutions (20–60 w/w%).
We determined oxygen mass transfer rates using the standard gassing-out method with an electrochemical oxygen probe, as described by Löffelholz, et al. (5) and recommended by DECHEMA guidelines (work in progress). After evacuating dissolved oxygen (DO) by nitrogen sparging until the DO reading was nearly zero, we set the stirrer to defined speeds between 100 rpm and 300 rpm (tip speeds of 0.29 m/s and 0.86 m/s). Air sparging saturated the liquid at flow rates up to 0.2 slpm until the DO reading was ≥98%. Assuming a well-mixed vessel and kLa values well below the kLa << 1/te criterion (6), we determined the kLa value from Equation 3, in which cO2* is the oxygen saturation concentration.
Mixing time analysis used decolorization, based on the 95% homogeneity criterion. First, we added 0.2 mL phenolphthalein indicator (2 g/L) to the bioreactor, which was filled with 2 L of pure water. By adding 0.95 mL sodium hydroxide solution (4 M NaOH) to each run, we obtained a dark pink solution. Then we added 1 mL hydrochloric acid (4 M) and measured the time required to completely decolorize the solution. A diluted NaOH solution neutralized the molar excess of the acid. We performed the experiment five times and presented results as mean values of the replicates with the simple standard deviation.
Insect Cultivation: A different study describes a procedure for cultivating Spodoptera frugiperda Sf9 insect cells with the BEVS expression system and expressing the protein (8). We cultivated cells in serum-free Gibco Sf 900 III SFM (Invitrogen) medium at 26 °C.
With the pH value (5.85–6.2) unregulated, dissolved oxygen in the bioreactor was automatically maintained near to the set point of 50% by addition of pure oxygen and increasing impeller speed (to a range of 150–180 rpm), as required. We inoculated cells with densities of about 1.0 × 10⁶ cells/mL. They were infected two days later with an infected cell density (ICD) of 2 × 10⁶ cells/ mL and a multiplicity of infection (MOI) of 0.01 pfu/cells using the Sil9.1.1_GFP_SEAP_HisMP9.8V2 recombinant virus (kindly provided by the ZHAW’s molecular biology group). We sampled the culture daily.
We determined total and viable cell density, viability, and cell diameter using a Cedex HiRes cell counting device (Roche Diagnostics). We analyzed metabolites (glucose, glutamine, lactate, and ammonium) using a BioProfile 100 plus multibioanalyzer (Nova Biomedical). We determined SEAP activity photometrically with a MultiSkan plate reader (Thermo Electron Corporation) and by detecting the dephosphorylation of para-nitrophenol-phosphate (pNPP) to para-nitrophenol (pNP). SEAP activity was calculated from the change of absorbance per minute of reaction.
Results and Discussion
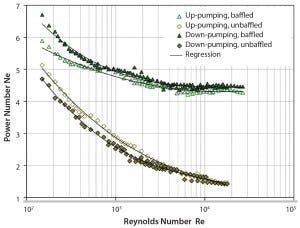
Figure 1: Dimensionless power number (calculated as Equation 4) as a function of the Reynolds number in the unbaffled and baffled vessel agitated with up- and down-pumping mode.
We determined power input (one of the most important scale-up criteria for stirred bioreactors) over a wide range of Reynolds numbers (150–25,000) (Figure 1). The upper limit was achieved for water-like media at impeller tip speeds of 1.6 m/s. In agreement with conventional single – and multistage impellers, the dimensionless power number Ne (Equation 4) decreased as the Re increased. In the baffled vessel, a constant Ne of ~4.4 was achieved above a critical Re of ~104, which is typical for many impellers (7). Note that lower Reynolds numbers are achieved only at elevated liquid viscosities if cell culture typical impeller speeds are used, which is the case for plant cell broths (9). But this scenario is unlikely for animal cell cultures.
Power input was independent of the direction of impeller rotation (identical for the up- and down-pumping mode of the axial-flow impeller) (Figure 1). We observed significantly lower power inputs without baffles, which confirmed our expectations. Furthermore, no constant power number was achieved in the unbaffled vessel, which can be explained by the progressive thrombus formation that also limits impeller speed to ~300 rpm (tip speed 0.86 m/s).
We determined mixing time in the bioreactor with and without baffles for impeller speeds between 100 and 300 rpm, where we observed no significant thrombus formation. The vessel was nonaerated because aeration was not expected to significantly influence mixing at typical cell culture aeration rates (supported by data from Reference 10).
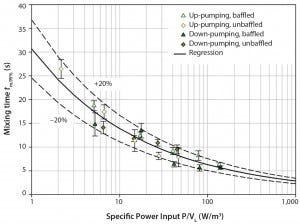
Figure 2: Determined mixing times in the SmartGlass bioreactor with and without baffles as a function of the specific power input
Figure 2 shows that mixing times decreased as specific power input increased. That can be explained by increasing turbulence, which is the driving force for mixing. We observed mixing times between 5.6 s and 26.4 s (dependent on impeller speed), which is within typical range for cell-culture applications. No mixing dead zones were observed during the experiments, which underlines the good mixing performance. Equation 5 represents the solid line in Figure 2; the exponent of the specific power input is very similar to the theoretical value (–1/3), assuming a constant mixing number cH (product of impeller speed and mixing time cH = tm×NR) for turbulent conditions (7).
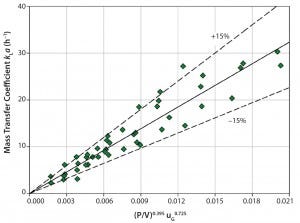
Figure 3: Measured kLa values in the SmartGlass bioreactor as function of specific power input and superficial gas velocity
We determined the specific oxygen mass transfer coefficient kLa in the SmartGlass bioreactor for 100–300 rpm impeller speeds and 0.025–0.125 vvm aeration rates for a maximum working volume of 2 L. The kLa value increased from 2.3/h to a maximum value of 30.3/h as the impeller speed and aeration increased (Figure 3). Results could be correlated with Equation 6, in which the specific power P/V and the superficial gas velocity uG are given in W/m3 and m/s, respectively.
Hence, influence of aeration on oxygen mass transfer was greater than that of the power input (impeller speed) — a relationship often found in cell-culture bioreactors because of low impeller speeds and resulting poor gas dispersion. In addition, relatively high kLa values are also achievable at low gassing rates. This can be explained by the SmartGlass bioreactor’s microsparger, which produces small gas bubbles (<0.5 mm) that provide a large specific surface area for oxygen mass transfer. Depending on production strain and achievable cell density, typical kLa values for most cell cultures are up to 15/h in low to medium cell density range (11). Such values were sufficient for the insect cell culture described below.
Nevertheless, higher values may be required for high–cell-density applications using high oxygen-demanding cell lines, for which kLa > 30/h may be necessary. Note that we performed all experiments using phosphate-buffered saline (PBS), which (based on previous experiments) closely mimics most cell-culture media used in our laboratory. However, results can vary when using different culture media, especially high-serum, complex media, which are known to alter bubble-size distribution (12).
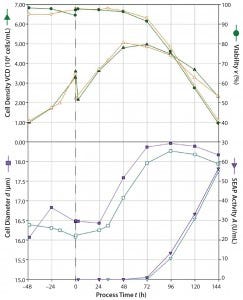
Figure 4: Sf9 cell cultivation results in the SmartGlass bioreactor; viable cell density and cell viability (top); rSEAP activity and average cell diameter (bottom); two individual runs are indicated by solid (run 1) and open (run 2) symbols. The dashed line indicates the point of virus addition.
Insect Cell Cultivation: We evaluated the applicability of the SmartGlass bioreactor for cultivation of Sf9 insect cells in two individual cultivation runs using the BEVS expression system for SEAP production (Figure 4). Viable cell density increased from an initial 1 × 10⁶ cells/mL to ~3.5 × 10⁶ cells/mL within 48 hours of cultivation, which corresponds to a mean specific growth rate of 0.026/h and a doubling time of 26.6 h. Afterward, the cell density was adjusted to the desired ICD of 2.0 × 10⁶ cells/mL at the maximum working volume of 2 L.
We then added the virus with an MOI of 0.01 pfu/cell, which is optimal for protein expressions in previous work conducted in our laboratory (14). After the virus infection, viable cell density increased to a peak cell density of 5 × 10⁶ cells/mL on the second day after infection for run 2 and on the third day after infection for run 1. Although cell viability in both runs was >95% during the first four cultivation days, it started to decline during progressive virus release from the cells and reached 40% after 144 h postinfection, and the process was stopped. Virus production was accompanied by an increase in cell diameter from ~16.5 μm to ~18.3 μm. We observed a slight offset between the two cultivation runs. Nevertheless, we found no significant differences in rSEAP between the two runs. The rSEAP activity increased 72 h postinfection and reached maximum values of ~55 U/mL at the end of the process for both runs. That indicated good process reproducibility. Maximum rSEAP activity also was within typical ranges established in previous work using the same virus type (4).
Benefits of Implementation
We studied the engineering characteristics of the SmartGlass bioreactor, a novel benchtop bioreactor from Finesse Solutions, Inc. Using traditional experimental methods, our data demonstrated the comparability of the bioreactor with existing systems in terms of mixing and power input. The microsparger and resultant small bubbles help the system achieve high kLa values of up to 30.3/h at relatively low aeration rates. Such values are sufficient for high cell densities of most production organisms. We also demonstrated applicability of the SmartGlass bioreactor for BEVS-based protein production in two individual runs, indicating excellent reproducibility.
Acknowledgments
We thank Sören Werner for his contributions to the power input measurements and Nina Steiger for her support during the insect cell cultivations.
References
1 Demain AL, Vaishnav P. Production of Recombinant Proteins by Microbes and Higher Organisms. Biotechnol. Adv. 27, 2009: 297–306; doi: 10.1016/j.biotechadv.2009.01.008.
2 Platas Barradas O, et. al. Evaluation of Criteria for Bioreactor Comparison and Operation Standardization for Mammalian Cell Culture. Eng. Life Sci. 12(5) 2012: 518–528; doi: 10.1002/elsc.201100163.
3 Kaiser SC, Blaschczok K, Eibl D. Novel CHO Suspension Cell Cultivation: Studying Cell Growth and SEAP Expression in the Finesse SmartGlass™ Bioreactor. Gen. Eng. News 33(14) 2013: 32–33; doi: 10.1089/gen.33.14.17.
4 Imseng N, et al. Single-Use Wave-Mixed Versus Stirred Bioreactors for Insect-Cell/BEVSBased Protein Expression at Benchtop Scale. Eng. Life Sci. 14(3) 2014: 264–271; doi: 10.1002/ elsc.201300131.
5 Löffelholz C, et al. Bioengineering Parameters for Single-Use Bioreactors: Overview and Evaluation of Suitable Methods. Chem. Eng. Tech. 85(1–2) 2013: 40–56; doi: 10.1002/cite.201200125.
6 Badino Jr AC, Facciotti MCR, Schmidell W. Improving kLa Determination in Fungal Fermentation, Taking into Account Electrode Response Time. J. Chem. Technol. Biotechnol. 75(6) 2000: 469–474; doi: 10.1002/10974660(200006)75:6.
7 Liepe F, Sperling R. Jembere S. Rührwerke: Theoretische Grundlagen, Auslegung, und Bewertung. Eigenverlag FH Anhalt Köthen, 1998.
8 Kaiser SC, et al. Cultivation of Sf9 Insect Cells and SEAP Expression: The Finesse SmartGlass™ Bioreactor. www.finesse.com.
9 Kieran PM, MacLoughlin PF, Malone DM. Plant Cell Suspension Culture: Some Engineering Considerations. J. Biotechnol. 59(1–2) 1997: 39–52; doi: 10.1016/S0168-1656(97)00163-6.
10 Hadjiev D, Sabiri NE, Zanati A. Mixing Time in Bioreactors under Aerated Conditions. Biochem. Eng. J. 27(3) 2006: 323–330; doi: 10.1016/j.bej.2005.08.009.
11 Nienow AW. Reactor Engineering in LargeScale Animal Cell Culture. Cytotechnol. 50(1–3) 2006: 9–33; doi: 10.1007/s10616-006-9005-9.
12 Michaels JD, et al. Interfacial Properties of Cell Culture Media with Cell-Protecting Additives. Biotech. Bioeng. 47(4) 1995: 420–430; doi: 10.1002/bit.260470403.
13 Schirmaier C, et al. Scale-Up of Adipose Tissue-Derived Mesenchymal Stem Cell Production in Stirred Single-Use Bioreactors under Low-Serum Conditions. Eng. Life Sci. 14(3) 2014: 292–303; doi: 10.1002/elsc.201300134.
14 Steiger N. Establishment and Test of Model Baculoviruses for Protein Production in Insect Cells. Zűrich University of Applied Sciences (unpublished), 2008.
Stephan C. Kaiser is part of the chemical engineering staff, Nadezda Perepelitsa is a scientific associate, and Ina Dittler is a scientific associate at Finesse Solutions, Inc., Santa Clara, California. And Dieter Eibl is a professor and leader of the biochemical engineering working group at Zürich University of Applied Sciences, School of Life Sciences and Facility Management, Institute of Biotechnology, Section for Biochemical Engineering and Cell Cultivation Technique, Waedenswil, Switzerland.
You May Also Like


