Lessons in Bioreactor Scale-Up: Part 3 — Experimental Determination and Application of Oxygen Mass- Transfer Rate, Mass-Transfer Coefficient, and Oxygen-Uptake RateLessons in Bioreactor Scale-Up: Part 3 — Experimental Determination and Application of Oxygen Mass- Transfer Rate, Mass-Transfer Coefficient, and Oxygen-Uptake Rate
September 9, 2024
The term mass transfer refers to movement of a component in a mixture from a region of high concentration to one of low concentration. Transfer can take place in a gas, vapor, or liquid, and it results from the random velocities of molecules (molecular diffusion) or from circulating or eddy currents in a turbulent fluid (eddy diffusion) (1). For example, when a drop of dye is added to water in a container, mass transfer results in the movement of dye molecules through the water until an equilibrium is reached and the dye’s concentration has become uniform. Mass transfer occurs under the influence of a concentration difference or concentration gradient (a concentration difference over a unit area) in a system.
Many bioprocess steps involve material movement initiated by mass-transfer mechanisms. A well-known example is oxygen supply to fermentation or cell-culture bioreactors: During cultivation, O2 transfers from sparged air (gas phase) through the gas–liquid interface to the bulk liquid medium. There, culturing cells consume the oxygen and produce CO2 through cellular respiration. Once excreted into the liquid medium, that CO2 passes through the gas–liquid interface and diffuses into the gas phase to be carried out of the bioreactor. Transfer of O2 or CO2 molecules from one phase to another occurs only when those phases have different concentrations. If, for example, O2 concentration is in equilibrium between two phases — e.g., when liquid medium is saturated with oxygen — then there will be no net O2 transfer in either direction. And if O2 mass transfer from gas bubbles is slow, the rate of cellular metabolism will depend on the rate of oxygen supply from the gas phase. Because O2 is a critical component of aerobic metabolism and is sparingly soluble in aqueous solutions, considerable research has gone into understanding its mass-transfer mechanisms — and into ways to improve the oxygen supply across the gas–liquid interface, especially in complex systems such as bioreactors.
Similarly, liquid–solid mass transfer is important to immobilized cell systems such as microcarriers, cell aggregates, and flocs. In such systems, nutrients present in the liquid phase must be transported to the solid phase before cells can use them. Again, a slow mass transfer rate can limit such biological reactions.
In solids and stationary fluids, mass transfer occurs mainly because of molecular diffusion. Most systems of bioprocessing interest, however, contain moving fluid, so both molecular diffusion and convective mass transfer are important considerations for bioreactor operation and scale-up.
Oxygen Transport Through Gas–Liquid Interfaces
Dissolved oxygen (DO) concentrations in cell-culture media can be expressed in many different units. At 37 °C and in contact with air at atmospheric pressure (21% O2), oxygen is sparingly soluble in water (and cell-culture media): 0.21 mM (6.8 mg/L). Because oxygen accounts for 21% of air, the partial pressure of oxygen (PO2) in air is 0.21 atm (159.6 mm Hg). Hence, when water (or cell-culture media) is in equilibrium with oxygen, a DO concentration of 100% is equivalent to 159.6 mm Hg. (Expression of oxygen’s solubility in terms of mm Hg is common in medicine, and many blood-gas analyzers used in cell-culture applications express DO concentration in mm Hg.)
Theoretically, when a liquid that is devoid of gas molecules comes in contact with air, both oxygen and nitrogen will diffuse into the liquid. Eventually, an equilibrium will be established, in which oxygen and nitrogen concentrations are equal in both phases, and no net mass transfer will take place. At equilibrium, if the oxygen concentration in the gas phase is increased (e.g., to 30%), then the oxygen concentration of the liquid is no longer saturated, and oxygen again will diffuse into the liquid until a new equilibrium is established. Conversely, if the gas phase’s oxygen concentration is decreased, say to 10%, then oxygen will start to escape from the liquid into the gas phase until a new equilibrium is reached. Thus, mass transfer requires a deviation from equilibrium conditions. Often, that deviation is called the driving force, and determining its magnitude is the first step toward calculating the rate of mass transfer.
Postulated about a century ago, the two-film theory is one of the first models to describe mass transfer. Therein, mass transfer of solute involves transport from the bulk of one phase to the phase boundary or interface and then from the interface into the bulk of the second phase. This theory is based on the idea that a thin, invisible, and stagnant fluid film (or mass-transfer boundary layer) forms on both sides of the interface. Mass transfer through such films occurs by molecular diffusion only. The films also present resistance to mass transfer, leading to a decrease in concentration of solute from one phase to another.
The two-film theory provides a significantly simplified representation of mass transfer. Other models of mass transfer in fluids provide more realistic mathematical outcomes than does the two-film theory. Nevertheless, irrespective of how mass transfer is visualized, diffusion is always an important mechanism close to the interface between fluids.
Figure 1 depicts oxygen transfer across a gas–liquid interface according to the two-film model. The variable C represents the concentration of oxygen in bulk liquid (liquid away from the interface). In the bulk gas phase, PO2 represents the partial pressure of oxygen. The oxygen concentration in a liquid that is in equilibrium with the gas phase — and having an oxygen partial pressure of PO2 — is denoted as C*. Similarly, the gas-phase partial pressure is P*O2 when it is in equilibrium with a bulk liquid phase with an oxygen concentration of C. The driving force for mass transfer in the liquid phase equals (C* – C). Similarly, the gas-phase driving force is (PO2 – P*O2). Those seemingly different descriptions of the same driving force are related by Henry’s constant. Because the interface has liquid and gas films and because those films offer resistance to mass transfer by diffusion, both liquid- and gas-phase concentrations drop during mass transfer.
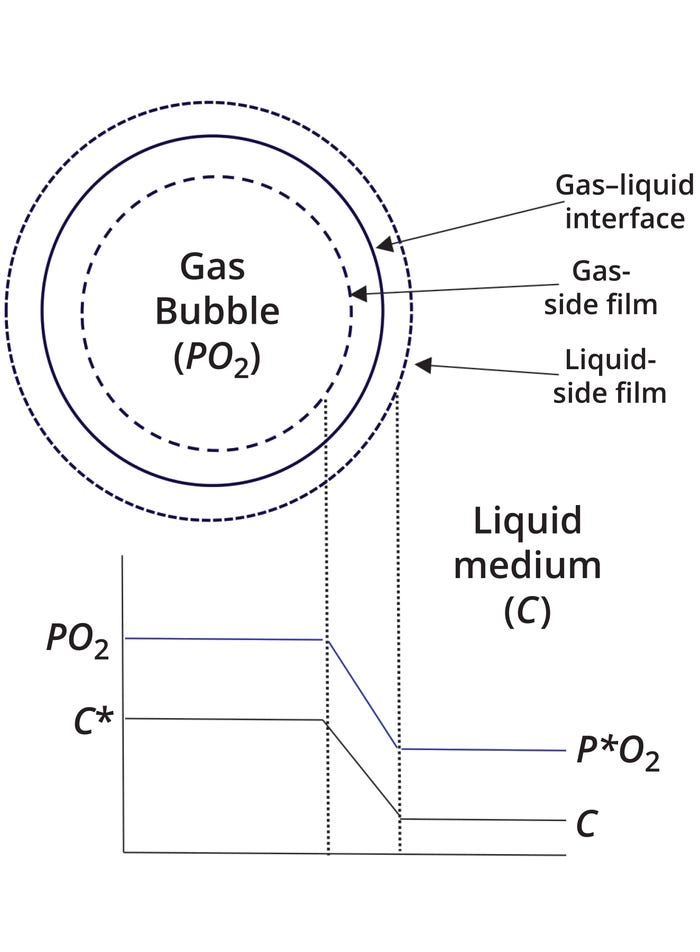
Figure 1: Depiction of oxygen conventration and partial-pressure profiles across an air bubble in a cell culture medium, according to the two-film theory.
The rate of mass transfer is proportional to both the driving force and the area over which transfer occurs:
(Mass-Transfer Rate) ~
(Transfer Area × Driving Force)
That proportionality can be replaced by a constant, known in this case as the mass-transfer coefficient (kL). Hence,
Equation 1
Mass-Transfer Rate =
kL × Transfer Area × Driving Force
Using the oxygen-concentration profile that I discussed above, the mathematical expression of Equation 1 for oxygen mass transfer is
Equation 2
OTR = kL × a × (C* – C)
Therein, kL is the mass-transfer coefficient (cm/h), a denotes the interfacial area available for mass transfer (cm–1), and (C* – C) represents the driving force (mmol/L). Hence, OTR is expressed as mmol/(L/h).
Two other factors that affect mass-transfer rates are the available surface area for transfer and the proportionality constant, also called the mass-transfer coefficient. The available surface area typically is expressed as the interfacial area per unit volume (cm2/cm3). The higher the available surface area, the higher the mass-transfer rate will be. Human lungs provide a good example of how large surface areas can be used to increase oxygen transfer: When fully expanded, our lungs can provide an area of ≈150 m2, enabling far more efficient oxygen transfer than, for instance, human skin can provide.
The mass-transfer coefficient represents resistance to mass transfer at a liquid–gas interface. Key factors in determining coefficient include the specific molecules that are being transferred and the physical and chemical properties of the liquid phase. To understand the resistance to mass transfer at the interface, imagine the interfacial film as a stagnant boundary layer surrounded by the bulk liquid (or gas). Some mixing already occurs inside the boundary layer, and oxygen molecules must diffuse across each boundary layer to reach the other phase. If the bulk liquid is undergoing vigorous mixing (as in a stirred bioreactor), then the boundary layers will be thin, and transfer will be fast.
In most bioprocessing applications, it is difficult to estimate the interfacial area, a. For example, when air or oxygen is sparged in a bioreactor, a depends on the size and number of bubbles present — and those depend on many other factors, such as medium density and viscosity, power input (stirrer speed), and gas-flow rate. Because such parameters also influence kL, the terms a and kL usually are combined, yielding kLa. That mass-transfer coefficient can be determined experimentally or mathematically.
Experimental Measurement of KLA
Several techniques for experimental measurement of kLa have been reported and reviewed (2–6). Three common techniques are the dynamic method, the oxygen-balance method, and sulfite oxidation. Among those approaches, the dynamic method is the most prevalent.
In a simplified, cell-free version of the dynamic method, a tank is stirred at a constant speed and sparged with air at a constant flow rate until the oxygen concentration in the liquid (CAL) becomes constant (Figure 2). At time zero (t0), the liquid is deoxygenated by cutting off air supply and starting the flow of nitrogen gas. Once the CAL value has declined sufficiently, scientists can restart the air supply and measure CAL recovery in the tank as a function of time. Such concentrations usually fall between 20% and 80%. Scientists also can repeat the procedure with different experimental conditions (e.g., stirring speed and air-flow rates).
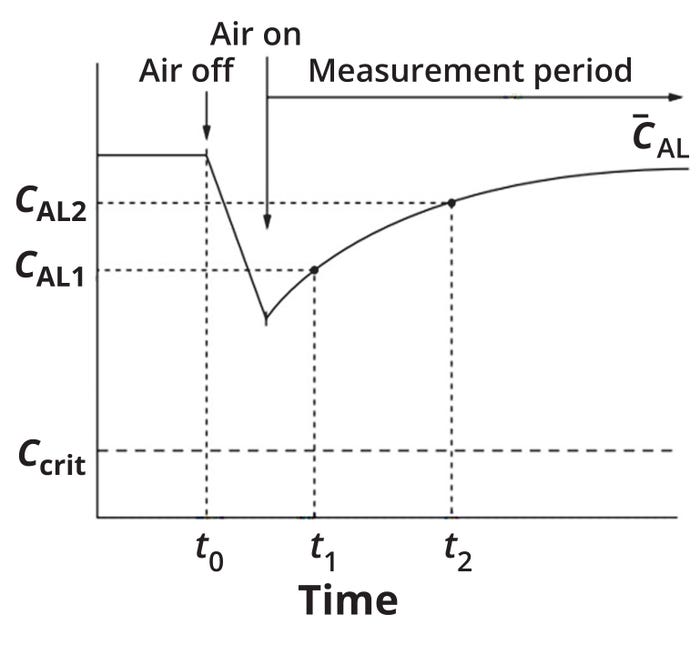
Figure 2: Graphical depiction of the dynamic method (simplified) for experimental measurement if the oxygen mass-transfer coefficient (kLa) (adapted from reference 7).
During the reoxygenation step, a bioreactor does not operate at a steady state. Thus, the rate of change in DO concentration equals the rate of oxygen transfer from the gas to the liquid:
Equation 3
dCAL/dt = kLa (C*AL – CAL)
That equation can be integrated to solve for kLa:
Equation 4
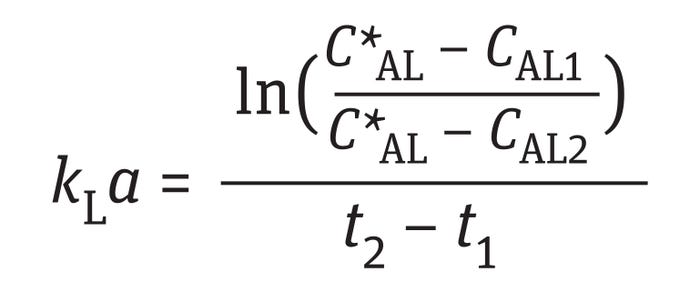
The dynamic method gives reasonable results for kLa if the following four assumptions are met (7).
The liquid phase is well mixed. This assumption ensures that kLa results will not depend on electrode location in a bioreactor and that DO concentration will be uniform. Such conditions can be relatively easy to achieve in small (laboratory-scale) bioreactors but might not occur in large-scale bioreactors, especially those with viscous broths, as is the case in many microbial fermentations.
The DO probe’s response time is much smaller than 1/kLa. The dynamic method relies on measurement of changes in DO concentration after a step change in bioreactor aeration conditions. If the probe response is slower than the actual increase in oxygen concentration, then the measured CAL value will reflect the response characteristics of the probe rather than the change in bioreactor oxygen concentration. Therefore, practitioners should check probe response time when using the dynamic method for determining kLa. This assumption holds true for most modern DO probes, which have fast response times in vigorously agitated, low-viscosity fluids. The probe response time is considered to be sufficiently fast when this condition is satisfied:
Equation 5
τP63.2% << (1/5) × kLa
where τP63.2% represents the probe-time constant (4, 5).
Measurement is performed at sufficiently high stirring speeds to eliminate the liquid boundary layer at the DO-probe surface. Especially during viscous fermentations, a liquid film can form at the probe surface. When that happens, the probe response will be slower than it would be otherwise, and DO readings will vary with stirrer speed. Thus, the presence of a liquid film on a probe surface is undesirable because it reduces the accuracy of the dynamic method (7).
Gas-phase dynamics can be ignored. This tenet refers to changes in gas dispersion over time, including gas composition and bubble size and number (7). In the dynamic method, a change in aeration conditions serves as a basis for evaluating kLa. Although inlet-gas flow rate and composition can be altered quickly, such adjustments do not necessarily result in an immediate change in the gas hold-up and composition of the bubbles dispersed in the liquid. Depending on the extent of gas recirculation, coalescence properties of the liquid, and fluid viscosity, some time must pass for a new gas hold-up and composition to be established. Because the driving force for oxygen transfer depends on the gas-phase oxygen concentration, and because kLa varies with gas hold-up (interfacial area), oxygen-transfer conditions and kLavalues are likely to change during measurement. Until a new steady state is established with the gas phase, the measured CAL value represents not only the kinetics of the oxygen transfer, but also the gas-phase dynamics in the bioreactor. Most issues relating to gas-phase dynamics arise in large-scale bioreactors. To test whether gas-phase dynamics will play a role in measurement, process engineers should compare kLa values determined by nitrogen stripping and degassing (switching off bioreactor air supply and allowing cells to consume oxygen to reduce DO concentration). If kLa values from both methods are similar, then gas-phase dynamics can be neglected (7).
Aeration Requirements in Cell-Culture Bioreactors
For aerobic-microbial fermentation and cell cultures, oxygen is a key nutrient in cellular metabolism. Oxygen requirements differ across cell lines and culture conditions. For Chinese hamster ovary (CHO) cell lines, the typical rate of oxygen consumption (or uptake) is between 2.0 × 10⁻¹⁰ mmol/(cell/h) and 8.0 × 10⁻¹⁰ mmol/(cell/h), whereas for various hybridoma and myeloma cell lines, the rate ranges between 2.0 × 10⁻¹⁰ mmol/(cell/h) and 4.0 × 10⁻¹⁰ mmol/(cell/h) (8–10). Although oxygen requirements for mammalian-cell cultures are several orders of magnitude lower than are those for microbial cultures, oxygenation remains a key challenge in cell-culture scale-up.
That is especially true for high-density (2.0 × 10⁷ cells/mL to 7.0 × 10⁷ cells/mL) fed-batch and perfusion cultures. In such cases, DO demand is high because oxygen solubility in aqueous solutions at ambient temperature and pressure is
<10 ppm. Cells consume such amounts of oxygen rather quickly in high-density cultures, so it must be replaced constantly by sparging air, oxygen-enriched air, or even pure oxygen. Keeping up with the oxygen demand of a high-density cell culture is not an easy task because the low solubility of oxygen guarantees that the concentration difference (C* – C) will be very small. Therefore, cell-culture bioreactors must be designed to provide optimum mass-transfer conditions.
The rate at which cells consume oxygen during culture determines the rate at which oxygen must be supplied from the gas phase to the liquid phase. Several factors influence oxygen demand, chiefly the cell line, culture growth phase (logarithmic growth or respiration, for example), and culture conditions (temperature, pH, and medium composition). In batch cultures, oxygen-uptake rates (OURs) depend significantly on two factors. The first is time: The number of cells changes with the batch growth phase, and the total OUR is proportional to the number of cells present. The second factor is that the rate of oxygen consumption per cell (the specific oxygen uptake rate, qO2) also varies with batch growth phases, often peaking during the late exponential growth phase. If qO2 (mmol/(cell/h)) represents specific oxygen uptake rate, and X denotes a bioreactor’s cell concentration (cells/mL), then the volumetric oxygen uptake rate (OUR) is given by this expression:
Equation 6
OUR = qO2 X
Because Equation 2 yields a formula for the OTR, the rate of change of oxygen concentration in a batch reactor can be written as Equation 7 or 8:
Equation 7
dC02/dt = OTR – OUR
Equation 8
dC02/dt = kLa (C*02 – C02) – qO2 X
Assuming bioreactor operation under pseudo–steady-state conditions, the OTR from gas bubbles equals qO2 (a cell’s rate of oxygen uptake). Hence, oxygen does not accumulate. Under such conditions, Equation 8 becomes
Equation 9
kLa (C*02 – C02) = qO2 X
That expression can determine the maximum achievable cell concentration for a given kLa value. The maximum concentration will result when the concentration driving force reaches its maximum value (e.g., when CO2 is set to zero). In such cases, cell concentration is high enough that all oxygen molecules are consumed as soon as they enter the liquid phase:
Equation 10
Xmax = kLa (C*02) qO2
If the Xmax value from Equation 10 is lower than the required cell concentration, then kLa must be improved — provided that oxygen-enriched air and pure oxygen are not available, as is true for many large-scale (<10,000 L) cell-culture bioreactors and fermentors. In addition, qO2 and C*O2 values are fixed for a given cell line and operating conditions. Hence, maximum attainable cell concentrations depend directly on kLa.
It is clear, then, why oxygen kLa is such an important bioreactor parameter — and why equipment vendors must painstakingly determine the range of kLa values that bioreactors of different designs and sizes (volumes) can support. For the same reason, bioreactor scale-up criteria often involve matching kLa or augmenting the chosen scale-up criterion with a matching OTR or gas-flow rate (vvm) at both equipment scales.
Equation 10 is a useful theoretical relationship. However, operating a bioreactor with a DO concentration of zero is not advisable because cell-specific oxygen uptake also depends on the medium’s oxygen concentration. Part 4 of this series on bioreactor scale-up will show that kLa values correlate well with stirrer power input and gas-flow rate (or gas velocity) and that some combination of those parameters usually provides sufficiently high kLa values for a given bioreactor.
Note also that an oxygen mass-transfer limitation — even if it is confined to a specific zone of a large-scale bioreactor — eventually creates a bottleneck in the maximum cell concentration (and thus in productivity) that can be achieved under the prevailing operating conditions. Such bottlenecks arise when a medium’s oxygen concentration is so low that cells consume the oxygen completely before it can be replenished. That problem would spread slowly across an entire bioreactor and limit the maximum achievable cell concentration. Indeed, culture media are fully saturated with oxygen only in the vicinity of the impellers (where shear is most intense), and even there, media oxygen concentrations are rather modest due to the effects of culture temperature and media composition. Cells are entrained by the liquid and circulate with it in the bioreactor while consuming oxygen at their characteristic rate (qO2). That action lowers the local oxygen concentration of the suspending liquid volume in which they are traveling. After coming close to the saturation value near the impellers, the oxygen concentration “sensed” by cells decreases as they travel across the bioreactor volume until the fluid element returns to the impeller zone. Hence, an upper “cap” on cell density exists for a given averaged, volumetric kLa prevailing in the bioreactor.
Equation 8 also can be solved with a slightly different set of initial conditions covering the scenario described above. The initial condition (t = 0) can be set to CO2 = C*O2 when the liquid leaves the impeller zone (high shear and higher kLa), and the final condition (t = tC) can be set to CO2 = Ccrit after completion of one circulation time because Ccrit would exist at the lowest observed/predicted kLa value. Substituting the initial-condition values and solving Equation 8 for X yields an expression for Xcrit, the maximum cell concentration value that a bioreactor can sustain at the operating conditions with the lowest observed
and/or predicted kLa:
Equation 11

Under such circumstances, if the cell concentration exceeded the Xcrit value, then part of the reactor volume would underperform, and other undesired consequences such as metabolic shifts might be triggered by oxygen scarcity (23).
Due to its association with cell density, kLa values are particularly useful in evaluating two common industrial scenarios: scaling within a platform and across different ones (11).
Bioreactor Scalability Within the Same Platform: Consider scaling a process from a 10-L to a 200-L or 1000-L bioreactor that has similar physiochemical and geometric features. In such cases, kLa (and by extension OTR) is held constant, and bioreactor hardware configurations (e.g., impellers and spargers) are altered to provide the necessary OTR, helping to achieve target cell density and metabolic profiles.
Technology Transfer Across Different Bioreactor Platforms: In such cases, kLa acts as a “gold standard,” with process parameters such as gas-flow rates and power inputs adjusted to achieve similar kLa values across scales and systems.
Oxygen transfer in a bioreactor is influenced by the presence of cells and other macromolecules. With time, cell, metabolite, and product (protein) concentrations vary, changing the physical properties of a culture medium, including its density, viscosity, and coalescence. Those changes influence the number and size of gas bubbles in a bioreactor, which affect culture kLa values over time. Figure 3 illustrates such interconnections for a batch microbial culture.
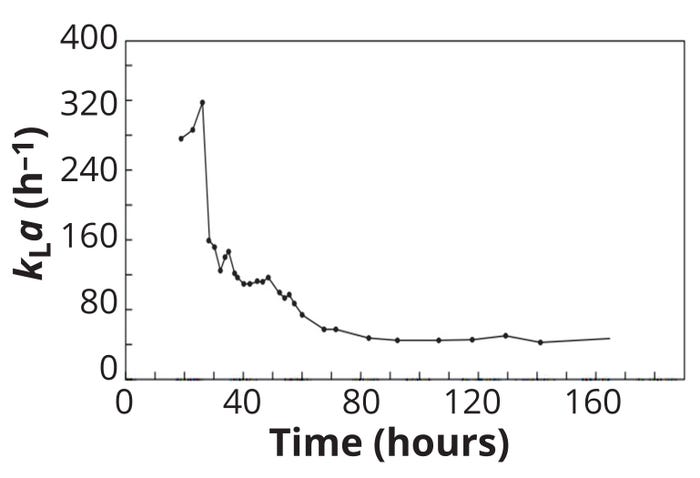
Figure 3: Variation in the oxygen masstransfer coefficient (kLa) during a 300-L batch fermentation of a streptomycete host (adapted from reference 7).
OUR Determination
OUR values are particularly useful for assessing the metabolic activity, health, and productivity of microbial and mammalian-cell cultures. Thus, such measurements are suitable for cell-line characterization (12, 13), design of fed-batch nutrient-feeding strategies (14, 16), and even estimation of viable-cell concentration (VCC) (17–19). Several well-documented approaches are available to determine OUR, OTR, and qO2 values experimentally, some of which I review below (20–22).
Generally, qO2 values are considered to be distinct for each cell type (or microorganism), and they are assumed to be constant during a particular phase of a batch culture. Figure 4 shows a typical evolution in the OUR, qO2, and DO profile for a batch culture. OURs increase during exponential growth phases, when substrate consumption reaches its highest levels over a culture. OURs subsequently decrease as metabolic activity starts to decline. Values for qO2 are high during early culture phases. DO concentrations follow a similar trend; however, changes in DO profiles are slower compared with those observed for the other two parameters. DO levels start to rise during the late stationary phase or at the onset of the death phase as oxygen demand declines.
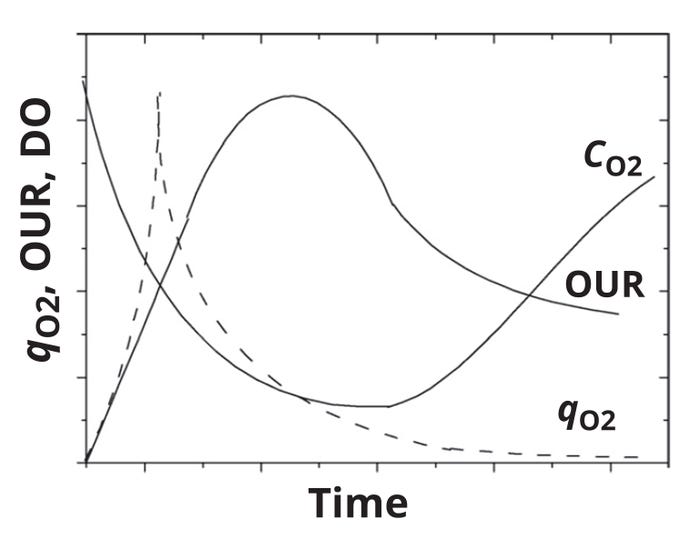
Figure 4: Variation with time in oxygenuptake rate (OUR), specific oxygenuptake rate (qO2) and dissolved-oxygen profiles (CO2) for a batch culture (adapted from reference 20).
Traditionally, oxygen transport from a gas to a liquid phase (OTR) and oxygen consumption by cells (OUR) were not described together. Rather, they were measured separately with different methods. Now, those parameters are measured in the same experiment.
Several methods have been developed to determine culture OUR experimentally. The main techniques are
• the mass-balance method, which involves measurement of oxygen concentrations in inlet and outlet gas phases
• the dynamic method
• use of DO-concentration profile data (if the OTR is known).
Gas Mass-Balance Method: Equations 7 and 8 give the mass balance of DO in a well-mixed bioreactor system. Required instruments include a gaseous-oxygen concentration analyzer, DO probe, and mass-flow controller. Together, those tools enable measurement of oxygen concentrations in the liquid and gas streams entering and leaving a bioreactor. Depending on the quality of instruments used, this technique provides accurate results and generally is deemed reliable.
The OTR part of Equation 8 can be determined using this expression:
Equation 12
OTR = (Q/V) (C02in – C02out)
The variable Q is the oxygen gas-flow rate, V is the volume of bioreactor, and C02in and C02out are the oxygen concentrations measured in the inlet and outlet gas streams, respectively. Based on that expression, OUR can be calculated using either of these two equations:
Equation 13
OUR = OTR – (dC02/dt)
Equation 14
OUR = (Q/V) (C02in – C02out) – (ΔC02/Δt)
It can be assumed that, for short periods, a bioreactor operates in a quasi-steady state. Thus, OUR (and a culture’s metabolic state) can be held constant. A DO probe is applied to measure the difference in DO concentration (ΔCO2) across a measurement period. Similarly, a sample is drawn from the bioreactor to determine its cell (or biomass) concentration. Then, qO2 values can be determined using Equation 6.
Dynamic Method: A modification of the dynamic method for determining kLa can be used to calculate both kLa and OUR. This method generally is performed during a culture’s exponential growth phase, when cells are growing and oxygen demand is high. First, bioreactor air supply is stopped for a few minutes, and the decrease in DO concentration is monitored using a probe. Then, air supply is restored to the same operating conditions as at the start of the experiment to achieve the same OTR. In such cases, the OTR is zero and Equation 8 becomes
Equation 15
ΔC02/Δt = –OUR = –q02 X
The OUR can be determined from the slope of the DO plot against time (Figure 5). Using the DO profile from after air supply is restored to the bioreactor, kLa also can be determined.
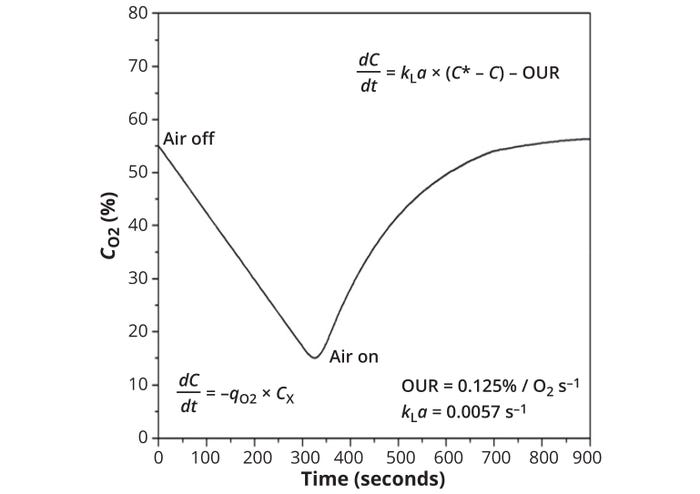
Figure 5: Simultaneous measurement of oxygen-uptake rate (OUR), specific oxygenuptake rate (qO2), and the oxygen mass-transfer coefficient (kLa) from the dissolved oxygen profile of a microbial fermentation (adapted from reference 20).
DO-Profile Method: This method is essentially the same as the dynamic method. If the OTR (and hence kLa) has been determined independently, then process engineers can use the slope of the DO-concentration profile over time to determine the accumulation term (dCO2/dt) of Equation 8. Because both the accumulation and OTR terms in that equation are known, OUR can be calculated using this expression:
Equation 16
OUR = q02 X =
kLa (C*02 – C02) – dC02/dt
Provided that biomass-concentration data are available, the value of qO2 also can be determined from the OUR.
Looking Ahead
In BPI’s October 2024 issue, part 4 of this series will extend the discussion about kLa to explore how different culture conditions and bioreactor operating parameters affect its value.
References
1 Mass Transfer. Coulson and Richardson’s Chemical Engineering. Eds., Chhabra RP, Shankar V. Seventh Edition, Volume 1B. Butterworth-Heinemann: Waltham, MA, 2017.
2 Gogate PR, Pandit AB. Survey of Measurement Techniques for Gas–Liquid Mass Transfer Coefficient in Bioreactors. Biochem. Eng. J. 4(1) 1999: 7–15; https://doi.org/10.1016/S1369-703X(99)00033-9.
3 Sobotka M, et al. Review of Methods for the Measurement of Oxygen Transfer in Microbial Systems. Ann. Rep. Ferm. Proc. 5, 1982: 127–210; http://dx.doi.org/10.1016/B978-0-12-040305-9.50009-1.
4 Van’t Riet K. Review of Measuring Methods and Results in Non-Viscous Gas–Liquid Mass Transfer in Stirred Vessels. Ind. Eng. Chem. Process Des. Dev. 18(3) 1979: 357–364; https://doi.org/10.1021/i260071a001.
5 Linek V, Vacek V, Beneš P. A Critical Review and Experimental Verification of the Correct Use of the Dynamic Method for the Determination of Oxygen Transfer in Aerated Agitated Vessels to Water, Electrolyte Solutions, and Viscous Liquids. Chem. Eng. J. 34(1) 1987: 11–34; https://doi.org/10.1016/0300-9467(87)85003-7.
6 Tribe LA, Briens CL, Margaritis A. Determination of the Volumetric Mass Transfer Coefficient (kLa) Using the Dynamic “Gas out–Gas in” Method: Analysis of Errors Caused by Dissolved Oxygen Probes. Biotechnol. Bioeng. 46(4) 1995: 388–392; https://doi.org/10.1002/bit.260460412.
7 Doran PM. Chapter 10: Mass Transfer. Bioprocess Engineering Principles. Second edition. Elsevier: London, UK, 2013: 379–444.
8 Ducommun P, et al. A New Method for On-Line Measurement of the Volumetric Oxygen Uptake Rate in Membrane Aerated Animal Cell Cultures. J. Biotechnol. 78(2) 2000: 139–147; https://doi.org/10.1016/s0168-1656(99)00237-0.
9 Aunins JG, Henzler H-J. Aeration in Cell Culture Bioreactors. Biotechnology, Volume 3: Bioprocessing. Eds., Rehm H-J,et al. Wiley-VCH: Weinheim, Germany, 1993.
10 Xiu Z-L, Deckwer W-D, Zeng A-P. Estimation of Rates of Oxygen Uptake and Carbon Dioxide Evolution of Animal Cell Culture Using Material and Energy Balances. Cytotechnology 29(3) 1999: 159–166; https://doi.org/10.1023/A:1008004618163.
11 7 Factors That Affect Oxygen Transfer to Cells in Bioreactors. Cytiva, 2024; https://www.cytivalifesciences.com/en/us/solutions/bioprocessing/knowledge-center/7-factors-that-affect-oxygen-transfer-to-cells-in-bioreactors.
12 Huang Y-M, et al. Maximizing Productivity of CHO Cell-Based Fed-Batch Culture Using Chemically Defined Media Conditions and Typical Manufacturing Equipment. Biotechnol. Prog. 26(5) 2010: 1400–1410; https://doi.org/10.1002/btpr.436.
13 Seidel S, et al. Oxygen Mass Transfer in Biopharmaceutical Processes: Numerical and Experimental Approaches. Chemie Ingen. Technik 93(1–2) 2021: 42–61; https://doi.org/10.1002/cite.202000179.
14 Goldrick S, et al. On-Line Control of Glucose Concentration in High-Yielding Mammalian Cell Cultures Enabled Through Oxygen Transfer Rate Measurements. Biotechnol. J. 13(4) 2018: e1700607; https://doi.org/10.1002/biot.201700607.
15 Zhou W, et al. Fed-Batch Culture of Recombinant NS0 Myeloma Cells with High Monoclonal Antibody Production. Biotechnol. Bioeng. 55(5) 1997: 783–792; https://doi.org/10.1002/(SICI)1097-0290(19970905)55:5%3C783::AID-BIT8%3E3.0.CO;2-7.
16 Kamen AA, et al. On-Line Monitoring of Respiration in Recombinant-Baculovirus Infected and Uninfected Insect Cell Bioreactor Cultures. Biotechnol. Bioeng. 50(1) 1996: 36–48; https://doi.org/10.1002/%28SCI%291097-0290%2819960405%2950%3A1%3C36%3A%3AAID-BIT5%3E3.0.CO%3B2-2.
17 Feng Q, et al. Application of “Oxygen Uptake Rate-Amino Acids” Associated Mode in Controlled-Fed Perfusion Culture. J. Biotechnol. 122(4) 2006: 422–430; https://doi.org/10.1016/j.jbiotec.2005.09.017.
18 Gálvez J, et al. Optimization of HEK-293S Cell Cultures for the Production of Adenoviral Vectors in Bioreactors Using On-Line OUR Measurements. J. Biotechnol. 157(1) 2012: 214–222; https://doi.org/10.1016/j.jbiotec.2011.11.007.
19 Higareda AE, Possani LD, Ramírez OT. The Use of Culture Redox Potential and Oxygen Uptake Rate for Assessing Glucose and Glutamine Depletion in Hybridoma Cultures. Biotechnol. Bioeng. 56(5) 1997: 555–563; https://doi.org/10.1002/(sici)1097-0290(19971205)56:5%3C555::aid-bit9%3E3.0.co;2-h.
20 Garcia-Ochoa F, et al. Oxygen Uptake Rate in Microbial Processes: An Overview. Biochem. Eng. J. 49(3) 2010: 289–307; https://doi.org/10.1016/j.bej.2010.01.011.
21 Ruffieux P-A, von Stockar U, Marison IW. Measurement of Volumetric (OUR) and Determination of Specific (qO2) Oxygen Uptake Rates in Animal Cell Cultures. J. Biotechnol. 63(2) 1998; 85–95; https://doi.org/10.1016/s0168-1656(98)00046-7.
22 Martínez-Monge I, et al. New Developments in Online OUR Monitoring and Its Application to Animal Cell Cultures. Appl. Microbiol. Biotechnol. 103(17) 2019: 6903–6917; https://doi.org/10.1007/s00253-019-09989-4.
23 Panunzi A, et al. Industrial Case-Study Based Computational Fluid Dynamic (CFD) Modeling of Stirred and Aerated Bioreactors. ACS Omega 7(29) 2022: 25152–25163; https://doi.org/10.1021/acsomega.2c01886.
Further Reading
Kane, J. Measuring kLa for Better Bioreactor Performance. BioProcess Int. 10(3) 2012: 46–49; https://www.bioprocessintl.com/bioreactors/measuring-kla-for-better-bioreactor-performance.
Garcia-Ochoa F, Gomez E. Bioreactor Scale-Up and Oxygen Transfer Rate in Microbial Processes: An Overview. Biotechnol. Adv. 27(2) 2009: 153–176; https://doi.org/10.1016/j.biotechadv.2008.10.006.
Hu W-S. Oxygen Transfer in Bioreactors. Engineering Principles in Biotechnology. John Wiley & Sons: Hoboken, NJ, 2017: 214–264; https://doi.org/10.1002/9781119159056.
Suresh S, Srivastava VC, Mishra IM. Techniques for Oxygen Transfer Measurement in Bioreactors: A Review. J. Chem. Technol. Biotechnol. 84(8) 2009: 1091–1103; https://doi.org/10.1002/jctb.2154.
Shin W-S, et al. Application of Scale-Up Criterion of Constant Oxygen Mass Transfer Coefficient (kLa) for Production of Itaconic Acid in a 50 L Pilot-Scale Fermenter by Fungal Cells of Aspergillus terreus. J. Microbiol. Biotechnol. 23(10) 2013: 1445–1453; https://doi.org/10.4014/jmb.1307.07084.
Klöckner W, et al. Correlation Between Mass Transfer Coefficient kLa and Relevant Operating Parameters in Cylindrical Disposable Shaken Bioreactors on a Bench-to-Pilot Scale. J. Biol. Eng. 7, 2013: 28; https://doi.org/10.1186/1754-1611-7-28.
Eyer K, Oeggerli A, Heinzle E. On-Line Gas Analysis in Animal Cell Cultivation: II. Methods for Oxygen Uptake Rate Estimation and Its Application to Controlled Feeding of Glutamine. Biotechnol. Bioeng. 45(1) 1995: 54–62; https://doi.org/10.1002/bit.260450108.
Goudar CT, Piret JM, Konstantinov KB. Estimating Cell Specific Oxygen Uptake and Carbon Dioxide Production Rates for Mammalian Cells in Perfusion Culture. Biotechnol. Prog. 27(5) 2011: 1347–1357; https://doi.org/10.1002/btpr.646.
Pappenreiter M, et al. Oxygen Uptake Rate Soft-Sensing via Dynamic kLa Computation: Cell Volume and Metabolic Transition Prediction in Mammalian Bioprocesses. Front. Bioeng. Biotechnol. 7, 2019: 195; https://doi.org/10.3389/fbioe.2019.00195.
A seasoned industry professional with a PhD in chemical and biological engineering from the University of British Columbia (Vancouver, Canada) and expertise in embryonic stem cell bioengineering, upstream biological process development, and fed-batch bioreactors, Muhammad Arshad Chaudhry works as associate director of process and formulation development at Mural Oncology, 852 Winter Street, Waltham, MA 02451; [email protected].
You May Also Like
