T-Cell Suspension Culture in a 24-Well MicrobioreactorT-Cell Suspension Culture in a 24-Well Microbioreactor
Cell therapy promises revolutionary new therapeutic treatments for cancer and other serious diseases and injuries. For example, T-cell therapy response rates of >50% and durable complete response rates of 20% have been reported in patients with metastatic melanoma who had failed other therapies (1). In another example, sustained remissions of up to a year were achieved among a small group of advanced chronic lymphocytic leukemia patients upon treatment with autologous T-cells expressing an anti-CD19 chimeric antigen receptor (2). Numerous other examples use cell therapy for cardiac repair, bone or cartilage regeneration, organ repair (pancreas or liver), neurological repair (spinal cord or brain injury), correcting genetic defects, and treating infectious diseases such as human immunodeficiency virus (HIV) (3).
Such therapies involve the ex vivo expansion and manipulation of different cell types including stem cells and T-cells. Because many are still in early clinical research phases, often their manufacturing processes are based on research-scale methods using static flasks and bags, with very limited process monitoring and control. Although such methods have been manageable for enabling phase 1 and 2 clinical trials treating a small number of patients per month, the need to produce tens of billions of cells per subject significantly diminishes the practicality of static processes. That’s especially true when you take into consideration the future prospects of a manufacturing facility that will provide treatments for hundreds of patients at any given time. Static cell-culture processes often require a vast array of small-volume vessels, which are both labor intensive and present risks in aseptic fluid handling. Furthermore, static systems are prone to mass-transfer limitations due to their heterogeneity. They do not offer the capacity to easily monitor and control physical system parameters such as dissolved oxygen (DO), pH, and temperature — variables that almost certainly influence cell culture expansion and the critical quality attributes of a cellular product.
PRODUCT FOCUS: CELL THERAPIES
PROCESS FOCUS: PRODUCTION
WHO SHOULD READ: PRODUCT AND PROCESS DEVELOPMENT, MANUFACTURING
KEYWORDS: VALIDATION, QUALIFICATION, SCALE-UP, PROCESS MONITORING, PROCESS CONTROL, PROCESS OPTIMIZATION, SCALE-DOWN, BIOREACTORS
LEVEL: INTERMEDIATE
The current state of cell therapy manufacturing is similar to that of therapeutic protein manufacturing of 30 years ago. That industry also commonly relied on static culture systems and lacked bioprocess know-how, well-defined raw materials, sensitive analytical methods, and sophisticated equipment that would permit precise control over the process and therapeutic product. Over decades, the therapeutic protein manufacturing industry evolved, particularly with advances eliminating the need for static culture and instead permitting manufacture of product in suspension culture using fed-batch or perfusion stirred-tank bioreactors. The body of knowledge around bioreactor scaling issues, media composition, and feed strategy has grown considerably over the past few decades, allowing for development of more productive and efficient cell culture manufacturing processes. In addition, improved monitoring and process control capabilities of bioreactors have continually helped to progress the development of increasingly robust and reproducible processes. Finally, the introduction of disposable bioreactors and associated components has reduced costs without compromising aseptic processing and final-product quality.
The cell therapy industry faces unique challenges unlike those in protein manufacturing. Nonetheless, many tools originally developed to support therapeutic protein development and manufacturing can be adapted to cell therapy applications. One such technology is the MRT-24 microbioreactor from Pall Corporation, a 24-well bioreactor with the capability for agitated suspension culture and continuous monitoring and control of pH, temperature, and DO in each individual well (Figure 1). The small operating volume (3–7 mL) is well suited to cell therapy applications, in which patient-specific starting cells are in short supply and culture media may contain very expensive growth factors. Finally, the system already has a successful history as a scale-down model for culturing mammalian cells in stirred-tank bioreactors.
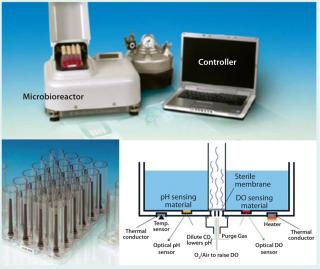
Figure 1: ()
Because that microbioreactor system had never before been used in a cell therapy application, our laboratory set out to evaluate its usefulness as a process development tool supporting efforts to develop and optimize suspension cell culture for manufacturing therapeutic T-cells. As a first step, we qualified the equipment for use by demonstrating both its ability to accurately measure and control process parameters and its reproducibility in cell growth. Then we evaluated the system for its ability to serve as a scale-down model compared with a 3-L stirred-tank bioreactor.
Materials and Methods
To validate the precision of on-line DO readings, a range of known oxygen concentrations (from 0 to 100%) were delivered by purging to each bioreactor well with a rotometer-governed blend of oxygen, carbon dioxide, and nitrogen. Using the onboard MRT-24 controls, we set the purge flow rate at 5.0 sccm, the platform agitation at 800 rpm, and the temperature at 37.0 °C. Each well received 5.0 mL of a cell culture medium based on the familiar Roswell Park Memorial Institute (RPMI) medium. For comparative analysis, we took off-line DO readings with a GEM 3000 blood-gas analyzer from Instrumentation Laboratory. That involved removing samples from the microbioreactor using a syringe and needle to puncture the cap, then introducing them to the gas analyzer as rapidly as possible in hopes of minimizing changes in the dissolved-gas concentration.
For qualification of on-line pH readings, we performed a retrospective analysis by taking samples during the course of several T-cell culture experiments. We measured the off-line pH using the GEM 3000 blood-gas analyzer and compared the resulting values with the MRT-24 on-line readings. We’d set the temperature, agitation, and purge rates at the same values as in our dissolved oxygen qualification experiments.
We qualified the cell culture growth performance capabilities of the MRT-24 system using a polyclonal antigen-specific CD8 T-cell line. The T-cells were stimulated under static conditions using irradiated PBMC feeder cells for four days before we transferred them to suspension culture in the microbioreactor. In experiments to assess well-to-well reproducibility, we inoculated all 24 wells identically with a pH set point of 7.0, a DO setting of 25% air saturation, a temperature of 37 °C, and an agitation rate of 500 rpm. When comparing the MRT-24 system with a 3-L stirred-tank reactor, we inoculated both from the same starting culture and operated them under similar conditions.
Results and Conclusions
DO Qualification: From preliminary experiments using a nitrogen purge, we observed that with a constant purge-gas flow rate of 1.0–2.0
sccm it was impossible to drive the DO reading to 0% in any of the wells. In fact, the lowest DO levels we achieved were 10–15%. Presumably that was due to oxygen leaking into the system through the bottom seal or elsewhere in the gas-delivery system. However, as we increased the purge-gas flow rate to >3.0 sccm, the system reached a 0% DO reading in all wells. So we chose a standard operating condition of 5.0 sccm for purge gas.
Next we wanted to confirm that the microbioreactor would be capable of maintaining integrity under closed conditions. First, to demonstrate how the system would respond when purposefully breached, we showed that under low-oxygen conditions it would rapidly reabsorb oxygen when exposed to open atmosphere. For example, after 800-rpm agitation under a pure nitrogen purge (with all wells reading 0% oxygen), when agitation was stopped and a well cap was removed for 30 seconds (and then replaced), the DO reading increased by 15–20% almost immediately. When we conducted the same experiment at a DO setting of about 50%, the reading increased by about 5% — not a surprising result when you consider the reduced driving force for oxygen mass transfer.
We then demonstrated that the closed system could maintain its integrity when left sealed and closed. Under the same starting conditions — 800 rpm and pure nitrogen purge with all wells uniformly reading 0% DO — the capped plate was unclamped from its platform and placed on the laboratory bench for 120 seconds. After the plate was reclamped and returned to normal agitated operating conditions, all wells had increased their dissolved oxygen levels by only 2–3%. That indicates that this microbioreactor could generally maintain a closed leak-tight system. This feature is important because it is sometimes desirable to maintain certain cell types under hypoxic conditions or otherwise ensure that conditions remain constant while the microbioreactor is manipulated.
Next, we evaluated the precision and accuracy of oxygen readings using a rotometer manifold that delivered a gas mixture of known oxygen composition (0–100%) by purging. We allowed the system to achieve a steady-state operation condition over a period of at least 30 minutes. In an effort to identify performance changes that might occur over time, we performed this evaluation over two weeks. At each setting, we recorded the on-line DO in each well and calculated the average and standard deviation. In all cases, the well-to-well deviation was <3%. Table 1 provides example data collected from each well at a DO setting of 11.2%.
Table 1: An example of the instantaneous on-line dissolved oxygen (DO) reading reported in each microbioreactor well; theoretical oxygen concentration is 11.2%.
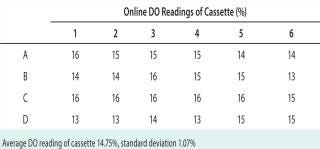
Table 1: An example of the instantaneous on-line dissolved oxygen (DO) reading reported in each microbioreactor well; theoretical oxygen concentration is 11.2%. ()
Table 2: Means and standard deviations from Figure 4

Table 2: Means and standard deviations from Figure 4 ()
Figure 2 compares the known DO concentration delivered to the microbioreactor with the average on-line DO reading in each well. In general, there was excellent agreement between the on-line DO reading and the theoretical value of the known DO. In addition, we also analyzed off-line samples with the blood-gas analyzer. Despite our efforts to place samples on the analyzer as rapidly as possible and minimize their atmospheric exposure, reabsorption of ambient oxygen into the samples produced artificially high DO measurements (a more prominent effect at lower DO conditions). These results demonstrated acceptable accuracy and precision of the DO readings. In fact, the on-line instrument readings should be viewed with greater confidence than off-line samples tested with the blood-gas analyzer.
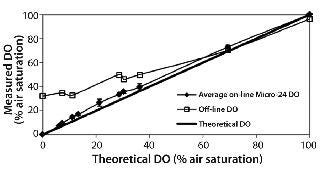
Figure 2: ()
pH Qualification: During a three-month period, we performed several cell culture experiments using T-cells in an RPMI-based medium. At intervals, we pulled samples for off-line measurement, including for pH using the GEM analyzer. Whenever we pulled a sample, we also recorded the instantaneous on-line pH measurement for that particular well. From a retrospective analysis, Figure 3 compares on-line and off-line pH measurements. The 0.98 slope shows excellent agreement between those measurements at the given pH values.
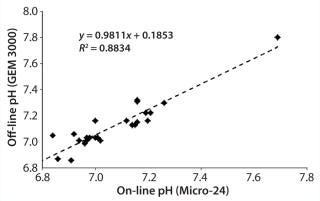
Figure 3: ()
Cell Culture Qualification: We initiated a CD8 T-cell culture in the microbioreactor by inoculating and operating each well under identical conditions. As Figure 4 shows, cells successfully expanded over a 13-day period with a reasonably comparable cell density in each well (day 13 mean of 6.75 million cells/mL, standard deviation of 1.2 million cells/mL). The total cell number expanded an average of 1,850-fold and exhibited exponential growth through day 11, with an average doubling time of 24.2 hours. Those results were consistent with what we observed in larger-scale bioreactors.
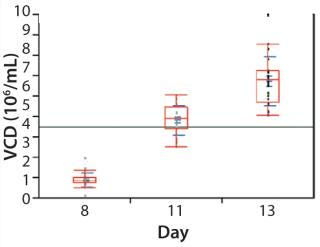
Figure 4: ()
Figure 5 illustrates a second cell culture experiment, in which we inoculated a 3-L stirred-tank bioreactor and the MRT-24 system using the same seed culture. Here we operated the microbioreactor in a matrix with three pH set points (6.8, 7.0, and 7.1) and two DO set points (10% and 40%). Observed cell densities and fold-expansion values were reasonably similar in all cases, with data suggesting that perhaps the pH 7.0 condition might be best. Occasionally we sampled the cultures for their glucose and lactic-acid concentrations (Figure 6), with data demonstrating that glucose was becoming depleted. Those results suggest that future experiments should be aimed at optimizing the media composition and feed strategy. More important to the purposes of equipment qualification, the information provides confidence in the scalability of results from the microbioreactor to the stirred-tank bioreactor.
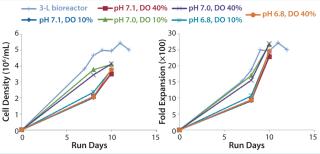
Figure 5: ()
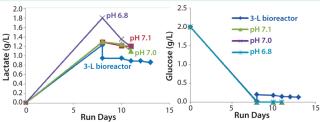
Figure 6: ()
A Process Development Tool
Our instrument qualification results show that the MRT-24 microbioreactor can be used as an accurate, high-throughput experimental system that properly represents production-scale systems. The system offers a sufficient degree of accuracy and precision in its on-line DO and pH measurements and demonstrates a reasonable degree of well-to-well reproducibility. Furthermore, cell growth rates and metabolic profiles are similar to what we observed with a 3-L stirred-tank bioreactor. Our results suggest that the MRT-24 system is suitable as a scale-down model for high-throughput evaluation of operating parameters for therapeutic cell culture.
About the Author
Author Details
Kenny Choi is a research technician; corresponding author Jason N. Carstens, PhD, is director of process development; and Shelly Heimfeld, PhD, is scientific director of the cellular therapy and cell processing facilities — all in the clinical research division at Fred Hutchinson Cancer Research Center, 1100 Fairview Avenue North, MS D5-100, Seattle, WA 98109-1024; 1-206-667-6131; [email protected].
REFERENCES
1.) Rosenberg, SA. 2011. Durable Complete Response in Heavily Pretreated Patients with Metastatic Melanoma Using T-Cell Transfer Immunotherapy. Clin. Cancer Res. 17:4550-4557.
2.) June, CH 2011. Chimeric Antigen Receptor-Modified T Cells in Chronic Lymphoid Leukemia. NEJM 365:725-733.
3.) Trounson, A 2011. Clinical Trials for Stem Cell Therapies. BMC Medicine 9:52.
You May Also Like


