A Case for Biopharmaceutical Operations in Low-Cost Countries to Maximize Return on InvestmentA Case for Biopharmaceutical Operations in Low-Cost Countries to Maximize Return on Investment
February 6, 2015
https://bioprocessintl.com/wp-content/uploads/2015/02/022015_Jain.mp3
A company’s success is associated with its growth. An expanding company hires more employees (full-time equivalents, FTEs) to support its commercial products, to develop new products, and to provide administrative services. As it grows, an organization can become more complex and its operations less efficient. Analysis of 2013 financial data showed that revenue of US biopharmaceutical companies increases with a growing number of FTEs at a slower rate than does cost (1). That study assumed that all US biopharmaceutical companies have similar organizational and operational structure, regardless of their size and product characteristics (e.g., primarily biologics, primarily small molecules, or diversified product portfolio). Relationships of revenue and cost with number of FTEs for the biopharmaceutical industry overall were determined as in Equations 1 and 2.
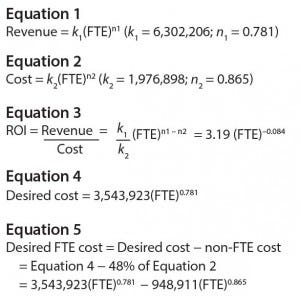
Equations
Return on investment (ROI) is calculated as revenue/cost (Equation 3). So it decreases with the number of FTEs, as shown in Figure 1 for biopharmaceutical companies within the range of 1,000 to 100,000 employees. However, maintaining ROI despite size increases is desirable (Figure 1). ROI can be maintained using either of the following two strategies:
Revenue increases at the same rate as cost (revenue ∝(FTE)0.865). Because revenue is driven by market forces, this strategy may not be applicable for all biopharmaceutical companies.
Cost increases at the same rate as revenue (cost ∝ (FTE)0.781). Figure 2 shows the desired cost and the number of FTEs that are required to achieve constant ROI, and Equation 4 shows the relationship between desired cost and the number of FTEs.
Cost (total cost) consists of FTE cost (salary and benefits) and non-FTE cost (e.g., facilities, machinery, and utilities). In healthcare services, FTE cost as a percentage of operating expenses has been reported as 52% (2). Although healthcare services include medical delivery services, this article applies the same distribution to the biopharmaceutical industry.
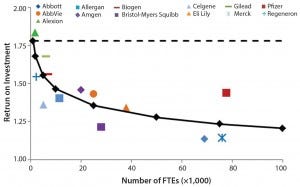
Figure 1: ROI and FTE for biopharmaceutical companies; graphs shows ROI profile as per Equation 3 (solid black line), desired ROI (dashed black line), and historical (2013) data.
According to the second strategy above, desired cost increases with the number of FTEs at a slower rate (Equation 4) than does the “industry standard” cost (Equation 2). A company can achieve a desired cost by decreasing the number of FTEs through operational efficiency measures. Alternatively, operations in low-cost regions may be leveraged to achieve a desired cost because such regions have lower unit FTE cost, which results in lower FTE cost. Although non-FTE costs can also decrease in low-cost regions, non-FTE cost has been assumed to remain constant so that only FTE cost changes. In Figure 2, “industry standard” FTE cost is 52% of Equation 2 and non-FTE cost is 48% of Equation 2. Assuming constant non-FTE cost, desired FTE cost is calculated according to Equation 5.
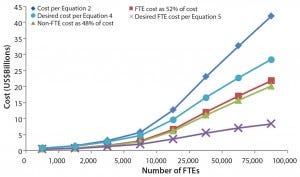
Figure 2: Cost and FTE for biopharmaceutical companies
To achieve desired FTE cost through lower unit FTE cost, salary data of key life sciences companies in the United States, Canada, Western European countries, and India were compared (3). Average life sciences salaries of each country’s employees were normalized to an average salary reported for US employees (Figure 3). That normalization was performed under the assumption that the US salary represents the average salary for all US biopharmaceutical companies, regardless of company size. This assumption is expected to be valid for small companies, because they typically have the majority or all of their operations in the United States. But larger biopharmaceutical companies have global operations, so their average salary might not be accurately represented by the US salary value.
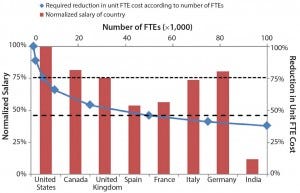
Figure 3: Normalized salary of some countries and required reduction in unit cost according to the number of employees; the horizontal lines depict the required reduction in unit FTE cost for 5,000 (small dashes) and 50,000 (large dash) FTEs.
Although average salary data reported in a salary survey (3) includes academia, industry, and government jobs, the study herein assumes that the normalized salary from the survey will also represent the normalized salary for industry jobs alone. It also assumes that employee productivity and quality of the output is the same among the countries included in the survey.
The “required” reduction in unit FTE cost was determined as the ratio of (desired FTE cost)/(industry standard FTE cost) = (Equation 5/ 52% of Equation 2), which was overlaid on the normalized unit FTE cost (normalized average salary) for different countries (Figure 3). For a country to be considered as having achieved desired FTE cost, the normalized salary for that country should be lower than the required reduction in unit FTE cost. The takeaways from Figure 3 are as follows:
For companies with ≤5,000 FTEs, the required reduction in unit FTE cost is low, which can be achieved by companies located in the United States, Canada, western Europe, and India.
For companies with 5,000–50,000 FTEs, selected western European countries and India can provide the required reduction in unit FTE cost.
For companies with >50,000 FTEs, India is the only location that achieves the required reduction in unit FTE cost.
Because India is the most versatile option for reducing FTE cost, analysts for the study here determined the fraction of FTEs that will need to be in India (and similar countries) to achieve the required reduction in unit FTE cost. Figure 4 overlays the required reduction in unit FTE cost (for different FTEs) with the normalized average salary if different percentages (0–100%) of FTEs are based in India (and similar countries), with the rest (100–0%) of that percentage being in the United States.
For companies with ≤5,000 FTEs, 0% to ~30% of FTEs are recommended to be working in India (and similar countries) for maintaining ROI.
For companies with 5,000– 50,000 FTEs, ~30% to ~60% of FTEs are recommended to be working in India (and similar countries) for maintaining ROI.
For companies with >50,000 FTEs, >60% of those FTEs are recommended to be working in India (and similar countries) for maintaining ROI. This analysis leads to a recommendation that companies with 100,000 FTEs have 70% FTEs in India (and similar countries).
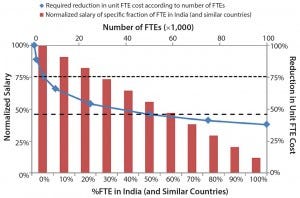
Figure 4: Required reduction in unit FTE cost according to the number of employees; normalized salaries and percentages (0–100%) of FTE in India (and similar countries) with rest of those percentages (100–0%) in the United States; the dashed horizontal lines depict the required reduction in unit FTE cost for 50,000 (small dash) and 50,000 (large dash) FTEs.
Relocation of operations to low-cost countries such as India, China, South Korea, and Singapore has been undertaken by many large biopharmaceutical companies (4, 5). Those countries have large scientific talent pools, extensive experience of high-technology industries, and low cost of operations (6). Industries such as home appliances, textiles, automobiles, electronics, and information technology have had sizeable operations in low- cost countries for several decades. Relocations of biopharmaceutical companies to such locations have been relatively recent by comparison.
Although outside the scope of this article, relocation of operations to low- cost countries also allows companies to penetrate such fast-growing markets to further increase revenue. Therefore, SMC recommends that all biopharmaceutical companies, especially large biopharmaceutical organizations, evaluate their ROI and consider establishing a significant operational base in low-cost countries. The specific percentage of FTEs to be placed in low-cost countries must be determined case by case, with considerations of factors such as potential decrease in non-FTE cost, increase in revenue in new markets, and talent availability. The analysis presented here provides a framework for companies to perform their individual studies.
References
1 Jain S. Revenue Per FTE and Cost Per FTE: Metrics of Operational Efficiency and Performance. BioProcess Int. 12(11) 2014: 22–25.
2 Salaries As a Percentage of Operating Expense. Society for Human Resource Management: Alexandria, VA, 1 November 2008; www.shrm.org/research/articles/ 0articles/pages/metricofthemonthsalaries aspercentageofoperatingexpense.aspx.
3 Palmer C, Yandell K. 2013 Life Sciences Salary Survey. The Scientist, 1 November 2013; www.the-scientist.com/?articles.view/articleNo/38033/ title/2013-Life-Sciences-Salary-Survey.
4 Howard L. Pfizer Layoffs Seen As Strategic. The Day, 2 February 2011; www. theday.com/article/20110202/ biz02/302029902.
5 Staton T. Novartis Slashing Thousands More Jobs in Global Reorganization, Shifting Many to India. FiercePharma, 2 February 2014; www.fiercepharma.com/story/nzz- novartis-will-cut-or-move-4000-jobs-many- india/2014-02-02.
6 The Changing Dynamics of Pharma Outsourcing in Asia: Are You Readjusting Your Sights? Pricewaterhouse Coopers: Ahmedabad, Gujarat, India, 2008; www.pwc. in/assets/pdfs/pharma/The_changing_ dynamics_of_pharma_outsourcing_in_Asia. pdf.
Siddhartha Jain is a managing partner at SMC Consulting Group LLC, 404 Brunswick Drive, Troy, NY 12180; sid.jain@ smcstrategy.com; www.smcstrategy.com
You May Also Like


