Enhanced Galactosylation of Monoclonal Antibodies: Using Medium Supplements and Precursors of UDP-Galactose, Part 1Enhanced Galactosylation of Monoclonal Antibodies: Using Medium Supplements and Precursors of UDP-Galactose, Part 1
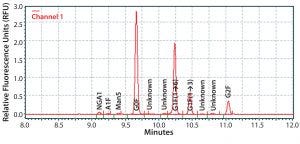
Figure 1: Electropherogram of IgG MAb 1 glycans using the HTP method
The biopharmaceutical industry needs better understanding of how monoclonal antibody (MAb) glycosylation is influenced by components in cultivation media — and it needs methods to exert some control over the structure of MAb glycans. That structure can affect MAb function. Thus, a high-throughput (HTP) assay is needed for characterizing MAb glycosylation so that developers can observe the effects of cultivation conditions on MAb glycosylation rapidly, with a goal of producing MAbs that have a desired glycan structure. The method also must be capable of testing a large number of samples in a reasonable amount of time. We established our HTP assay using 96-well plates and negatively charged magnetic beads based on a method published by Varadi et al. (1). Advantages of this assay include a substantial reduction in sample preparation time, a one-pot strategy for all reactions, and the replacement of toxic NaCNBH3 with 2-methylpyridine borane complex as the reducing agent (2, 3).
In the Varadi team’s method, the negatively charged magnetic beads’ ability to adsorb glycans in the presence of acetonitrile and desorb in water facilitated both the separation of glycans from proteins and the clean-up of those glycans after labeling with 1-aminopyrene-3,6,8-trisulfonic acid (APTS) (1). Bead-based separations eliminate lengthy protein precipitation, centrifugation, sample transfer, and sample drying steps during glycan isolation (4, 5). They also simplify postlabeling clean-up of reaction mixtures by eliminating a column chromatography step. Separations take minutes to complete. Varadi and colleagues demonstrated that shorter incubations of one or two hours at 50 °C (instead of 16–24 hours at 37 °C) were sufficient for both PNGase F treatment and glycan labeling with APTS. The team also showed that elevated temperature did not cause appreciable loss of heat- and acid-labile sialic acid residues.
We used the HTP assay to examine a method for controlling MAb glycosylation by supplementing the culture medium with glycan precursors. Fed-batch cultures of Chinese hamster ovary (CHO) cells were supplemented with commercially obtained medium supplements that are designed to enhance galactosylation and other mixtures containing precursors with a cofactor for synthesis of uridine diphosphogalactose (UDP-gal) to modulate galactosylation of MAb glycans. UDP-gal donates galactose to the glycan moiety (6, 7). Changes to galactose, manganese, and uridine concentrations in the medium controlled glycosylation.
Gramer et al. (8), Hills et al. (9), Liu (10), Grainger and James (11), and St. Amand et al. (12) all have shown that glycosylation of two MAbs is affected by adding a mixture of galactose, manganese chloride (MnCl2), and uridine to cell culture medium. Fan et al. (13) showed that low galactosylation is limited by low UDP-galactose synthesis, which in turn is linked to low concentrations of glucose and glutamine in culture media. Adding 20 mM galactose to culture medium increased the galactose content of IgG glycans from 14% to 25% (14).
Other cultivation parameters affect protein galactosylation:
high concentrations of asparagine-reduced galactosylation (15)
low glucose levels leading to alterations in nucleotide diphosphate sugar concentrations in CHO cells and increasing the amounts of GlcNAc and galactose in MAbs (13)
both galactosylation and sialylation affected by pH and dissolved oxygen but not by osmolality (16).
Modulation of MAb glycosylation remains in part an empirical endeavor. Through the studies described herein, we examined the effects of medium supplements on MAb glycosylation — specifically galactosylation. Each addition enhanced that process, but the extent and specific effects differed among supplements and cell lines.
Experimental: Establishing an HTP Assay
Glycan Isolation and Labeling: Glycans were removed from MAb proteins with PNGase F (New England BioLabs). Reactions took place in 96-well round-bottom plates (Greiner bio-one) containing ≤200 µg MAb protein with 15,000 units of PNGase F, 10× reaction buffer (New England BioLabs), and Milli-Q water (MilliporeSigma) in a final volume of 30–34 µL. The plates were sealed and the reaction mixtures incubated in a 50 °C water bath for two hours.
To isolate and label the glycans, we added 100 µL of Agencourt CleanSEQ magnetic beads (Sciex) suspended in seven volumes of acetonitrile (7 × 34 µL) to each reaction mixture and allowed those mixtures to stand for 10 minutes. Glycans thus adsorbed to the beads. We positioned the 96-well plate on a handheld magnetic-bead separation block (part #VP 771HH, V&P Scientific). After removing the liquid by inverting the plate on an absorbent surface, we washed the glycan-coated beads with 87.5% acetonitrile in water (v/v). Then that wash was removed as described above.
The glycans were reacted with 21 µL of 0.04 M APTS (Sciex) in 20% acetic acid and 7 µL of 1 M 2-methylpyridine-borane complex (MilliporeSigma) with acetonitrile in a 50 °C water bath for two hours (2). We added seven volumes of acetonitrile to each reaction and removed liquid from the beads using the magnetic separation block. Then we washed the beads with 87.5% (v/v) acetonitrile in water. Labeled glycans were extracted from the beads at room temperature in 100 µL of Milli-Q water.
Glycan Analysis: We separated glycans by capillary electrophoresis (CE) on a PA800 instrument (Beckman Coulter) fitted with a 50.2-cm × 50-µm N-CHO capillary (Sciex). This process used a mixture containing 2.1 mL PA Plus800 N-linked CHO separation buffer (Beckman Coulter), 0.9 mL eCAP dsDNA 1000 gel buffer (Beckman Coulter), and 25 µL of 10% (v/v) acetic acid in water. The electrophoresis method comes from a 2004 Beckman Coulter document (17): Glycans are introduced into a capillary by pressure (0.5 psi for 10 seconds), and separation is achieved by CE in reverse polarity mode (cathode on the injection side) by applying 30 kV across the capillary (current range 24–26 µA).
Glycans were detected by fluorescence (ex 388 nm, em 520 nm). The CE instrument’s 32 Karat software (also Beckman Coulter) integrated the area produced by each glycan species and reported the relative area for each species. It identified glycans through comigration with standards obtained from either Prozyme or QA-Bio.
Cell Cultivation: We used four MAb-producing cell lines in the studies reported herein. Flasks containing MassBiologics’ culture medium CD2.1 were inoculated to a density of 4.0–4.5 × 10⁵ cells/mL and placed in a humidified incubator set at 36.5 °C, then maintained at 5% CO2. The CD2.1 medium already contains 0.041 mM uridine and 1.0 µM manganese, but no galactose. In two studies, we used shake flasks, and in the other a 10-L bioreactor, both charged with Gibco Dynamis medium (Thermo Fisher Scientific). We sampled these cultures daily to measure viable cell density, culture
viability, and MAb production. We used a Cedex analyzer (Roche) to measure cell numbers, a Nova analyzer (Nova Biomedical) to analyze clarified culture media for metabolites, and an Octet analyzer (Pall ForteBio) and protein A tips to measure MAb titers.
We evaluated two commercial products designed to enhance glycosylation — Ex-Cell Glycosylation Adjust supplement (GAL+) (MilliporeSigma) and Gibco GlycoTune C+ Total Feed media (GTC+) (Thermo Fisher Scientific) — for their effects on MAb galactosylation. We also evaluated the galactosylation effect of a mixture of uridine, MnCl2, and galactose. We based those mixtures on the work of Gramer et al. (8) and Gramer and James (11).
Cultures also were supplemented with either MassBiologics F19.1 or F19+ or Gibco EfficientFeed C+ AGT (EFC+) (Thermo Fisher Scientific) media. We used those primarily for control cultures or as the media in which galactose, MnCl2, and uridine were dissolved before addition to the cultures.
MAb Purification: We purified MAbs from samples of clarified cultures using ProSep-vA Ultra (MilliporeSigma) protein A chromatography media in Pierce spin columns (Thermo Fisher Scientific). To determine purified MAb concentrations, we used a NanoDrop instrument (Thermo Fisher Scientific).
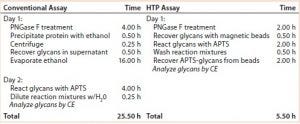
Table 1: Time required for glycan preparation with conventional and high-throughput (HTP) assays
Results: Comparing HTP and Conventional Assays
Comparing Time Required to Prepare Samples: The HTP approach reduced assay time from two days to one day and provided the ability to assay many samples at once with a 96-well microtiter plate. Table 1 compares the steps and elapsed times for the conventional and HTP assays.
Figure 1 shows a representative electropherogram of IgG MAb 1 glycans assayed by the HTP method. Four glycan species were predominant, all containing a fucose residue:
a glycan-lacking galactose (G0F)
G1F(1→6) and G1F(1→3) molecular species, each with one galactose residue
a glycan with two galactose residues (G2F).
Three minor molecular species typically were also found:
a nonfucosylated glycan lacking galactose (NGA2)
a fucosylated glycan containing two galactose residues and one GlcNAc acid residue (A1F)
an incompletely processed glycan containing five mannose residues (Man5).
Some of the unknown minor peaks may be nonfucosylated species of the glycans listed above.
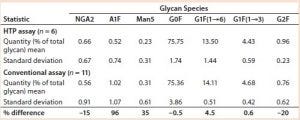
Table 2: Comparing IgG MAb 4 glycosylation measured using the HTP and conventional assays
Comparing Conventional and Magnetic-Bead Assays: The HPT assay gave results that were comparable to those obtained with the assay that was already in use. In that analysis, we used data from assays performed on different days. Table 2 summarizes the relative amounts of seven glycan species found. Each assay started with about 200 µg of MAb 4. As expected, variations for the minor glycan species (NGA2, A1F, and Man5) are higher than those for the four major glycans: G0F, G1F(1→6), G1F(1→3), and G2F. However, the variations were similar as measured by both assays.
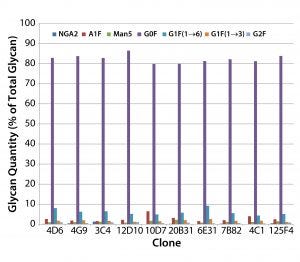
Figure 2: MAb glycan composition of 10 MAb-4–producing cloned cell lines — glycan differences from mean for each species at culture harvest
Results: Applying the HTP Assay to Process Development
Screening MAb-Producing Cell Lines for MAb Glycosylation: We used the HTP assay for rapid screening of MAb glycosylation in 10 MAb-4– producing clones. The clones exhibited differences in glycosylation, especially in their relative amounts of A1F (a monosialylated glycan), Man5, and G1F(1→6) (Figure 2).
Glycosylation in Cultures Fed with Supplements Designed to Enhance Galactosylation: We evaluated three MAb-producing cell lines created by MassBiologics in experiments designed to enhance galactosylation. Each cell line was cultivated in a medium developed to optimize both
cell growth and MAb production. We supplemented the fed-batch cultures with two commercially obtained mixtures that are designed to enhance glycosylation or with up to five concentrations of a mixture of uridine, MnCl2, and galactose. Uridine and galactose are precursors of UDPgalactose; Mn is a cofactor for the synthesizing enzyme. And UDPgalactose donates galactose residues to N-linked glycans.
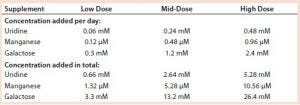
Table 3: Uridine, manganese, and galactose concentrations added to cultures of cell line 1
Results Using Cell Line 1: Cells were cultivated in MassBiologics’ CD2.1 medium. From day 3 to day 13, we supplemented a control culture with EFC+ at 1.5% of the working volume at that time. One test culture was supplemented with 0.5 mL of GAL+ on every second day and with EFC+ at 1.5% of the working volume daily from day 3 to day 13. A second culture was supplemented daily with GTC+ at 1.5% of the working volume from day 3 to day 13. Another culture was supplemented daily with EFC+ at 1.5% of the working volumes from day 3 to day 7 and daily with GTC+ at 1.5% of the working volumes from day 8 to day 13. Three cultures were supplemented daily with EFC+ at 1.5% of the working volume and every other day with a mixture of uridine, MnCl2, and galactose from day 3 to day 13.
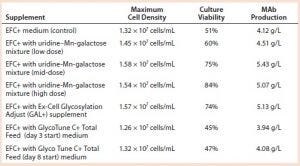
Table 4: Cell growth, culture viability, and MAb 1 production (concentration) of cells supplemented with a galactose–MnCl2–uridine mixture, with Ex-Cell Glycosylation Adjust (GAL+) additive, or with GlycoTune C+ Total Feed media; measurements taken at harvest
We added a uridine-Mn-galactose mixture at one of three concentrations (low-, mid-, and high-dose). Table 3 lists the increased concentrations of each day (upper panel) and concentrations added in total throughout the experiment. Table 4 lists the maximum cell densities, culture viability at harvest, and MAb production with each treatment. Concentrations of uridine, MnCl2, and galactose were comparable to those added in total by Gramer et al. (8), which ranged from 0 to 10 mM (low dose), 0 to 20 µM (mid-dose), and 0 to 50 mM (high dose).
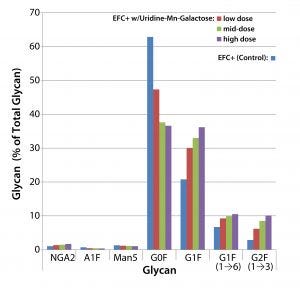
Figure 3: Effects of uridine–Mn–galactose mixtures on glycosylation of MAb 1 at culture harvest
Figure 3 shows the effects of low-, mid-, and high-dose uridine-Mngalactose mixtures on the glycosylation of MAb 1. The control and low-dose mixtures showed the largest such effects. The greatest changes in glycan structure came with galactosylation of G0F to yield G1F(1→6) and G2F. Increase in the amount of the G1F(1→3) glycan was less pronounced. The mid- and high-dose mixtures did not increase galactosylation much more than that. As expected, we saw a decrease in the quantity of glycans lacking galactose (G0F). And little change manifested in the quantities of three minor glycan species: NGA2, A1F, and Man5.
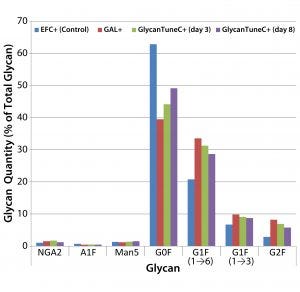
Figure 4: Effects of commercial medium supplements on MAb 1 glycosylation at culture harvest; control is from Figure 3.
We saw similar results when supplementing cultures of cells producing MAb 1 with two commercially obtained medium additives (Figure 4). Daily we added GAL+ or GlycoTune C+ supplements to these cultures from day 3 to day 13 — or EFC+ media from days 3 through 7 followed by GlycoTune C+ supplement from days 8 through 13. The volume added each day was 1.5% of the current working volume. The control was the same as that shown in Figure 3.
When we added the uridine–Mn–galactose mixtures to the cultures, they exhibited enhanced galactosylation, particularly increases in the quantities of the G1F(1→6) and G2F species. And they showed a concomitant decrease in the presence of nongalactosylated G0F species. The commercial supplements yielded similar results.
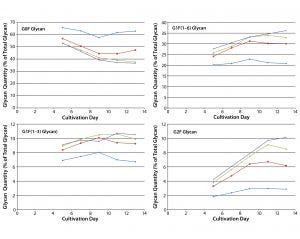
Figure 5: Effect of uridine–Mn–galactose mixtures on galactosylation of MAb 1 glycans during cultivation; diamonds indicate Efficient Feed C+ medium (EFC+ control); squares indicate EFC+ with low-dose uridine–Mn–galactose; triangles indicate EFC+ with mid-dose uridine–Mn–galactose; and crossmarks indicate EFC+ with high-dose uridine–Mn–galactose. Day 13 data are from Figure 3.
The two commercial supplements designed to enhance glycosylation also increased galactosylation over time in culture. Cells that produce MAb 1 were cultivated in MassBiologics’ CD2.1 medium supplemented with EFC+ medium alone or in combination with low-, mid-, and high-dose mixtures of uridine–Mn–galactose. Adding those mixtures enhanced MAb galactosylation over time (Figure 5). Figure 4 shows data for day 13. We saw little change in galactosylation for the glycan control; most increases in galactosylation occurred between that and the low-dose uridine–Mn–galactose mixture.
The two commercial supplements similarly increased the amounts of both G1F(1→6) and G2F glycans as had the uridine–Mn–galactose mixtures (data not shown).
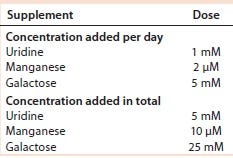
Table 5: Uridine, Mn, and galactose concentrations added to cultures of cell line 2
Results with Cell Line 2: We cultivated a cell line producing MAb 2 in shake flasks with CD2.1 medium supplemented by F19.1. Here we evaluated two galactosylation-enhancing supplements: a uridine–Mn–galactose mixture and a commercial supplement (GAL+). Table 5 lists the concentrations of uridine, MnCl2, and galactose used in this study. Concentrations of galactose and uridine are approximately the same as those in the 10× mixture of Gramer et al. (8); however, the concentration of manganese is approximately the same as that in the 20× mixture of Gramer et al. (8) because manganese is present in the F19.1 supplement. Neither supplement affected cell growth or culture viability at harvest (Table 6). Cultures supplemented with GAL+ or the uridine–Mn–galactose mixture produced MAbs at lower quantities than the controls, however.

Table 6: Cell growth, culture viability, and MAb 2 production (MAb concentration) of cells supplemented with a galactose–MnCl2–uridine mixture or with Ex-Cell Glycosylation Adjust (GAL+) additive; measurements taken at harvest
Both the uridine–Mn–galactose mixture and GAL+ enhanced galactosylation of MAb 2 glycans (Figure 6). As seen in the results for MAb 1, there were increases in the amounts of the G1F(1→6) and G2F glycan species; the increase in the amount of the G1F(1→3) glycan was less pronounced. As expected, we saw a decrease in the quantity of glycan lacking galactose (G0F). When added to this cell line, GAL+ enhanced galactosylation and caused an increase in the quantity of NGA2 glycan, whereas the other two minor glycan species (A1F and Man5) showed little change.
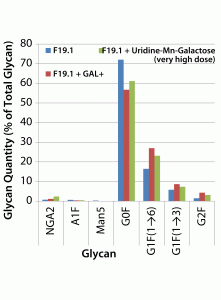
Figure 6: Effects of a uridine–Mn–galactose mixture and a commercial supplement on the glycosylation of MAb 2 at culture harvest
Findings and Looking Ahead
The results presented here demonstrate how
medium composition affects the galactose content of MAb glycans
MAb galactose composition changes during cell cultivation
galactosylation depends on the availability of precursors — in particular, uridine and galactose.
Although galactosylation increased throughout, changes in the quantities of G0F, G1F(1→6), G1F(1→3), and G2F varied among the three MAb species tested. In the conclusion of this report next month, we will present a third example of how galactosylation is affected by medium components. Those results will be followed by discussion of the seemingly preferential galactosylation of a MAb’s α1,6 arm, followed by details of G2F synthesis and the roles that galactose plays in antibody function.
Part 2 of this article was published in the March 2018 issue of BioProcess International.
Acknowledgment
The collaboration of Rachel Rivera, who freely shared her knowledge of glycan analysis and expertise in operating the capillary electrophoresis instrument, was critical to the success of this work.
References
1 Varadi C, Lew C, Guttman A. Rapid Magnetic Bead Based Sample Preparation for Automated and High Throughput N-Glycan Analysis of Therapeutic Antibodies. Anal. Chem. 86(12) 2014: 5682–5687; doi:10.1021/ac501573g.
2 Sato S, et al. One-Pot Reductive Amination of Aldehydes and Ketones with α-Picoline-Borane in Methanol, in Water, and in Neat Conditions. Tetrahedron 60(36) 2004: 7899–7906; doi:10.1016/j.tet.2004.06.045.
3 Ruhaak LR, et al. 2-Picoline-Borane: A Non-Toxic Reducing Agent for Oligosaccharide Labeling By Reductive Amination. Proteomics 10(12) 2010: 2330–2336; doi:10.1002/pmic.200900804.
4 Yeh C-H, et al. Magnetic Bead-Based Hydrophilic Interaction Liquid Chromatography for Glycopeptide Enrichment. J. Chromatog. A 1224(2012): 70–78; doi:10.1016/j.chroma.2011.12.057.
5 Li J, et al. Magnetic Nanoparticles Coated with Maltose-functionalized Polyethyleneimine for Highly Efficient Enrichment of N-glycopeptides. J. Chromatog. A 1425(2015): 213–220; doi:10.1016/j.chroma.2015.11.044.
6 Kornfeld S, Kornfeld R. Assembly of Asparagine-Linked Oligosaccharides. Annu. Rev. Biochem. 54, 1985: 631–664.
7 Wong NSC, et al. An Investigation of Intracellular Glycosylation Activities in CHO Cells: Effects of Nucleotide Sugar Precursor Feeding. Biotechnol. Bioeng. 107(2) 2010: 321–336; doi: 10.1002/bit.22812.
8 Gramer MJ, et al. Modulation of Antibody Galactosylation Through Feeding of Uridine, Manganese Chloride, and Galactose. Biotechnol. Bioeng. 108(7) 2011: 1591–1602; doi: 10.1002/bit.23075.
9 Hills AE, et al. Metabolic Control of Recombinant Monoclonal Antibody N-Glycosylation in GS-NS0 Cells. Biotechnol. Bioeng. 75(2) 2001: 239–251; doi:10.1002/bit.10022.
10 Liu B, et al. The Availability of Glucose to CHO Cells Affects the Intracellular Lipidlinked Oligosaccharide Distribution, Site Occupancy, and the N-Glycosylation Profile of a Monoclonal Antibody. J. Biotechnol. 170(1) 2014: 17–27.
11 Grainger RK, James DC. CHO Cell Line Specific Prediction and Control of Recombinant Monoclonal Antibody N-Glycosylation. Biotechnol. Bioeng. 110(11) 2013: 2970–2983; doi:10.1002/bit.24959.
12 St. Amand MM, et al. Identification of Manipulated Variables for a Glycosylation Control Strategy. Biotechnol. Bioeng. 111(10) 2014: 1957–1970; doi:10.1002/bit.25251.
13 Fan Y, et al. A Multipronged Investigation Into the Effect of Glucose Starvation and Culture Duration on Fed-Batch CHO Cell Culture. Biotechnol. Bioeng. 112(10) 2015: 2172–2184; doi:10.1002/bit.25620.
14 Kildegaard HF, et al. Glycoprofiling Effects of Media Additives on IgG Produced by CHO Cells in Fed-Batch Reactors. Biotechnol. Bioeng. 113(2) 2016: 359–366; doi:10.1002/bit.25715.
15 McCracken NA, Kowle R, Ouyang A. Control of Galactosylated Glycoforms Distribution in Cell Culture System. Biotechnol. Prog. 30(3) 2014: 547–553; doi:10.1002/btpr.1906.
16 Ivarsson M, et al. Evaluating the Impact of Cell Culture Parameters on Monoclonal Antibody N-Glycosylation. J. Biotechnol. 188, 2014: 88–96; doi:10.1016/j.jbiotec.2014.08.026.
17 Knudson VF, Simonian MH. A-1986A: CE Separation of N-Linked Oligosaccharides Released from Recombinant Monoclonal Antibody. Beckman Coulter: Brea, CA, 2004.
Corresponding author Roger Anderson is a senior scientist, Lindsay Hock is a process development associate, and Sadettin S. Ozturk is deputy director for process development at MassBiologics, University of Massachusetts Medical School, 460 Walk Hill Street, Boston, MA 02126; 1-617-474-3000; www.umassmed.edu/Massbiologics. Rachel Yao is now a senior associate scientist at Unum Therapeutics (Cambridge, MA).
You May Also Like


