Localized Surface Plasmon Resonance for Bioprocess Development, Monitoring, and ValidationLocalized Surface Plasmon Resonance for Bioprocess Development, Monitoring, and Validation
Academic laboratories have embraced localized surface plasmon resonance (LSPR) as the “new wave” of label-free technology (1). This technique is based on the ability of colloidal metal nanoparticles or nanostructured metallic films to absorb light in a narrow wavelength range. Metal nanostructures “sense” changes occurring at their surfaces by shifting the frequency of the light they absorb or reflect. As a consequence, a basic LSPR system requires only optical fibers, a source of white light, and a detector (1,2). The simplicity of LSPR instrumentation contrasts with its exquisite sensitivity. Binding events and functional activity of nucleases (3) and proteases (4) can be monitored and quantified in real time based on observation of a single 20-nm nanoparticle — probably one of the world’s smallest biosensing supports (5).
Nanostructured metallic films, rather than isolated metal nanoparticles, enable commercial endeavors by their robust and reproducible nature. With recent advances in nanofabrication and characterization, stable metal films can be manufactured at a large and cost-effective scale on a wide range of surfaces (2). Such films retain their nanostructures and the physical properties of nanoparticles. As a result, LSPR technology is quickly moving from proof-of-principle experiments to commercialization.
Key features of the technology include its marginal bulk effect and compatibility with various matrices, including cell media and sera. In addition, LSPR can accommodate label-free and labeled implementations, with the latter pushing its detection limits into the femto- to picomolar range (2). Various approaches using the same core technology allow detection of biologics in concentrations spanning from trace contaminants to levels of therapeutic antibodies in fermentation broths and cell culture supernatants. Furthermore, LSPR assays can be performed either at line or in line. As a result, this is a platform particularly well suited for all stages of bioprocessing, from development to monitoring and validation.
PRODUCT FOCUS: ANTIBODIES
PROCESS FOCUS: PRODUCTION AND DOWNSTREAM PROCESSING, PRODUCT DEVELOPMENT)
Who Should READ: QA/QC, PROJECT MANAGERS, AND UPPER-LEVEL MANAGERS
KEYWORDS: BIOSIMILARS, IGGS, DOSE RESPONSE, ROBUSTNESS AND RUGGEDNESS, ANALYTICAL METHODS
LEVEL: INTERMEDIATE
Photos 1:

Photos 1: ()
We recently published a review covering the basics of LSPR and its application to protein characterization and quantitation (2). Here, we present the LightPath system, an LSPR platform developed by LamdaGen Corporation, and discuss the fundamental features that make it highly desirable for use in bioprocessing.
System and Features
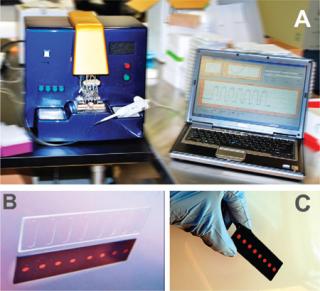
Use of LSPR technology in bioprocess applications requires a sensing surface, a sample delivery apparatus, and a computer with software capability to acquire data in real time. So LamdaGen has developed the LightPath system. The instrument measures a biochip consisting of nanostructured metallic films formatted in four-channel (Photo 1A) or eight-channel (Photos 1B and 1C) simultaneous monitoring arrays. A light source and spectrometer are dedicated for each channel. White light is directed to the sensing surface by optical fibers. Reflected signals are collected by additional optical fibers connected to those individual spectrometers. Customized software collects spectra at a rate of 3–5 Hz. The reflectivity of impinging white light is monitored in real-time for each channel independently and then converted to a plasmon peak. Although the plasmon is 80–100 nm wide, a proprietary algorithm determines the position of its peak with a resolution of 2–6 pm. The system computes changes in plasmon position over time (the sensorgram) and displays it in real time for each channel.
Four or eight individual biochip channels are monitored in parallel by static or flow mode. Static mode is extremely useful for quick screening and fast qualitative analysis. A small amount of sample (30–200 µL) is injected using a pipettor and pipette tips before the binding reaction occurs. Static-mode sensorgrams are qualitative because mass transport affects binding reaction kinetics. But when samples are delivered to sensor surfaces using a modular syringe pump unit, the resulting flow better controls the LSPR–fluid interface and minimizes the effects of mass transport.
In flow-mode configuration, binding kinetics are highly reproducible and can be modeled and quantified. As in high-performance liquid chromatography (HPLC), fluidics are used to inject samples into fixed-volume loops so that they can be carried to the LSPR channels by running buffer. Typical sample volumes in flow mode are 50–2,000 µL, depending on the loop size. With current flow cell geometries, we have empirically determined that 10–50 µL/min flow rates produce binding sensorgrams exhibiting diffusion-limited effects, whereas at >60 µL/min the binding is fully kinetic limited.
Robustness and Ruggedness
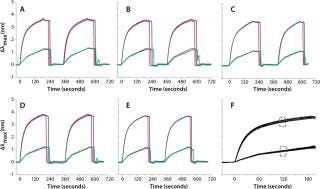
We tested the robustness of our system by measuring the reproducibility of IgG binding to protein A in a single flow channel, across flow channels of the same biochip, and across different biochips from the same batch. Figure 1 summarizes the reproducibility data. In brief, two IgG concentrations (10 µg/mL and 100 µg/mL) are flowed into the four-channel biochip for about two minutes. After one elution with 2 mM HCl, the system is equilibrated/reconditioned again with running buffer. That allowed us to monitor reproducibility for a single channel as well as channel-to-channel reproducibility on the same biochip.

Figure 1: ()
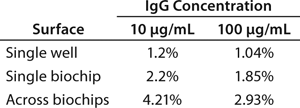
By comparing several biochips, we calculated the overall reproducibility for a given batch. Figure 1A–e shows sensorgrams for five different biochips. Figure 1F is a visual overlay of sensorgrams for >20 independent biochips, and Table 1 summarizes those results. For quantitation, we computed the shifts at specific time lapses after sample injection. Although the overall coefficients of variation (CV) are 3–5%, CVs among channels of a single biochip are ~2% and ~1% for each individual channel.
Table 1: Coefficients of variation (CV) va
lues for the experiment in
Figure 1; values are reported for single sensors, single biochips, and the overall CV across all (>20) biochips.

Table 1:
Dose-Response Measurements
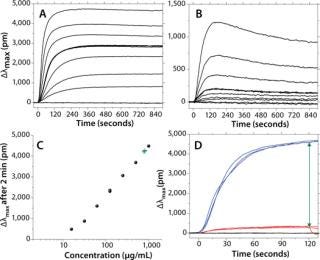
The reproducibility of sensorgrams across the channels of a biochip allows for measurement of dose response in a single experiment without the need to regenerate the chip. This can be performed by flowing 60 µL of antibody at 30 µL/min and several concentrations, one per each channel of a biochip. Figure 2 reports the binding and dissociation of human IgG (Figure 2A) and goat IgG (Figure 2B) flowed onto a protein A surface at seven different concentrations ranging from 15 µg/mL to 1,000 µg/mL. To serve as a negative control, one channel is not activated with protein A. The association phase is set to last for two minutes and followed by a dissociation phase for an additional 13 minutes.

Figure 2A: b: Same experiment as in 2a, but with a goat IgG. Figure 2c: Standard curve (•) or calibration curve derived from 2a, 120 sec postinjection; linearity is observed from ~20 µg/mL up to >2,000 µg/mL; green crosses are discussed in reference to panel 2d. Figure 2d: ()
For Figure 2C, a standard curve was built by monitoring the shift of IgG after an arbitrary set time of 120 seconds. For human IgG binding to protein A, the dose response is linear within the range of ~15–2,000 µg/mL (about two orders of magnitude). This compares favorably with dynamic ranges observed using HPLC (~250–8,000 µg/mL) (6).
Figure 2A and 2b include three overlaying repeats at concentrations of 125 µg/mL for both the human IgG and the goat IgG. They illustrate the quality of raw data that LightPath LSPR technology can achieve without a need to correct sensorgrams for bulk effects or other injection spikes. It also allows for quick assessment of the interaction strength. For instance, the sensorgrams’ overall shapes confirm the well-known fact that human IgG has a higher affinity or avidity to protein A than does goat IgG. Such qualitative affinity ranking can be achieved using enzyme-linked immunosorbent assays (ELISAs). However, LSPR markedly shortens the time for obtaining results to 5–30 minutes while providing the additional benefit of relative kinetic information. Indeed, association data show that (kon)hum 6 (kon)goat. On the other hand, (koff)goat 2.1 * 10–3/s, whereas the dissociation rate of human IgG cannot be quantified because of a lack of signal drop. Nonetheless, it is clear that (koff)hum << (koff)goat.
IgG Quantitation
We have already reported that LSPR is compatible with various substrates, including cell growth media and cell lysates (2). An immediate question is whether it can be used as an at-line analytical tool to monitor IgG titer during fermentation or cell culture. One challenge arises when the color of cell growth media interferes with the plasmon signature. LSPR is sensitive to color changes in a solution, and media change color during fermentation processes. One simple way to circumvent this color issue is to monitor two surfaces simultaneously: the first not recognizing IgGs and used to measure the media color contribution as a background reading for subtraction, the second containing protein A and measuring the sum of the media color contribution and IgG titer.
Figure 2D illustrates how IgG titration thus can be achieved. We filtered media coming directly out of a CHO cell culture run and directed it to a protein A biochip. This figure shows the response of three separate injections of IgG in filtered crude media along with three injections of the same crude media on nonbinding surfaces. By computing the differential shift between binding and nonbinding surfaces, it is possible to extract the sole IgG binding contribution. That relative IgG binding shift then can be converted into a titer using a standard curve. In the example here, we found that IgG titer in crude media from the fermentor was 840±60 µg/mL compared with a value of 860 µg/mL determined using HPLC.
Biosimilars
A major issue in the field of biosimilars is determining whether a generic biologic has the same properties as its original therapeutic counterpart. Although LSPR assays cannot directly infer the structural identity and proper folding of therapeutic proteins, they can provide indirect clues on such parameters by comparing binding affinities and kinetic parameters for original therapeutics and biosimilars.
The LightPath system is a useful platform for such initial studies: In its static mode, it allows a fast qualitative comparison between two molecules to determine whether more challenging quantitative experiments are needed. Figure 3 compares binding of a therapeutic antibody and its biosimilar to their target protein, which was immobilized on the surface. Figure 3A represents static injection of seven different concentrations (from 1 µg/mL to 50 µg/mL) of a therapeutic antibody and a potential biosimilar, each injection consuming only 60 µL of sample. It is clear from comparing the full sensorgram traces that both molecules exhibit extremely close binding patterns. That is further confirmed in Figure 3B, in which sensorgrams for multiple injections are aligned with the injection points set at time = 0. Slight variations in the association curves are ascribed to the static mode of the experiment, so information presented is only qualitative.

Figure 3A: : Sensorgrams from Figure 3A are aligned and overlaid; because the reaction occurs in a static mode, binding is diffusion-limited and therefore qualitative. Nevertheless, this example provides a compelling case that the biosimilar is a good candidate for more in-depth analysis. Figure 3C: ()
For furth
er quantitation, a flow cell format is used to determine affinity parameters for these monoclonal antibodies. Several concentrations of 500-µL samples are flowed for five minutes, and the resulting ▵λ are recorded. By fitting ▵λ against concentration using a logistic model, we can deduce relative KD for the therapeutic and each potential biosimilar. This analysis is similar to the saturation binding experiment for KD determination using a Scatchard plot. It assumes that binding has proceeded to equilibrium for all traces, which may take a few minutes to hours, especially for the lowest concentrations of analyte. Because we limit the binding time to five minutes for all antibody concentrations, we measure relative KD, noted &Ktilde;D in the figure, which is an upper limit for the true KD.
Figure 3C compares binding properties of the therapeutic MAb and two potential biosimilars. We measured KD=10.16 nM for the therapeutic MAb. For biosimilars 1 and 2, we measured KD=7.7 nM and KD=10.02 nM, respectively. Those results indicate similar binding strengths for all antibodies consistent with the expectation of identical (or similar) affinities between a therapeutic MAb and its biosimilars. The measured affinity of the therapeutic MAb agrees closely with values reported in the literature (4–25 nM).
Further information could be garnered by measuring KD through association and dissociation rates. However, in most cases involving therapeutic monoclonal antibodies with small koff values, dissociation rates cannot be measured in a quick screening/ranking experiment because of a lack of appreciable signal drop during dissociation (even after several hours of rinsing). Therefore, KD determination using “on” and “off” rates is impracticable for a quick screening.
Discussion
The LSPR technology embodied by the LightPath system provides a new analytical tool for bioprocessors. First, responses of a protein A biochip to IgG are robust and reproducible. In a client-site evaluation, such biochips could be regenerated ~100 times over four days without loss of performance.
Second, traces such as those shown in Figures (234) are essentially raw traces that do not require software manipulation to account for bulk effects or reference surfaces. The lack of bulk effect is due to the localized nature of plasmons in the nanostructured surfaces because the plasmon evanescent field (depth of the sensing area from the surface) is ~15–30 nm (1). By contrast, conventional surface plasmon resonance (SPR), which suffers from a significant bulk-effect issue, has a plasmon evanescent field of 200–1,000 nm that causes sensing changes further away from the surface. A localized sensing volume means fewer parasite interferences due to impurities and inhomogenities in solutions — and therefore less need for corrective steps. To illustrate that point, the sensorgrams in Figure 2D represent media coming straight from a fermentor (passed through a 0.22-µm filter to remove cell debris) to a LSPR surface. Within minutes of the reaction, the product titer can be determined.
The dynamic range of LSPR for protein A/IgG covers the 15–2,000 µg/mL range, about two logs. This compares favorably with HPLC (~1–1.5 logs) (6) and is similar to the dynamic range of a Biacore 3000 SPR system from GE Healthcare (data not shown, internal side-by-side comparison), although the LightPath system offers higher throughput. Consequently, LSPR uniquely fits into the single-use mentality because it allows for quantitation without regeneration. A single eight-channel biochip has enough sensor spots for both negative and positive controls, calibration checks, and several repeats of an unknown sample.
Detection of contaminants is also a critical step in bioprocessing. This includes the presence of live mycoplasma, host-cell proteins, and protein A leaching from purification columns. Contaminants are present in minute amounts — often fg/mL to pg/mL levels and, in the case of protein A, in the ng/mL range per mg/IgG in solution. Such levels approach the limits for detection using label-free technologies.
For example, protein A that has leached into a therapeutic antibody solution is partly removed by filters that guarantee a final concentration below 10 ng per milligram of purified antibody (7). Quality control is usually performed off line in the form of a labeled ELISA assay. We have recently reported how labeled LSPR could detect protein A at the 10 pg/mL level per mg/IgG. It can be converted to a labeled detection mode with a sandwich assay format in which the secondary antibody is linked to an enzyme (2). The enzyme is used to convert a chemical substrate into an insoluble product that deposits onto the sensor surface. That provides a mass amplification on the surface to drive down the sensitivity of the sensor by two to three orders of magnitude.
Because LSPR can detect index-of-refraction changes of <5×10⁻⁴ at the surface, a deposit of 1 nm of product yields a quantifiable LSPR shift of ~2 nm. However, an equivalent amount of product would not give a measurable OD above the baseline in a conventional ELISA because of the small extinction coefficient of colored dyes. Thus, by using a label and the LSPR surface, contamination can be assessed more quickly and probably in a more sensitive way than with an ELISA. Although our work has focused only on protein A detection so far as a model, we are currently exploring the labeled approach for host-cell protein detection and intend to enter into a collaboration study regarding mycoplasma.
Finally, for biosimilars, we have illustrated how the LightPath system enables rapid screening and likely ranking to identify potential candidates for the drug validation. The LSPR method requires a small amount of sample (~60 µL per injection here) and allows for acquisition and quantitation of a full set of data in D, which is not true affinity because the assumption that all binding traces have reached equilibrium is not likely to be met. However, we believe it is a valid parameter for relative ranking and quick screening while awaiting full kinetic characterization of a few selected samples. Such a screening process is convenient because LightPath biochips are designed around an eight-channel array format that can be scaled-up by adding a robotic interface module.
Ready for Prime Time
LSPR technology has matured and is now ready to move from academic to commercial laboratories. The bioprocess areas most likely to benefit from this new technology are process development, process monitoring, and quality control (QC). More effective process development efforts can lead to lower costs at the clinical production scale. Improved technologies are needed to effectively and economically develop bioprocesses and thereafter be used during manufacturing to monitor them. Regulatory requirements play a large role in determining how such processes will be developed and later implemented. For example, the concentration of therapeutic monoclonal antibodies expressed from cell culture must be monitored throughout production using validated assays. LSPR technology offers an automated, label-free approach to developing assays that are both reproducible and reliable for routine concentration monitoring. The same technology also can provide kinetic and profiling data to ensure the integrity of biologicals that are manufactured.
A similar case can be made for process monitoring and QC. Product concentration is the most likely critical parameter to monitor routinely during large-scale manufacturing of therapeutic monoclonal antibodies. For instance, determining the best time frame to begin
downstream processing of therapeutic antibodies can influence the success of the manufacturing batches to come. Knowing when to begin a the downstream cycle can limit problems with reduced yields due to premature harvesting and/or prevent degradation of product that remains too long in a bioreactor. ELISA monitoring is labor-intensive and takes many hours to produce results. A more rapid technique such as label-free LSPR would offer significant advantages for monitoring processes in real-time (product concentration in a bioreactor) and could be implemented on-line or at-line.
LSPR can also be used to validate product specifications through characterization assays that measure biotherapeutic–target binding events. And routine assays using LSPR in a labeled mode can be implemented to monitor trace levels of contaminants, such as protein A that has leached into the final product, host cell proteins, or contamination by organisms such as mycoplasma. For that, LSPR signals are amplified using labels to drive detection levels to 10–100× the sensitivity of ELISAs for extremely low-level contaminants. Such sensitivity can enable much earlier intervention during upstream or downstream processing cycles to prevent or reduce product losses.
About the Author
Author Details
Daniele Gerion, PhD, and Gwo-Jen Day, PhD, are senior scientists at LamdaGen Corporation, 1455 Adams Drive, Suite 1155, Menlo Park, CA 94025; [email protected], www.lamdagen.com.
REFERENCES
1.) Anker, JN. 2008. Biosensing with Plasmonic Nanosensors. Nat. Mater. 7:442-453.
2.) Gerion, D., and GJ. Day. 2010. New Label-Free and Labeled Technology for Protein Characterization and Quantitation. BioPharm Int..
3.) Lui, GL. 2006. A Nanoplasmonic Molecular Ruler for Measuring Nuclease Activity and DNA Footprinting. Nature Nanotechnol. 1:47-52.
4.) Sun, C. 2010. Time-Resolved Single-Step Protease Activity Quantification Using Nanoplasmonic Resonator Sensors. ACSnano 4:978-984.
5.) McFarland, AD, and RP. van Duyne. 2003. Single Silver Nanoparticles As Real-Time Optical Sensors with Zeptomole Sensitivity. Nano Lett. 3:1057-1062.
6.) Application Note 2010.POROS A20 Analytical HPLC Columns for the Quantitation of Monoclonal Antibodies, Applied Biosystems (Life Technology), Carlsbad.
7.) Application Note 2010.Protein A Ceramic HyperD® F Affinity Chromatography Sorbent, Pall Corporation, Port Washington.
You May Also Like


