Cost Analysis of Cell Therapy Manufacture: Autologous Cell Therapies, Part 1Cost Analysis of Cell Therapy Manufacture: Autologous Cell Therapies, Part 1
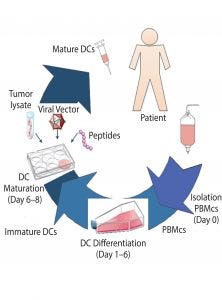
Figure 1: Production of autologous dendritic cells to be used for immunotherapy (DC = dendritic cells, PBMCs = peripheral blood mononuclear cells).
Cell therapies are a growing area of interest for the treatment of a number of indications such as neurological, cardiovascular, and ophthalmological maladies that are refractory to other more conventional drug therapies. A number of cell-based therapy products currently are undergoing clinical trials. The most common target is oncology, which represents 46% of all cell-based therapies through the use of traditional blood-cell and immune-cell–based therapies. For treatment of various cancers, immune cells, lymphocytes (natural killer cells, T cells, and B cells) and dendritic cells (DCs) are typically used, contributing to about half of the oncology-targeted cell-based therapies (1).
Cell therapies can be divided into two main groups: those that are administered to the same individual (autologous) or derived from a donor (allogeneic). These groupings dictate the manufacturing method. Autologous cell-based therapies (cells are taken from a patient, manipulated, and then returned to the same patient) are produced at small-scale, in dedicated suites, with centralized manufacturing or localized manufacturing facilities close to the patient’s point-of-care. Thus, autologous production challenges include patient variability and inability to take advantage of economies of scale in providing treatment for a large number of patients. Such patient-specific therapies typically are commercialized by scaling-out the same process such as by replicating facilities and equipment logistically at processing centers, resulting in a linear increase of associated manufacturing costs.
Manufacturing processes for allogeneic therapies (cells are taken from one donor, manipulated, and given to many patients) are similar to those of other biologics such as vaccines, monoclonal antibodies, and recombinant proteins. Donor cells can be expanded using existing scalable technologies and banked through cryopreservation. That approach is used to deliver larger production volumes at a reduced therapy cost. Allogeneic therapies also can be supplied as off-the-shelf frozen drug products until administration to a patient. However, such products require longer storage times, so cell stability can be a problem.
Because of the complexity of both the cells (product) and treatment logistics, relatively low production volumes (≤200 L), and the large number of manual manipulations involved with current methods, cell therapies are expensive to produce. Our estimate of manufacturing costs of cell therapy treatments are expected to exceed 100,000 US dollars (USD) per patient (based on current manual processes). Thus, affordability of cell therapy products will be an important issue and challenge for both manufacturers and healthcare providers. Given that such costs are relatively high compared with other therapies, cost drivers need to be identified and understood to guide improvement efforts such that products can be delivered at commercially viable costs. Ideally, high-cost components should be identified early in development to allow an optimal development and assessment of suitable scale-up strategies.
Autologous treatments represent the great majority of cell therapies currently undergoing clinical trials. They also represent a completely different manufacturing model from traditional biologics, so no comprehensive analysis on cost of goods (CoGs) has been conducted. Treatment cost comprises many components that affect overall manufacturing cost, the exact composition of which depends on the product itself. Typically, product-specific elements that affect treatment costs include the following:
Management of a patient in a hospital setting (removing and reintroducing cells)
Expansion and activation of cells removed from a patient
Manufacture of the agents used to activate the cells
Logistics
Risk and quality.
This article (presented in two parts) focuses on the manufacture of cell therapies (expansion and activation of cells derived from a patient), which present novel labor-intensive processes and an area in which there is little published information related to costs. We used BioSolve software from Biopharm Services, which is an industry standard modeling platform that has been used to model costs of other biopharmaceutical products (2–3). We used this model to identify and quantify potential cost savings (e.g., through the use of advanced technologies, automation, and/or new manufacturing methods). That approach, based on modeling the sequence of individual steps of cell therapy production, will enable implementation of alternative technologies with different levels of automation in selected areas of a process. It also will help manufacturers evaluate different scenarios and compare relative impact on costs through sensitivity analyses. As a baseline model of a cell therapy manufacturing process, this study used the production of autologous dendritic cells for immunotherapy. A brief description of current practice follows.
Immunotherapy with Dendritic Cells
Vaccination strategies involving DCs have been developed using special cell properties in coordinating innate and adaptive immune responses. DCs capture and process antigen and present it to both naive and memory T-cells to trigger a specific immune response. Vaccination with DC, particularly for cancer and viral-induced diseases, can lead to establishment of antigen-specific immune responses in patients, which ultimately can eliminate the pathogen or tumor. In this process, the first step is to provide DCs with dying tumor cells, cancer cell RNA, a viral vector, peptides, and/or antibodies, before injecting them back into a patient (4–6). That can be achieved either by culturing ex vivo DCs that have been derived from patients with an adjuvant (that induces DC maturation) and the specific antigen and then injecting these cells back into the patient; or by inducing DCs to take up the specific antigen in vivo. Both processes will prime immune cells to attack the pathogen or tumor upon reintroduction.
Patient cells are collected and shipped under controlled conditions to a manufacturing site, where they are manipulated in accordance with good manufacturing process (GMP) guidelines and conditions to isolate and activate target immune cells. The activated cell-based immune therapy is then shipped back to a patient to be administered, which is repeated enough times to deliver the full therapeutic dose.
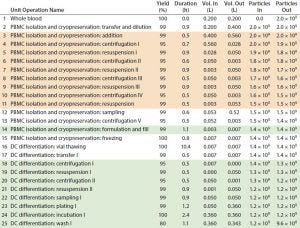
Table 1: Baseline process details and areas where varying levels of automation were implemented. (Tan boxes = partially automated process, green boxes = fully automated process, particles = cell count, DC = dendritic cell)
An eight-day ex vivo manual preparation method for generating large numbers of DCs for clinical studies (7) was used as a baseline cost model using Biosolve Process software. Figure 1 shows the DC process. Fresh normal peripheral blood is collected from a single patient by leukapherisis and is separated by Ficoll-Hypaque density gradient centrifugation to obtain peripheral blood mononuclear cells (PBMCs). Those PBMCs can be cultured immediately to generate DCs or frozen to be thawed and cultured when required or when antigen is available. Peripheral blood DCs then are induced and proliferated from the PBMCs with granulocyte-macrophage colony stimulating factor (GM-CSF) and interleukin-4 (IL-4) for five days to generate immature DCs. Maturation media contained tumor necrosis factor a (TNFa), interleukin-1b (IL-1b), and interleukin-6 (IL-6). The DCs are cultured overnight in that media to mature before the antigen is introduced from samples of tumor or virus. The final product is filled into vials and frozen. Cell concentration and viability are measured at key process stages, and DC-product release testing is conducted — including immunophenotyping for identity and phenotype characterization by flow cytometry.
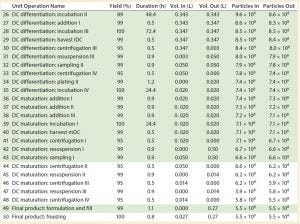
Table 1 continued: Baseline process details and areas where varying levels of automation were implemented. (Light green boxes = partially automated process, dark green box = fully automated process, particles = cell count, DC = dendritic cell)
Baseline Assumptions and Model Construction
We built an economic model to provide a better insight into the key cost drivers of the autologous DCs manufacturing process (7). It did not include the cost related to collection of whole blood from patients or costs associated with DC product transport and administration to patients. All data shown were obtained directly from the software model. Table 1 shows the sequence of process steps that describe the baseline process, and the “Assumptions” box lists associated model assumptions.
Assumptions |
|---|
All ProcessesStarting material: whole blood 1 × 10¹⁰ cells/mL (7)Dose: 2 × 10⁷ cells (7)Team: Three operators, one supervisor, one quality assurance (QA), two quality control (QC)Media preparation: “Per step” basis |
Manual Process (Baseline)10% batch failure rateOpen manipulation undertaken in biological safety cabinet (background B cleanroom)Equipmenta comprises two biosafety cabinets (BSC) and two incubatorsMedia preparation not subaliquoted |
Automated Processes3% batch failure rateNo open manipulations/closed system used throughout; all operations undertaken in isolator or automated system (background C cleanroom)Equipment partially automateda: two isolators, one automated system, one incubator Equipment fully automatedb: one isolator, two automated systems, one incubator Media preparation subaliquoted |
ª Other equipment comprises benchtop centrifuge, water bath, controlled-rate freezer, pipettes, laminar-flow hood (QC), nucleocounter, refrigerator, liquid nitrogen storage, balance, freezer, autoclave; b equipment used exclusively for automated processes includes tube welder, tube sealer, and buffer/media prep station. |
The baseline process follows typical manual laboratory operations and use of conventional two-dimensional planar cell expansion technologies such as cell factories for anchorage-dependent cells. Manual operations consisted of open manipulations (carried out within grade A biosafety cabinets) and included cell selection, expansion, enrichment, wash, and formulation. Other manual operations used standard laboratory equipment such as incubators, bench-top centrifuges, and so on.
Compared with processes for traditional biologics, autologous cell therapy manufacturing is very manual and labor intensive. It comprises many handling steps (e.g., density gradient cell processing, washing, and feeding) that require considerable interventions from skilled operators. Rejection of products due to contamination is a concern because of the long culture times required and the large number of manual interventions (e.g., manual washes, feeds and cell manipulations in open culture settings) that occur within a manufacturing process. In addition, maintaining process consistency across multiple manufacturing operators and process steps can be difficult, as can assuring compliance with established product quality standards.
To account for the high skill and time demands on cleanroom personnel to make such complex products, increased manual interventions, and associated increased risk of failure of the autologous cell therapy manufacture, the baseline model assumed a requirement of 3.3 times more hands-on operations than for traditional biologics process. This value was calculated based on the number of manipulations that occur within each different process. For example, the cell therapy baseline process in Figure 1 consists of a total of 50 process steps that require manual intervention, whereas a traditional biologics process would have an average of 15 unit operations, composed in its entirely of automated process steps. As a result, assuming that those automated steps have some level of manual interaction (and based solely on the reduction of the number of steps), a typical biologics process requires about 3.3 times less manual intervention than the current cell therapy process. Given that failure rates of current biologics manufacturing process fall within 3% (8) and applying the previous calculated figure for cell therapy manufacture, the baseline model used an increased failure rate of 10%.
The baseline process team to support manufacture of DCs was in line with the number of personnel used for laboratory operations in a GMP environment. We assumed a minimum of two operators to be required for all operations. The production operations team consisted of four people (including one supervisor), the quality team was made of three people responsible for quality assurance (QA), quality control (QC), and microbiology testing.
The media required for processing were prepared fresh when required for a particular process step. Media components were not subaliquoted to meet specific process requirements. The container in which the media component was purchased would be used directly for processing. Once it was opened, the remaining contents were discarded after use (on a “per step” basis). The model accounted for costs associated with QC testing for in-process analysis of cell concentration, viability, identity, sterility, endotoxin, and mycoplasma as well as DC product release testing by immunophenotyping.
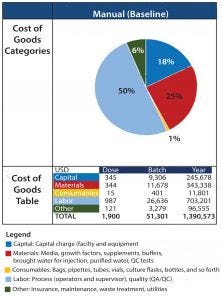
Figure 2: Summary of cost of goods breakdown per process
Cost Breakdown of Baseline Process
Figure 2 shows results of CoGs analysis of the baseline process based on assumptions listed previously. Labor was the greatest cost (at 50%) among cost categories, with an overall estimated cost per patient (per batch) of 51,301 USD. As a result, the top priority becomes streamlining the process to reduce direct manual intervention and personnel (including the improvement of associated risk of failure) for each operation.
The second biggest cost driver is materials (25%), which include solutions used for processing and associated in-process and release QC testing. For the baseline process, we assumed that solutions were not to be aliquoted. The effect of approaches to reduce waste could be evaluated further to reduce these costs.
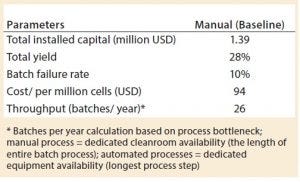
Table 2: Key process metrics
Under the current assumption of a batch failure rate at 10%, 26 batches can be accomplished within a year in the baseline process platform to produce autologous DCs (Table 2). Based on the number of cells produced per batch and the resulting cost, that is equivalent to a cost per million cells of 94 USD.
Sensitivity Analysis: Process Failure Rates
To ensure that such cell therapies can meet patients’ needs, manufacturing processes must be consistent across multiple operators and process steps to ensure compliance with established product quality standards. To understand the effect on CoGs, manufacturers can conduct a sensitivity analysis that evaluates the risk of the failure of the entire process of delivering target cells at reproducible quality suitable for reinjection into patients.
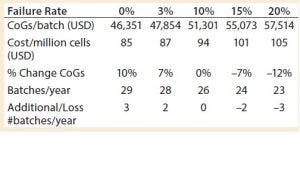
Table 3: Sensitivity of baseline process to failure rates
Varying the overall process failure rates from 0% to 20% (baseline process set at 10%) had a significant effect on the cost of DC treatment per patient, increasing or decreasing the cost per batch proportionally by up to 12% (Table 3). Matching a traditional biologics process failure rate of 3% meant that an additional two batches per year could be produced, with a reduced cost of 87 USD per million cells.
In BPI’s April issue, part 2 of this article covers opportunities for cost reduction and reveals the costs associated with the introduction of automation. We explore strategies for increasing throughput to meet rising demand through the analysis of net present cost (NPC).
References
1 Heathman TRJ, et al. The Translation of Cell-Based Therapies: Clinical Landscape and Manufacturing Challenges. Regen. Med. 10(1) 2015: 49–64.
2 Lopes AG, Sinclair A, Titchener-Hooker NJ. Inactivated Poliovirus Vaccine Made in Modular Facilities with Single-Use Technology Potential for Local, Sustainable Production in Low- and Middle-Income Countries. BioProcess Int. 11(9) 2011: S12–19.
3 Xenopoulos A. A New, Integrated, Continuous Purification Process Template for Monoclonal Antibodies: Process Modeling and Cost of Goods Studies. J. Biotechnol. 10(213) 2015: 42–53.
4 Palucka K, Banchereau J. Cancer Immunotherapy Via Dendritic Cells. Nature Reviews 12, 2012: 265–277.
5 Sundarasetty BS, et al. Lentivirus-Induced “Smart” Dendritic Cells: Pharmacodynamics and GMP-Compliant Production for Immunotherapy Against TRP2-Positive Melanoma. Gene Therapy 22, 2015: 707–720.
6 Guillerme JB, et al. Measles Virus Vaccine–Infected Tumor Cells Induce Tumor Antigen Cross-Presentation by Human Plasmacytoid Dendritic Cells. Clin. Cancer Res. 19(5) 2013: 1147–1158.
7 Nava S, et al. An Optimized Method for Manufacturing a Clinical-Scale Dendritic Cell-Based Vaccine for the Treatment of Glioblastoma. PLoS ONE 7(12) 2012: e52301.
8 Langer ES. Biotech Facilities Average a Batch Failure Every 40.6 Weeks. BioProcess Int. 6(8) 2008: 28-30.
Adriana G. Lopes is principal consultant engineer at Biopharm Services. Corresponding author Andrew Sinclair is managing director at Biopharm Services Ltd. Unit 1, Chess Business Park, Moor Road, Chesham Bucks HP5 1SD, UK; +44-1494-578-011; [email protected]. Bert Frohlich is principal consultant and owner at Biopharm Designs (Boston, MA).
You May Also Like


