Demonstrating Scalable T-Cell Expansion in Stirred-Tank BioreactorsDemonstrating Scalable T-Cell Expansion in Stirred-Tank Bioreactors
PHOTO BY ERIC SCHOLLENBERGER
Emerging cell therapies have excited the pharmaceutical industry because they indicate potential new pathways to treat some of the most life-threatening diseases. T-cell therapies currently are the flagship technology in cell therapy with recent US FDA approvals of Novartis’ Kymriah (tisagenlecleucel) and Gilead’s Yescarta (axicabtagene ciloleucel) treatments. Those therapies and others still in development use peripheral blood isolated lymphocytes (PBLs) modified with chimeric antigen receptors (CARs) or modified T-cell receptors (TCRs) to trigger the innate cytotoxic response of these immune cells for specific tumor types (1, 2). Coupled with the safety of an autologous therapy, CAR and other T-cell–based treatments serve as powerful and unique tools for treating a range of diseases in oncology and other areas of medicine.
With regulatory recognition of the efficacy of such treatments comes the realization of manufacturing hurdles that need to be resolved for large-scale product distribution. One critical bottleneck in cell processing is culture expansion that can produce consistently high yields (3). For suspension cultures (like those used to produce CAR T-cell therapies) the leading technology uses rocking-bag bioreactors (e.g., Xuri cell expansion system from GE Healthcare) (4). Growing cells in culture bags has proven efficacy and is currently standard practice in the industry, but concerns about limited scalability remain for autologous and allogeneic therapies.
The concerns are twofold: First, opportunity costs are significant for companies choosing a culture method with a large footprint to use in a cleanroom environment with a high cost per square foot. Second, questions have been raised about whether mass-transfer limitations are capping growth prematurely. The answer to some of these concerns might come from following the example of biopharmaceuticals and using stirred-tank bioreactors. However, no published work has yet demonstrated human immune cell expansion in such an environment. The ambr 15 microbioreactor system (Sartorius, Göttingen, Germany) could provide a small-scale model for a robust and potentially scalable solution for suspension cultures — as demonstrated for Chinese hamster ovary (CHO) cell lines and biologics production.
Rocking-motion bioreactors with high perfusion rates have been shown to reach consistent cell densities of 1 × 10⁷ cells/mL, which has allowed current treatments to meet dosage requirements based on most donor material (5). With the expense of culture experiments, the cost for supplies for studies using traditional bioreactors is prohibitive. Although multiple platforms can be used for high-throughput culture development, extensive studies of the ambr 15 microbioreactor established it as an effective and representative process development system for small-scale, cost-efficient, high-throughput culture analysis platform (6–11). Our study uses it to answer questions about shear stress and cell microenvironment in a turbulent, impeller-driven mixing environment.
The microbioreactor system is a fully automated platform that controls key parameters in up to 48 bioreactors at a time. Each vessel is monitored for dissolved oxygen (DO) and pH using two imbedded sensors. A gas overlay of air and CO2 with base additions is used to control DO and pH. The system is equipped with a liquid-handling robot to perform additions and sampling with the speed and accuracy capable of running a perfusion mimic process.
Expansion of T-cells in the system would have significant commercial and clinical implications because such results can be extrapolated to more commercially relevant, larger-scale, stirred-tank bioreactors. Our study first evaluates proof-of-concept for growing healthy donor-derived T-cells from three unique donors (sourced from Hemacare) in a stirred-tank bioreactor. Based on the initial research included in this study, ambr 15 microbioreactor conditions were optimized and growth was compared with batch-fed and static cultures.
Material and Methods
Starting Material: This study was conducted with negatively selected CD3+ cells obtained from apheresis collections of three unique, volunteer donors (from Hemacare). From each donor, 50 × 106 cells rested overnight in X-VIVO 10 cell media (Lonza), 5% human AB serum (Gemini), and 100 U/mL IL-2 (R&D Systems). Before splitting the cells into individual cultures, we activated the cells following a common clinical manufacturing method of incubation with CD3/CD28 T-cell activation beads (Life Technologies) at a ratio of 3:1 beads to cells for 30 minutes on a rocking platform.
Static Cultures: We plated 4 mL of cell suspension at 1 × 10⁶ cells/mL in triplicate from each donor into a six well plate (Nunc). For each sampling point, we took 250 µL of the culture and replaced it with 250 µL of cell media. The plates were stored in a humidified incubator at 37 °C and 5% CO2 for 13 days.
Fed-Batch Cultures: Starting with T-25 flasks (Corning), we added 4 mL of prepped cell suspension at 1 × 10⁶ cells/mL to them for a total of three flasks from each donor. The flasks were placed in an upright conformation for 13 days. We took a 250-µL sample at each sample point. After cell enumeration, the culture volume was expanded to maintain a cell concentration of 1 × 10⁶ cells/mL. When culture volumes exceeded 20 mL, we transferred them into T-75 flasks (Corning). We stored those flasks in an incubator at 37 °C and 5% CO2 for 13 days.
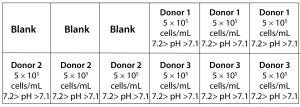
Figure 1: Layout of an ambr 15 culture station used in this study.
Bioreactor Cultures: We manually filled the bioreactors with 6 mL of cell media and allowed them to equilibrate to pH, DO, and temperature set points of 7.2–7.1, 50%, and 37 °C, respectively, 24 hours before inoculating the vessels. A compressed-air overlay augmented with CO2 controlled the dissolved gasses to better mimic the conditions of an incubator. Vessels were inoculated with 5 × 10⁶ cells and cultured in a total volume of 10 mL. Each culture station contained three vessels with cells from donors 1, 2, and 3 for a total of 18 bioreactors (Figure 1). We filled three empty vessels with 10 mL of media and left them as blanks to ensure consistent heat exchange throughout the culture station. Vessels in one culture station had a 50% media exchange performed every other day, and we performed a 35% media exchange in the other culture station each day.
For the first five days of culture (days 0–4) in the microbioreactor, cultures were static. Stirring was turned on for 10 minutes before the sampling point on day 2 to collect a well-mixed sample. On day 5, we turned on agitation at 300 rpm with downward stirring, started 1M bicarbonate base additions, and initiated the perfusion mimic schemes for both culture stations. We stopped agitation for an hour before media removal and set the sample height to that of the intermediate volume to reduce cell loss. We suspended pH control until 10 minutes after agitation was restarted as part of the perfusion mimic design. Cell media is used to replace spent media with respect to that vessel’s perfusion scheme.
The ambr liquid handler performed all sampling steps by sampling 250 µL from each bioreactor. Every second sample was used to standardize the imbedded pH sensor to an offline pH meter (Thermo Scientific). We based calculations of the power input by the impeller into the ambr 15 vessels on an empirically measured power number (P0) of ~2.1 (8).
Analytical Methods: We obtained samples from each culture on day 0, 2, 5, 7, 9, and 13. Cell count data was collected using Via-1 cassettes on the NC-200 system (Chemometic), and nutrient and metabolite data was collected with a Cedex Bio Analyzer system (Roche). We used Cedex data to calculate nutrient consumption and metabolite production per day using the formulas V(C2 – C1)/t for days without perfusion and ((V2C2 + VperfCmedia) – V1C1)/t for days with perfusion, where V2 and C2 are the concentration and volume on the date of sampling. V1 and C1 are the concentration and volume of the previous sampling date, t is the time in days separating the sampling points, and V2 + Vperf = V1. We analyzed samples following the manufacturer’s preferred procedures for both instruments.
We conducted surface marker analysis using a FACSCanto II flow analyzer (Becton-Dickinson). A cocktail of CD3/CD4/CD8/CD45 conjugated with FITC/APC/PE/PerCP fluorochromes was used with an isotype cocktail to analyze cell populations (Becton-Dickinson). We mixed 100 µL from each culture with the antibody cocktail and mixed 100 µL from each culture group with the isotype cocktail, then incubated them in the dark for 30 minutes. The volume of each tube was augmented with 1 mL phosphate-buffered saline (PBS) (Lonza) and centrifuged at 300g for 8 minutes. We aspirated 1 mL of supernatant and replaced it with 1 mL of PBS. Once the samples had been washed, we analyzed the tubes for cell phenotype.
To determine the significance of cell growth data, we analyzed results using a two-tailed, paired t-test. Donor variation was accounted for by pairing the donor control and variable results together for the t-test. The test was conducted on Microsoft Excel through a data analysis extension.
results This study had two objectives: The first was to demonstrate that proliferation of T-cells in stirred-tank bioreactors is possible, which includes establishing key conditions and expected cell density in a target culture system without perfusion. The second was to optimize bioreactor growth conditions to prove that the ambr 15 system offers a favorable comparison as a development platform for T-cells with batch-fed, static cultures.
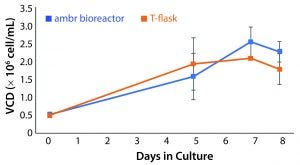
Figure 2: Viable cell density (VCD) of T-cells cultured in an ambr 15 microbioreactor system and static T-flasks for eight days showing similar growth kinetics and final cell densities in both conditions (n = 24).
Assessment of Ambr 15 Stirred-Tank Microbioreactors as Potential CD3+ Cell Culture Vessels: Common theory around T-cell culture expansion promotes the importance of maintaining the cell microenvironment created by activated cells to enable sustained growth. The culture needs to be balanced with mass transfer effectors to maintain this environment and sustain growth at increasing cell densities. Consequently, we must demonstrate first that impeller-driven mass transfer does not disrupt necessary conditions for cell growth. Cultures in the microbioreactor reached an average density of 2.54 × 10⁶ ± 0.41 × 10⁶ cells/mL. Static T-flask cultures reached a cell density of 2.08 × 10⁶ ± 0.014 × 10⁶ cells/mL. Results from those cultures provided justification for further investigation and form the basis for bioreactor conditions (Figure 2).
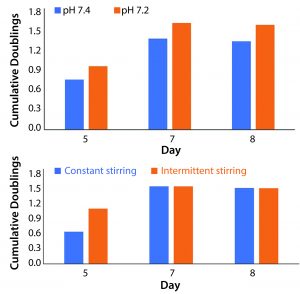
Figure 3: Average population doublings from all three donors for cells cultured in (A) different pH values and (B) different stir regimes were used to establish benchmarks that could be built upon through further experimentation (n = 12 for both data sets). Trends showing increased cell division at a pH of 7.2 and a relatively reduced lag phase with intermittent stirring (combined with literature review) educated subsequent research. Results shown here do not represent statistically significant findings.
Process Variables Chosen to Optimize Culture Expansion: Data from the first study directed our choice of process variables in the subsequent work. When we controlled pH at 7.2, we observed increased cell proliferation across all time points when compared with those at higher pH values (Figure 3A). These results were corroborated by literature review of T-cell culture conditions.
We compared a stirring regimen of alternating two-minute stirring periods and a regimen without rest. Constant stirring at 300 rpm results in a power of 5.04 × 10⁻⁵ W and a specific power input of 5.04 W/m3. Increased stress from constant stirring did not reduce overall growth. However, periods of rest increased rates of growth at the beginning of each culture (Figure 3B). Both regimes indicated a suspended lag phase when compared with static cultures.
Perfusion Mimic with the Microbioreactor System: Perfusion resulted in an average 4.84% loss of cells per iteration. Steady state of metabolite concentrations at peak growth rates reached the 7.0 g/L and 4.5 g/L thresholds for growth inhibition by lactate and ammonia, respectively. Those values were established by studies that used unmodified T-cells grown in rocking and static cultures (12).
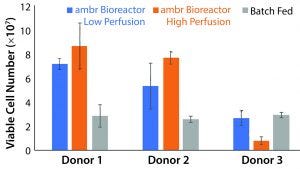
Figure 4: Peak viable cell number for each culture scheme and donor (n = 3). The ambr 15 system showed statistically significant improvements over static cultures with high perfusion rates (p = 0.0059, t stat = 4.59), but the low perfusion rates did not result in statistically significant improvements (p = 0.61, t stat = 0.537). Donor 3 cell populations adjusted poorly to the vessel environment, but showed similar growth capacity in batch-fed cultures. Higher rates of media exchange correlated to increased cell density for donor populations that took to impeller-mixed systems.
Comparison of Growth Rates: Based on our conclusion that the ambr 15 microbioreactor system using a culture scheme that imparts up to 5.04 W/m3 of work is suitable for T-cell growth, we conducted a study to compare the capabilities of such a culture with those of common batch-fed cultures. We maintained a static culture without feeding to establish comparability with the results from the previous experiment. Each donor’s cells showed different degrees of success, with the highest observed viable cell number being 8.83 × 10⁷ (Figure 4). Based on those data, we expected an average threefold increase in peak cell number for the low-perfusion scheme and a fourfold increase for the high perfusion scheme over batch-fed cultures. However, one donor’s cells performed markedly worse in an agitated system, and higher perfusion rates reduced yield. The low-perfusion culture and its batch-fed counterpart reached 2.66 × 10⁷ and 2.92 × 10⁷ average viable cells, respectively, and the high-perfusion cultures saw negligible growth to an average peak cell number of 7.91 × 10⁶. Calculated with a single-factor analysis of variance (ANOVA), a significant increase in peak cell number was achieved with the ambr bioreactor cultures in both perfusion schemes with respect to the control. Static cultures consistently had lower peak cell numbers because cell death was triggered by sustained lactate concentrations >7.0 g/L and ammonia concentrations >3.5 mmol/L between culture day five and seven. Before critical metabolite levels were reached, cell number trended similarly to batch-fed cultures peaking at 1.09 × 10⁷, 1.20 × 10⁷, and 1.30 × 10⁷ viable cells for donors 1, 2, and 3, respectively.
We expected cell growth to outpace standard cultures. However, initial growth rates for static cultures remained higher. Growth rates in the ambr vessels averaged 6.20 × 10⁵ cells/day for the first two days as opposed to 6.40 × 10⁵ for batchfed cultures. Bioreactor expansion did not outpace controls until the fifth day of culture. After that point, sustained rates were between 7.15 × 10⁶ and 1.72 × 10⁷ cells/day.
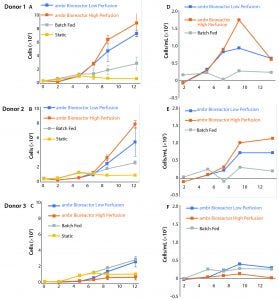
Figure 5: (A–C) Growth curves from donors 1, 2, and 3 are compared independently with their control cultures. Even with the addition of a multiple-day period without agitation to allow cells to adjust to the bioreactors, growth was suspended in the ambr vessels for four days. The control cultures show consistent growth across all time points. (D–F) Average growth rates for donor cultures show an initially negative rate that rapidly increases (n = 3). The largest sample-to-sample increase in growth rate occurs between days 5 and 7, but growth rates fell or remained static after day 9.
Figure 5 shows the stagnation or decrease in cell proliferation that occurs in all cultures after the ninth day of culture. This trend affected all three donor cultures, which were at different stages of their culture growth, had different nutrient and metabolite concentrations, and had different cell numbers.
Glucose Consumption Rates: The low-perfusion scheme included an addition of 12.1 mg/day of glucose. High perfusion corresponded to an addition of 16.9 mg/day. The 12.1 mg/day of glucose was exceeded by 2.9 mg/day during the highest growth period of those cultures, and the deficit was prolonged enough for glucose concentrations to fall below 0.50 mg/mL to an average value of 0.23 mg/mL. The highest consumption rate achieved was 16.9 mg/day. The lowest average glucose concentration measured for high-perfusion cultures was 0.66 mg/mL (Figure 6).
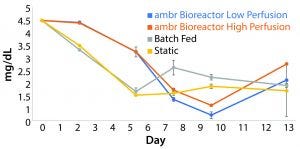
Figure 6: The average concentration of glucose in each culture condition containing cells derived from donor 1 (n = 3); data show that glucose is consumed at a higher rate than it is replenished in both perfusion schemes during periods of high growth. The glucose concentration in batch fed and static cultures fell consistently through the fifth day in culture before leveling off.
Metabolite Inhibition: Lactate concentrations asymptotically approached a concentration of 7.6 mg/mL. Media exchange per day of 25% was insufficient to prevent concentrations from reaching maximum levels demonstrated by the nonmanipulated control cultures, and concentrations reached 7.58 mg/mL. The high-perfusion scheme reached a steady state below the upper bound at 7.19 mg/mL. Without media additions, lactate built up to concentrations of 7.63 mg/mL ± 0.15. The data show a correlation between sustaining a concentration above 7.0 mg/mL and increased production of lactate dehydrogenase (LDH), an indicator of cell death (Figure 7).
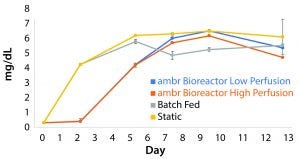
Figure 7: The build-up of lactate in cultures containing cells derived from donor 1 indicate the existence of a maximum survivable concentration of the metabolite (n = 3). The peak concentration for each culture condition correlates with a reduction in growth rate.
Flow Data: We conducted flow cytometry to evaluate cell populations at the termination of the culture for phenotypical changes compared with the starting material. The starting cell populations had very high purities of CD3+ cells at 96.27%, 98.55%, and 98.81% from donors 1, 2, and 3, respectively. The CD4–/CD8– population decreased for all cultures from a starting value of 4.08% of CD3+ cells to 0.39% for batch-fed, 0.77% for low perfusion, and 0.75% for high perfusion cultures. CD4+/CD8– and CD4+/CD8+ phenotypes increased after the culture period as well. The CD3+ population showed no significant change as a percentage of total cells (Figure 8).
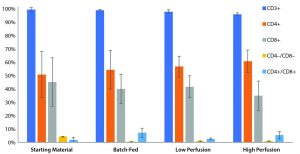
Figure 8: Common T-cell phenotypes visualized to highlight changes across different culture types. The CD3+ population is represented as a percentage of total cells, whereas the other phenotypes are percentages of CD3+ cells. All three culture types exhibit similar changes in population, a loss of CD4 –/CD8– populations and a gain of CD4+/CD8- and CD4+/CD8+ populations.
Discussion
With the need to culture reliably sufficient large cell populations to meet dosage requirements for cell-based treatments becoming more urgent, new culture techniques should be developed that use materials most efficiently while lowering the cost of goods. The ambr 15 microbioreactor system provides a high-throughput system to illustrate the benefits of current bioreactor technologies rapidly and identify where further development work might be necessary. The industry has recognized the potential for bioreactors to meet the growing manufacturing needs of cell therapies (13, 14), but proven efficacy is needed to spur investment in such technology. Because of the correlation between the ambr 15 system and commercial-scale bioreactors (8, 15), we used it to illustrate a proof of concept for expansion of T-cells in stirred-tank bioreactors, which has not been shown to date. Two culture studies were performed on this platform to establish impeller-driven bioreactors as a viable option for the proliferation of T-cell cultures.
The first proof-of-concept run established that no obstacle inherent to stirred-tank bioreactors needed resolution before investing in a direct-comparison study. Those data confirmed that cultures can reach the same density as standard T-flask cultures under the same circumstances. The main isssue posed concerned the fragile microenvironment necessary for healthy T-cell development (16). It seemed likely that agitation was partially disturbing that environment at low cell concentrations, thus resulting in a suspended period of growth arrest to begin the culture. Cultures preferred the lower pH value of 7.2, which some research suggests might be still higher than the optimum pH for human T-cell expansion (17). Both observations guided the experiment design for the multidonor comparison study.
Adding a rest period to the beginning of the bioreactor cultures helped to reduce the lag phase, but there was still a significant loss of cells during that period. Before the agitator is turned on, there is no design difference between the batch-fed cultures and the bioreactor cultures. Both are supplied with an overlay of air plus 5% CO2, and the culture media are the same. But the footprint of the ambr 15 vessels is smaller than that of a T-25 flask. That difference could create mass-transfer inefficiencies because cells build up on the bottom of the vessel, leading to cell loss. In future development, short periods of agitation could be added during the static phase to ensure that cells stay well mixed.
Because of the lack of a perfusion filter, perfusion mimic on the ambr 15 microbioreactor system reduces the final cell yield by almost 25%, assuming that the cells removed during perfusion would undergo the same growth as the rest of the culture. Without taking into account that significant and solvable reduction in yield, the stirred-tank bioreactors produced cell densities in line with what would be expected from cells cultured in other cell expansion systems with similar perfusion rates. More accurate representations of commercial-scale bioreactor cultures would be possible using a system designed with a true perfusion method. That would eliminate cell loss from a perfusion mimic and allow for rates of media exchange (100% and above), which is seen in high-density cultures (5).
Taking donor variability into account, rocking bioreactors achieve densities of 2 to 10 × 106 cells/mL when exchanging 50% of the media each day (5). With a perfusion rate of 35%, the stirred-tank bioreactors reached the top end of that range at 10 × 106 cells/mL. Those cultures had a substantially lower proportion of media exchanged and a perfusion mimic scheme that resulted in a loss of 20–25% of potential cell yield, yet they performed as well as fully developed, optimized technology. Furthermore, the growth data suggest that cell densities achieved in this study do not represent maximum values for each perfusion rate. T-cells from each of the three donors had correlating reduced growth rates with a similar time point across all donors and occurring when lactate concentrations exceeded 7.0 mg/mL, a concentration shown to inhibit cell growth even with pH controlled (12). In future experiments, adding CD3/CD28 microbeads at a ratio of 3:1 beads to cells on the ninth culture will be explored in hopes of demonstrating continued culture expansion. Adding a more robust phenotypic analysis of contaminants (CD14, CD19, CD56) and T-cell exhaustion (CD62L, CD25) pre- and postculture would provide a better understanding of the variation between donors.
A 10% increase in the rate of perfusion resulted in a 19.4% increase in peak growth rate. With true perfusion, higher degrees of media exchange can be explored, thereby leading to increased cell density and (potentially more important) higher growth rates. Increased rates of expansion could lead to reduced culture periods and shortened needle-to-needle timelines. Speeding up the manufacturing period would increase the feasibility of commercial-scale, patient-specific cell therapy by reducing equipment and capital expenditure needs (13, 14, 18). Our work focused on proof-of-concept for stirred-tank bioreactors as culture devices in T-cell therapy development and manufacturing. T-cells were chosen to reflect the need for robust manufacturing techniques in an industry that is showing heavy interest in CAR-T, TCR, and regulatory T cell (T-reg) immunotherapies. The development of more compelling culture technology will help to make cell-based therapies a reality for increasing numbers of patients.
Further Studies
T-cell based therapies quickly are becoming the leading technology in regenerative medicine, with the first two CAR-T products gaining FDA commercial approval in 2017. The culture expansion step is a key manufacturing unit operation that requires usually 10 days or more to produce the number of cells needed to treat a patient (19). Our study outlines a culture design for T-cells based on a stirred-tank bioreactor with a four-day static period followed by nine days of stirring and perfusion at media exchange proportions of 25% and 35% per day. Impeller-driven mass transfer resulted in a fourfold increase in cell number compared to the static, batch-fed controls at the conclusion of a 13-day culture period.
To determine the growth-limiting parameter, cell growth arrest between days nine and 13 should be investigated — controlling for metabolite levels using higher perfusion rates and activation by adding a restimulation unit process into the experiment design. Another area of future study is into the lag phase experienced after initial seeding into the ambr 15 microbioreactors. That observation should be compared with other agitated bioreactor systems as well as with static expansion systems to gauge the source of cell loss. Aspects of the culture that should be considered are the planar density of cells (cells/cm2), the gas transfer gradient (which would correlate directly with the depth of media), and mass transfer limitations.
Furthering the knowledge of human primary T-cell expansion is pertinent to developing more robust manufacturing protocols for emerging therapies. The results of this study demonstrate that a stirred-tank bioreactor system could be used for more efficacious T-cell expansion and reduced cost of goods with shortened culture periods.
References
1 Turtle CJ, et al. CD19 CAR-T Cells of Defined CD4 :CD8 Composition in Adult B Cell ALL Patients. J. Clin. Investigation 126(6) 2016: 2123–2138; doi:10.1172/jci85309.
2 Davila ML, et al. Efficacy and Toxicity Management of 19-28z CAR T Cell Therapy in B Cell Acute Lymphoblastic Leukemia. Sci. Trans. Med. 6(224) 2014: 224–225; doi:10.1126/scitranslmed.3008226.
3 Bradenberger R, et al. Cell Therapy Bioprocessing: Integrating Process and Product Development for the Next Generation of Biotherapeutics. BioProcess Int. 9(3) 2011: S30– S37.
4 Molleryd C, et al. Scaling up Clinical T-Cell Expansion in a Xuria Cell Expansion System. Cytotherapy. 17, (6) 2015; doi:10.1016/j.jcyt.2015.03.379.
5 Marenghi A, et al. Perfusion’s Role in Maintenance of High-Density T-Cell Cultures. BioProcess Int. 13(1) 2015: 18–26.
6 Rafiq QA, et al. Process Development of Human Multipotent Stromal Cell Microcarrier Culture Using an Automated High‐Throughput Microbioreactor. Biotechnol. Bioeng. 114(10) 2017: 2253–2266; doi:10.1002/bit.26359.
7 Xu S, et al. Improving Lactate Metabolism in an Intensified CHO Culture Process: Productivity and Product Quality Considerations. Bioprocess Biosys. Eng. 39(11) 2016: 1689–1702: doi:10.1007/s00449-016-1644-3.
8 Nienow AW, et al. The Physical Characterisation of a Microscale Parallel Bioreactor Platform with an Industrial CHO Cell Line Expressing an IgG4. Biochem. Engin. J. 76, 2013: 25–36; doi:10.1016/j.bej.2013.04.011.
9 Nienow AW. Mass Transfer and Mixing Across the Scales in Animal Cell Culture. Animal Cell Culture. Cell Engineering, Volume 9. Al-Rubeai M, Ed. Springer International Publishing: Switzerland, 2015; doi:10.1007/9783-319-10320-4_5.
10 Nienow AW, et al. Agitation Conditions for the Culture and Detachment of HMSCs from Microcarriers in Multiple Bioreactor Platforms. Biochem. Engin. J. 108, 2016: 24–29; doi:10.1016/j.bej.2015.08.003.
11 Hsu W-T, et al. Advanced Microscale Bioreactor System: A Representative Scale-Down Model for Bench-Top Bioreactors. Cytotechnol. 64(6) 2012: 667–678; doi:10.1007/s10616-012-9446-1.
12 Fischer K, et al. Inhibitory Effect of Tumor Cell– Derived Lactic Acid on Human T Cells. Blood 109, 2007: 3812–3819; doi:10.1182/blood-2006-07- 035972.
13 Heathman TR, et al. The Translation of Cell-Based Therapies: Clinical Landscape and Manufacturing Challenges. Regen. Med. 10(1) 2015: 49–64; doi:10.2217/rme.14.73.
14 Hambor JE. Bioreactor Design and Bioprocess Controls for Industrialized Cell Processing. BioProcess Int. 10(6) 2012: 22–33; doi:10.18411/a-2017-023.
15 Nienow AW. Reactor Engineering in Large-Scale Animal Cell Culture. Cytotechnol. 50(1–3) 2006: 9–33.
16 Brownlie RJ, Zamoyska R. T-Cell Receptor Signalling Networks: Branched, Diversified and Bounded. Nature Rev. Immunol. 13(4) 2013: 257–269; doi:10.1038/nri3403.
17 Carswell KS, Papoutsakis ET. Extracellular PH Affects the Proliferation of Cultured Human T Cells and Their Expression of the Interleukin-2 Receptor. J. Immunother. 23(6) 2000: 669–674.
18 Levine BL, et al. Global Manufacturing of CAR-T Cell Therapy. Molecular Therapy 4, 2017: 2–101; doi:10.1016/j.omtm.2016.12.006.
19 Kaiser AD, et al. Towards a Commercial Process for the Manufacture of Genetically Modified T Cells for Therapy. Cancer Gene Therapy 22(2) 2014: 75–78; doi:10.1038/cgt.2014.78.
Alex Klarer is a biomedical engineer and David Smith is senior biomedical engineer and department head, both at Innovation and Engineering, Hitachi Chemical Advanced Therapeutics Solutions, Allendale, NJ; Ryan Cassidy is a field application specialist at SartoriusStedim, Boston, MA. Thomas Heathman is business leader at Hitachi Chemical Advanced Therapeutics Solutions, Allendale, NJ. Qasim Rafiq is associate professor at University College London, UK.
Further Reading
Burns GF, et al. Surface Antigen Changes Occurring in Short-Term Cultures of Activated Human T Lymphocytes: Analysis By Flow Cytometry. Cellular Immunol. 71(1) 1982: 12–26; doi:10.1016/0008-8749(82)90492-0.
Eaker S, et al. Bioreactors for Cell Therapies: Current Status and Future Advances. Cytotherapy 19(1) 2017: 9–18; doi:10.1016/j.jcyt.2016.09.011.
Li F, et al. A Systematic Approach for Scale-Down Model Development and Characterization of Commercial Cell Culture Processes. Biotechnol.Progress 22(3) 2006: 696–703; doi:10.1021/bp0504041.
Maus MV, et al. Ex Vivo Expansion of Polyclonal and Antigen-Specific Cytotoxic T Lymphocytes By Artificial APCs Expressing Ligands for the T-Cell Receptor, CD28 and 4-1BB. Nature Biotechnol. 20(2) 2002: 143–148; doi:10.1038/nbt0202-143.
Nienow AW, et al. Bioreactor Engineering Fundamentals for Stem Cell Manufacturing. Stem Cell Manufacturing. Cabral JMS, et al., Eds. Elsevier: Amsterdam, Netherlands, 2016: 43–75; doi:10.1016/B978-0-444-63265-4.00003-0.
Rameez S, et al. High-Throughput Miniaturized Bioreactors for Cell Culture Process Development: Reproducibility, Scalability, and Control. Biotechnol. Progress, 30(3) 2014: 718–727; doi:10.1002/btpr.1874.
Ratcliffe E. A Novel Automated Bioreactor for Scalable Process Optimisation of Haematopoietic Stem Cell Culture. J. Biotechnol. 161(3) 2012; doi:10.1016/j.jbiotec.2012.06.025.
Ritchie DS, et al. Persistence and Efficacy of Second Generation CAR T Cell Against the LeY Antigen in Acute Myeloid Leukemia. Molecular Ther. 21(11) 2013: 2122–2129; doi:10.1038/mt.2013.154.
Wittmann C, Liao JC. Industrial Biotechnology: Products and Processes. Wiley-VCH Verlag GmbH & Co. KGaA: Weinheim, Germany, 2017; doi:10.1002/9783527807833.
Rafiq QA, et al. Scalable Manufacture for Cell Therapy Needs. Bioreactors: Design, Operation and Novel Applications. Wiley and Sons: New York, NY, 2016: 113–146; doi:10.1002/9783527683369.ch4.
You May Also Like


