Quantitative Risk Assessment of Limits for Residual Host-Cell DNA: Ensuring Patient Safety for In Vitro Gene Therapies Produced Using Human-Derived Cell LinesQuantitative Risk Assessment of Limits for Residual Host-Cell DNA: Ensuring Patient Safety for In Vitro Gene Therapies Produced Using Human-Derived Cell Lines
April 20, 2023
Viral-vector gene therapies (GTs) manufactured from cell-substrate production systems can contain residual amounts of host-cell DNA (hcDNA), which in a final product presents safety risks to treated patients. Therefore, drug manufacturers monitor and control residual hcDNA levels in purified products (1, 2). The US Food and Drug Administration (FDA) and other global regulatory agencies recommend tight, quantifiable limits for hcDNA levels: 10 ng/dose, with DNA fragments smaller than the functional gene size of 200 base pairs (bp) (3). However, because of the inherent nature of hcDNA encapsidation in viral capsids, the FDA permits GT manufacturers to minimize the amount and size of hcDNA based on risk assessment rather than requiring quantifiable hcDNA limits. Thus, manufacturers define their own hcDNA specification limits for final products based on risk assessments to ensure patient safety (4).
Such assessments are not necessarily straightforward, and they require methods and materials that might not be readily available. Here, I present a sample risk assessment methodology for evaluating hcDNA levels with respect to patient safety, described in the following sequence:
• Identify a possible risk event for residual hcDNA based on the nature of the manufacturing process and cell line.
• Determine the safety margin for the identified risk.
• Determine the frequency of risk occurrence in nature or from controlled studies.
• Estimate the frequency of the risk event per dose conservatively (under the worst-case conditions).
I detail the process for calculating the frequency of risk events (FR) identified for residual hcDNA impurities in GT products and provide an illustrative example for easy adaptation and implementation. The framework proposed herein is specific to viral-vector GT products manufactured using human-derived cell lines.
Step 1: Identify Risk Events for Residual hcDNA Impurities
The properties and risks associated with hcDNA depend on the manufacturing platform applied. Adenoassociated virus (AAV) vectors can be produced using either human-derived cells or insect cells. Compared with DNA from insect cells, human-derived hcDNA encapsidated within viral capsids has a higher risk of genotoxicity. Two types of genotoxic risk that have been identified from human-derived cell lines are oncogenicity and infectivity (5, 6), some mechanisms of which are below (7–9).
Inactivation of Tumor Suppression Gene (TSG): Residual hcDNA can integrate into genes that are responsible for cell-cycle control or into TSGs such as those encoding for tumor protein 53 (p53) and human retinoblastoma susceptibility (rb1). Loss of TSGs has been shown to cause certain human tumors.
Activation of a Protooncogene (POG): Integration of residual cell-substrate DNA can activate cellular regulatory genes by promoter/enhancer insertion, which could lead to the development of a neoplastic phenotype.
Introduction of a Dominant Oncogene: Residual hcDNA can contain dominant-activated oncogenes that could integrate with patients’ genes and then be expressed by their cells. Human embryonic kidney (HEK)293 cells and cervical adenocarcinoma cells (HeLa subtype) remain the most widely used human-derived cell lines for viral-vector production. Examples of dominant oncogenes include the adenovirus serotype 5 (Ad5) E1 gene in HEK293 cells and the human papillomavirus E6 and E7 genes in HeLa cells.
Introduction of an Infectious Agent: If the genome of a DNA virus or the provirus of a retrovirus is present in a cell substrate, then the residual hcDNA can upon patient inoculation produce infectious virus and thus establish a productive infection.
The immunomodulatory activity of DNA is a type of risk associated with extracellular DNA in a GT product that does not require gene expression. Vertebrates, including humans, have evolved such that their cells can recognize bacterial and viral infection by the presence of unmethylated cytosine–guanine dinucleotide (CpG) motifs in microbial DNA. Detection of such motifs stimulates an immune response.
Residual hcDNA in a GT product can contain immunostimulatory unmethylated CpG motifs. The extent to which those appear depends on the source of the residual DNA; CpG motifs are not normally present in human-derived cells. Therefore, residual hcDNA in viral vectors produced using human-derived cell lines has less immunogenicity potential than that from vectors manufactured with other substrates. However, immune responses to GT are caused by a combination of effects that depend on vector capsid type, vector load, and other encapsidated components, such as host-cell proteins (HCPs) and plasmid DNA (pDNA) (7, 10). Therefore, controlled studies often are performed to evaluate product immunogenicity. Consequently, the immunogenicity of residual hcDNA is beyond the scope of the risk assessment presented here.
Step 2: Determine Safety Margins for the Identified Risks
For genotoxic impurities with no identified threshold mechanisms, such as oncogenic and infectivity risks, the FDA Vaccines and Related Biological Products Advisory Committee (VRBPAC) considers a frequency of one in 10 million (10–7) to be an acceptable level of risk (7). Below are steps for assessing the risk of inducing an oncogenic event by activation of a POG or inactivation of a TSG.
Step 3: Determine Risk Frequency
Calculate the Probability of a Risk Event: Nonenveloped-virus infection starts when a virion binds with receptors on a cell’s surface to enter its endocytic pathway. Endocytosis is the mechanism by which many viruses enter into a host, reach the cell nucleus, and transfer their genetic material. In parallel, recipient host cells have developed many molecular mechanisms in their cytoplasm to limit transduction of viral genetic material before it reaches the cellular nucleus. Even after viral genes are introduced to the nucleus, not all such material can integrate into chromosomes. For instance, it has been reported that DNA molecules undergo ligations, mutations, and especially deletions after delivery into cells. Furthermore, in the case of AAV-vector GTs, hcDNA fragments packaged in the viral capsid are predicted to be single-stranded, making them unstable and increasing their potential for degradation upon release into cellular nuclei. Thus, as summarized in Table 1, DNA carried by AAV capsids must pass through multiple steps before activating a POG or inactivating a TSG (1, 8, 9).
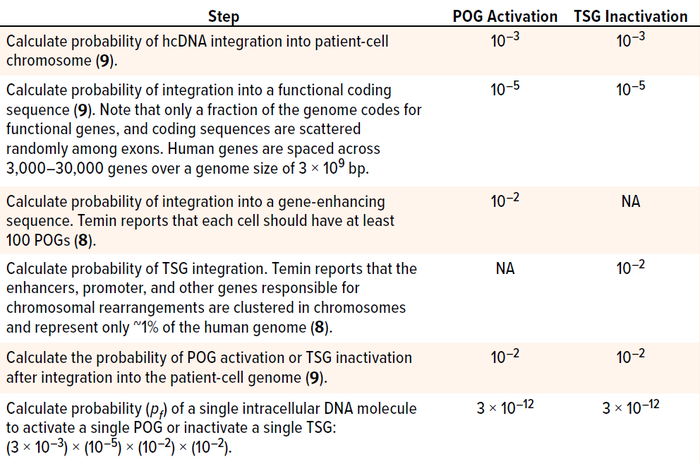
Table 1: Steps in determining the probability of protooncogene (POG) activation or tumor
suppression gene (TSG) inactivation by residual host-cell DNA (hcDNA) impurities in a
gene-therapy product; bp = base pairs.
The same goes for tumor formation. Activating one copy of a gene merely affects a cell’s phenotype. Likewise, inactivating just one copy of a TSG represents only a single event that, by itself, cannot turn a cell cancerous; it is not sufficient to form an entire tumor. To generate cancerous growth, both copies of a relevant TSG must be inactivated, two different TSGs must be destroyed, or more than two POGs must be activated. Hence, the probability of the risk event (pf) must be calculated for two independent events:

That aligns with the probability value of 10–19 × 10–23 reported by Peden et al. (11) for inducing an oncogenic event by integrating a DNA molecule (8, 9, 12).
Calculate the Number of Residual hcDNA Molecules: The amount of hcDNA (ng) per dose of a drug product can be calculated using Equation 1:

Equation 1
where dvg is the dosage of vector genome per kilogram of patient weight (vg/kg), Wtpat is the patient’s weight (kg), and chcDNA is the normalized concentration of hcDNA (pg/1013 vg).
For many AAV serotypes, reported doses have ranged from 2 × 10¹¹ vg/kg to 2 × 10¹⁴ vg/kg, with residual hcDNA limit values of 0.8 to 5 (105 pg/1013 vg) (13, 14). For the purpose of illustration, I selected random values for hcDNA limit and vector dose from within those reported ranges: 5 × 10⁵ pg/1013 vg and 2 × 10¹³ vg/kg, respectively.
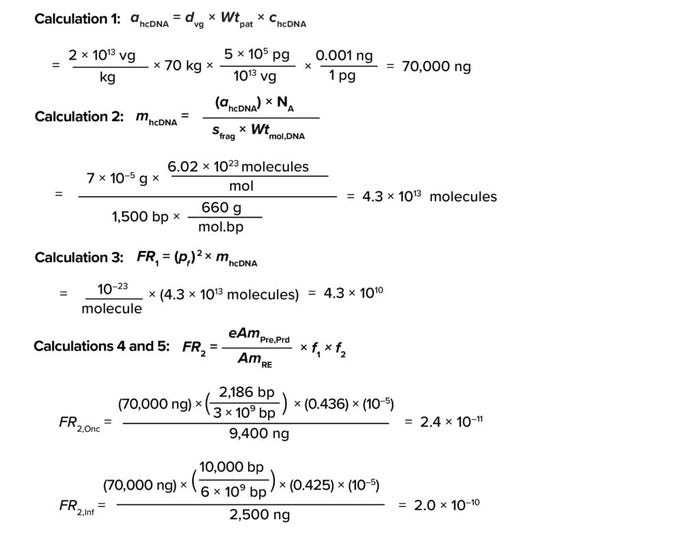
Based on information for Equation 1, the amount of residual hcDNA that could be present in a GT product (ahcDNA) for an average patient (70 kg) is 70,000 ng, as shown in Calculation 1.
Calculations
The number of residual hcDNA molecules per dose can be calculated using Equation 2:

Equation 2
where sfrag is the size of an hcDNA fragment, Wtmol,DNA represents the molecular weight of DNA (660 g per mole of a base pair (mol.bp)), and NA represents the Avogadro constant (~6.02 × 10²³ molecules/mole).
Fragment Size: In viral-vector manufacturing based on human-derived cell lines (using transfection with a plasmid, transduction with a helper virus, or stable expression systems), two types of hcDNA contaminants have been reported. The first type is process-related free-floating nonencapsidated hcDNA. The second is product-related hcDNA encapsidated in viral capsids. The former material can be digested effectively by nucleases such as Benzonase enzyme (MilliporeSigma) and can be removed using well-characterized purification techniques. However, clearing product-related encapsidated hcDNA is challenging because of its resistance to nuclease treatment and close proximity to the desired product (vector capsids) (15, 16).
The FDA has reported that contamination levels of 1–3% often are observed for nonvector DNA impurities in purified AAV products (17). Furthermore, encapsulated nontarget hcDNA fragments can range in size from 600 bp to 4,500 bp, with an average size of 1,500 bp (16). Taking a conservative approach, I assume for our purposes that hcDNA in the hypothetical purified product comes only from product-related encapsidated hcDNA.
Using the above assumptions, the number of molecules in residual hcDNA comes to 4.3 × 10¹³ (Calculation 2).
Thus, the frequency of risk (FR1) for inactivation of TSG or activation of POG by residual hcDNA impurities per dose of a finished product can be calculated using Equation 3:

Equation 3
As shown in Calculation 3, the frequency of risk comes to 4.3 × 10¹⁰.
Step 4: Estimate Risk Frequency per Dose Conservatively
The frequency of a risk event such as integration of a dominant oncogene or a gene that induces infection (FR2) is calculated from the ratio of the amount of impurity in a product to the amount of impurity that can cause a risk event, as represented by Equation 4:

Equation 4
Here, AmRE is the amount of DNA (ng) required to induce an oncogenic or infective event. The values for gene levels required to induce an oncogenic or infective risk event — 9,400 ng and 2,500 ng, respectively — were selected based on results from animal models reported by Sheng et al. (18) and Peden et al. (11). Sager has shown that human cells are more resistant to transformation than are the animal-model cells used for assays of viral oncogenes (19). Therefore, the values applied in my study are conservative for assessing risks to humans.
eAmPRe,prd is the amount of cellular DNA (ng) equivalent to presenting a single risk-event gene per cell compared with the amount of DNA required to induce an oncogenic or infective event. Those values are calculated as
demonstrated by Sheng-Fowler et al. (7) and data from the FDA Center for Biologics Evaluation and Research (CBER) (5, 11, 18–20) (Equation 5):

Equation 5
sRE equals the size of the oncogenic or infective gene (bp). Yang et al. report that oncogenic DNA in humans averages 1,925 bp in size, with a standard deviation (SD) of 87 bp (20). The conservative approach taken herein assumes the size of oncogenic DNA to be the average + 3 SD = 2,186 bp. I have taken the amount of gene required for inducing infectivity from Peden et al., who estimated a genome size of 10,000 bp based on animal models infected with human immunodeficiency virus (HIV) retrovirus (11).
shc,G represents the host-cell genome size (bp). A haploid genome size is used for oncogenic risk assessment, whereas a diploid genome size is used to evaluate infectivity. In this article, I assume use of HEK293 cells, which are the most widely applied human cells for AAV-based GT production. They exhibit two or more copies of each chromosome, and 30% of such cells are hypotriploid because they contain 64 chromosomes (just under three times the number of chromosomes in a haploid human genome). In a conservative approach, shc,G values of 3 × 10⁹ bp and 6 × 10⁹ bp are good approximations for the haploid and diploid genome size, respectively (21).
f1 is the fraction of hcDNA in a final drug product that is larger than or
equal to the size of the risk gene that causes the oncogenic or infective event. Krause and Lewis from CBER propose including the fraction of DNA size greater than or equal to the size of the risk-event gene in the host-cell genome of the producer cell line, as accounted for in Equation 4 (22).
For oncogenic risk assessment, f1 represents the fraction of genes ranging from the smallest oncogene to the maximum gene capacity of the AAV capsid (4,500 bp). Yang et al. (20) report that the average size of oncogenic DNA in humans is 1,925 bp with an SD of 87 bp. To take a conservative approach that incorporates the larger fraction of gene sizes, I assume that the smallest oncogene size is the average – 3 SD = 1,664 bp. Therefore, the f1 value for oncogenicity is the fraction of genes in the human genome with sizes ranging from 1,664 bp to 4,500 bp.
For infectivity risk assessment, f1 equals the fraction of genes ranging from the smallest infective gene size to the maximum gene capacity of the AAV capsid (4,500 bp). The smallest known human virus, hepatitis delta virus, has a genome size of 1,700 bp. Thus, in a conservative approach, that value can be selected as the lower end of the range for gene size. Therefore, the f1 value for infectivity is the fraction of genes with sizes ranging from 1,700 bp to 4,500 bp in the human genome.
Figure 1 shows gene-size distributions of the human genome, with size (log10) represented along the y-axis and cumulative normal frequency on the x-axis. The distribution shown in Figure 1 and statistical summary presented in Table 2 were created from data published by Whitlock and Schluter (23).
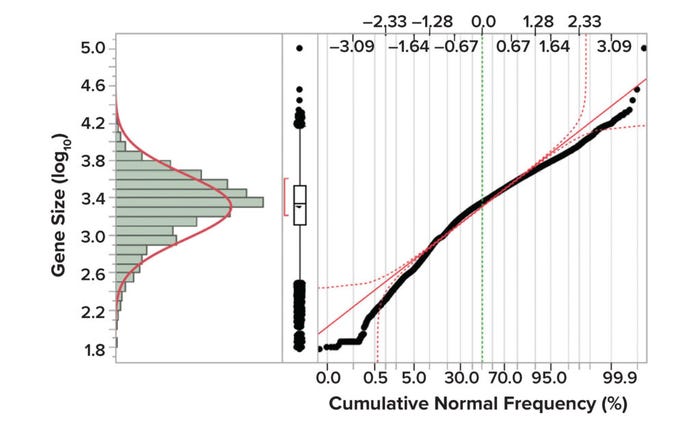
Figure 1: Gene size distributions in the human genome (23).
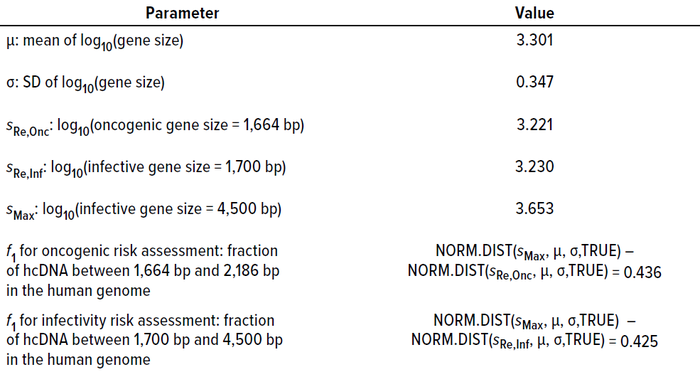
Table 2: Summary statistics of gene size distribution in the human genome and their bearing on calculating f1 values (23).
f2 is the probability of packing a functional gene into a vector genome. Risk events caused by any of the above-mentioned mechanisms, such as the integration of an activated oncogene or integration of viral DNA, are caused by a biologically active coding sequence in a DNA impurity. Only a fraction of the genome codes for functional genes, and such sequences are scattered randomly among noncoding exon sequences. Because human genes are spaced between ~3,000 bp and ~30,000 bp over a genome size of ~3 × 10⁹ bp, the predicted frequency of packaging a specific sequence from residual hcDNA is 10–5 (1).
Based on Equation 4, the frequency of risk for oncogenicity (FR2,Onc) and infectivity (FR2,Inf) events equal 2.4 × 10⁻¹¹ and 2 × 10⁻¹⁰, respectively (Calculations 4 and 5). Quantitative risk assessment based on the methodology described in Equation 3 shows that both FR2 values are substantially lower than the value of 10–7, demonstrating that the assumed hcDNA limits would be safe at the assumed vector dose.
The Need To Quantify Frequency of Risk
The mechanism by which hcDNA fragments are packaged within viral-vector capsids is not fully understood; therefore, control strategies in manufacturing processes have yet to be characterized thoroughly. Furthermore, because hcDNA is often encapsidated, it is difficult to clear completely from the purified-product stream. Other obstacles arise from hcDNA’s resistance to nuclease treatment and its proximity to the intended product. Regulatory agencies understand the complexities involved in reducing residual hcDNA levels and hcDNA fragment length in a purified viral-vector product. Thus, they recommend minimizing the level and size of hcDNA impurities in GT products based on risk assessment, ensuring patient safety based on evaluation of the host-cell line used for production, the manufacturing method, and the size of the residual genetic impurities (1). The risk-assessment methodology described herein represents one way to quantify the frequency of such risks.
References
1 Wright J. Product-Related Impurities in Clinical-Grade Recombinant AAV Vectors: Characterization and Risk Assessment. Biomedicines 2(1) 2014: 80–97; https://doi.org/10.3390/biomedicines2010080.
2 WHO TRS 987. Annex 4: Guidelines on the Quality, Safety, and Efficacy of Biotherapeutic Protein Products Prepared By Recombinant DNA Technology. World Health Organization: Geneva, Switzerland, 2014; https://cdn.who.int/media/docs/default-source/biologicals/biotherapeutics/trs_987_annex4.pdf?sfvrsn=d4ba378a_5&download=true.
3 Vernay O, et al. Comparative Analysis of the Performance of Residual Host Cell DNA Assays for Viral Vaccines Produced in Vero Cells. J. Virolog. Meth. 268, 2019: 9–16; https://doi.org/10.1016/j.jviromet.2019.01.001.
4 CBER. Guidance for Industry: Human Gene Therapy for Neurodegenerative Diseases. US Food and Drug Administration: Silver Spring, MD, 2006; https://www.fda.gov/media/144886/download.
5 Yang H. Establishing Acceptable Limits of Residual DNA. PDA J. Pharm. Sci. Technol. 67(2) 2013: 155–163. https://doi.org/10.5731/pdajpst.2013.00910.
6 Alsarraj M. What Should Researchers Know About Host Cell DNA Contamination Risks in Cell and Gene Therapies? STAT, 23 February 2022; https://www.statnews.com/sponsor/2022/02/23/what-should-researchers-know-about-host-cell-dna-contamination-risks-in-cell-and-gene-therapies.
7 Sheng-Fowler L, Lewis AM, Peden K. Issues Associated with Residual Cell-Substrate DNA in Viral Vaccines. Biologicals 37(3) 2009: 190–195; https://doi.org/10.1016/j.biologicals.2009.02.015.
8 Temin HM. Overview of Biological Effects of Addition of DNA Molecules to Cells. J. Med. Virolog. 31(1) 1990: 13–17; https://doi.org/10.1002/jmv.1890310105.
9 Kurth R. Risk Potential of the Chromosomal Insertion of Foreign DNA. Ann. New York Acad. Sci. 772(1) 1995: 140–151; https://doi.org/10.1111/j.1749-6632.1995.tb44739.x.
10 Yang H, et al. Statistical Methods for Immunogenicity Assessment. Chapman and Hall: New York, NY, 2015; https://doi.org/10.1201/b18761.
11 Peden K, et al. Biological Activity of Residual Cell-Substrate DNA. Developments in Biologicals (Basel) 123, 2006: 45–73.
12 Peden K. Issues Associated With Residual Cell-Substrate DNA (presentation). US Food and Drug Administration Vaccines and Related Biological Products Advisory Committee Meeting: Silver Spring, MD, 16 November 2005.
13 Maurya S, Sarangi P, Jayandharan GR. Safety of Adeno-Associated Virus-Based Vector-Mediated Gene Therapy — Impact of Vector Dose. Cancer Gene Ther. 29(10) 2022: 1305–1306; https://doi.org/10.1038/s41417-021-00413-6.
14 Kaspar BK, et al. Patent WO/2019/094253: Means and Method for Preparing Viral Vectors and Uses of Same. World Intellectual Property Organization: Geneva, Switzerland, 2019: https://patentscope.wipo.int/search/en/detail.jsf?docId=WO2019094253&_cid=P12-LEYV05-31621-1.
15 Hussong M, Bonifert T, Scheer N. Reduction of Product-Related Impurities During Production of Recombinant Adeno-Associated Viruses. BioPharm Int. 8 June 2022; https://www.biopharminternational.com/view/reduction-of-product-related-impurities-during-production-of-recombinant-adeno-associated-viruses.
16 Barnes LF, et al. Quantitative Analysis of Genome Packaging in Recombinant AAV Vectors By Charge Detection Mass Spectrometry. Molec. Ther. Meth. Clin. Dev. 23, 10 December 2021: 87–97; https://doi.org/10.1016/j.omtm.2021.08.002.
17 Cellular, Tissue, and Gene Therapies Advisory Committee. Briefing Document: Toxicity Risks of Adeno-Associated Virus (AAV) Vectors for Gene Therapy. US Food and Drug Administration: Silver Spring, MD, 1–2 September 2021; https://www.fda.gov/media/151599/download.
18 Sheng L, et al. Oncogenicity of DNA In Vivo: Tumor Induction with Expression Plasmids for Activated h-ras and c-myc. Biologicals 36(3) 2008: 184–197; https://doi.org/10.1016/j.biologicals.2007.11.003.
19 Sager R. Genetic Suppression of Tumor Formation. Adv. Cancer Res. 44, 1985: 43–68. https://doi.org/10.1016/s0065-230x(08)60025-1.
20 Yang H, Zhang L, Galinski M. A Probabilistic Model for Risk Assessment of Residual Host Cell DNA in Biological Products. Vaccine 28(19) 2010: 3308–3311; https://doi.org/10.1016/j.vaccine.2010.02.099.
21 Hardison RC. Working with Molecular Genetics. Pennsylvania State University: University Park, PA, 2002; https://www.bx.psu.edu/~ross/workmg/WorkingWith
MolecularGeneticsRCHwCover.pdf.
22 Krause PR, Lewis AM, Jr. Safety of Viral DNA in Biological Products. Biologicals 26(4) 1998: 317–320; https://doi.org/10.1006/biol.1998.0161.
23 Whitlock MC, Schluter D. The Analysis of Biological Data. 3rd ed. HW Freeman/Macmillan Learning: New York, NY, 2015.
Naveenganesh Muralidharan is senior engineer in the manufacturing science and technology (MSAT) group at Novartis Gene Therapies, 1940 USG Drive, Libertyville, IL 60048; 1-314-496-8483; [email protected].
The views and opinions expressed in this document are those of the author and do not necessarily reflect the official policy or position of Novartis or any of its officers.
You May Also Like

