How to Choose an Industrial Cation Exchanger for IgG PurificationHow to Choose an Industrial Cation Exchanger for IgG Purification
October 1, 2010
Cation-exchange chromatography is the third most used industrial method for antibody purification after anion-exchange and protein A affinity chromatography. It is most commonly used as an intermediate step but continues to attract attention as a capture method. This offers obvious cost and cleaning advantages over protein A but also imposes some sacrifices, all of which are discussed in a number of recent articles (1,2,3,4,5). Whichever application may be intended, end users seek a common set of performance characteristics. They include high capacity and recovery, high purification factor, a high degree of process control, high lot-to-lot reproducibility, and easy cleanability and sanitizability.
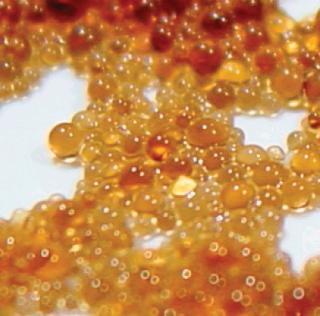
Chromatography media vendors have responded by introducing a continuum of new cation exchangers to better serve those applications. Given that they all strive to offer the ideal product, it might be expected that their capabilities would converge over time. That may happen, but the present selection of cation exchangers actually differ more from one another than they did 20 years ago. This results from their being synthesized with a greater diversity of particle architectures, from a greater diversity of polymers, and mostly exploiting one of many grafting techniques to increase ligand density and/or accessibility. Each product thus represents a unique mosaic of performance characteristics, with some features closely approaching the intended ideal and some less so.
PRODUCT FOCUS: MONOCLONAL ANTIBODIES AND OTHER PROTEINS
PROCESS FOCUS: PURIFICATION, CAPTURE, INTERMEDIATE PURIFICATION
WHO SHOULD READ: PROCESS DEVELOPMENT AND MANUFACTURING
KEYWORDS: CATION-EXCHANGE CHROMATOGRAPHY, PURIFICATION, MABS
LEVEL: BASIC TO INTERMEDIATE
Commercial performance data can help identify promising candidates for evaluation but typically do not include comprehensive competitive comparisons with other products. Users are left with that task. Unfortunately, no standardized approach has been suggested to meet this need. This article describes a limited set of basic experiments, the results from which can be used to support an objective determination of which exchanger best suits the needs of a particular application.
Capacity
Capacity has been a major focus for most recent-generation cation exchangers, with several now claiming dynamic binding capacities (DBCs) for IgG in excess of 100 g/L. As with most things, how you measure capacity influences the results that you get, yet vendor data are seldom accompanied by the procedures used to obtain them. It becomes impossible to draw valid conclusions about relative performance. Besides that, data from different sources are almost certainly obtained with samples that differ from one another, with no indication of how accurately any of them may represent your own materials. The “Estimation” box offers a comprehensive procedure for measuring dynamic capacity and includes options for evaluating elution and cleanability characteristics.
The two most common ways to determine dynamic capacity differ in the way an antibody is applied. The easier method uses off-line equilibration of the antibody to loading conditions. This method has two disadvantages: An excess amount of antibody has to be prepared for each set of conditions, and if antibody solubility is even minimally impaired under the selected conditions, it may invalidate the results and clog the column(s) being evaluated. The longer a prepared sample awaits loading, the more likely this is going to be an issue.
Antibody application by in-line dilution (ILD) is more complicated but avoids both limitations (6). Fully soluble antibody is applied through one pump, diluent buffer through another. They meet at the mixer. Residence time in diluted conditions is limited to the transit time from mixer to column, which may range from less than a second to a few seconds, depending on flow rate and the configuration of the chromatograph. After one experimental series has been completed at a particular dilution, another can be run at another dilution without a need to change the primary feed stream. This facilitates evaluating the effects of conductivity. It concurrently alters the feed concentration at the column inlet, which can create a source of error. But the error factor is equivalent across the exchangers being evaluated, so data remain suitable for comparing the performance of multiple exchangers. The process advantages and disadvantages of ILD are discussed in reference 7,.
One key requirement for comparing different exchangers is that a consistent breakthrough increment be used throughout a series of experiments. Breakthrough is generally understood to reflect the column load at which a column becomes saturated and subsequently loaded material simply flows through. The situation is more complicated on porous particle ion exchangers because loaded protein begins to break through long before the column approaches saturation. The mobile phase does not flow through the particles; it takes the path of least resistance: between the particles. Binding requires that proteins enter particle pores as they pass by particle surfaces. Thus, a given protein molecule may be swept through many strata of a column before it encounters an opportunity to bind, even though many unloaded binding sites remain. Every protein-binding event leaves less opportunity for the next protein to bind, to the point that some applied protein eventually fails to bind and exits the column. UV signal rises as an increasing concentration of protein “breaks through.” Breakthrough values for dynamic capacity determination are ultimately arbitrary. For industrial applications, values of 1, 5, or 10% are commonly reported. For experimental characterization of binding kinetics, 50% breakthrough is commonly used. As shown in Figure 1, the breakthrough increment strongly influences the capacity value you obtain. Pick a value that makes sense for your application and use that value consistently throughout your experiments.
Estimation of Dynamic Capacity, Resolution, Recovery, and Cleanability: Sample Application by In-Line Dilution
This procedure is written for an ÄKTAexplorer 100 (GEHealthcare Life Sciences, www.gelifesciences.com) plumbed with dark green PEEK tubing for applications up to 20 mL/min, but it can be adapted to any chromatograph with gradient capability, possibly with some manual intervention (16). The reference also provides a procedure for bulk loading. Refer to Figure 8 for representative results.)
For proteins, set the monitor to 280 and 300 nm. Monitoring at 300 nm will provide an on-scale trace if proteins exceed the range at 280 nm.
Plumb inlet A1 with feed stream.
Plumb inlet A2 with equilibration buffer.
Plumb inlet B1 with diluent buffer.
Plumb inlet B2 with elution buffer.
Plumb the sample injection valve with a 50-mL sup
erloop.Attach columns to be evaluated to the column selection valve.
Equilibrate Line A2. (Gradient, 0% B)
Equilibrate line B2. (Gradient, 100% B)
Equilibrate line B1. (Gradient, 100% B)
Fill the superloop with 2M guanidine-HCl, pH ~5.
Equilibrate all columns to be evaluated to line A2, then set the system so that all columns are off line. Zero the monitor.
Set gradient to 0% B. Set A inlet to A1, and equilibrate line A1. Continue flowing until the effluent reaches a constant UV absorbance. This may require 30–40 mL of feed during the first cycle, but about half that for subsequent cycles. This can be done at 5–10 mL/min. Collect the effluent.
Set the in-line dilution factor with the gradient maker. For example, to create an in-line dilution factor of 1:2, set the gradient maker to 66.7% B.
Continue flow until UV absorbance stabilizes. This value represents the 100% value from which% breakthrough determinations will be calculated.
Reduce flow rate to desired flow rate for the first column to be evaluate.
Set the system to simultaneously make a chart mark and put column of choice in line.
Continue loading sample until the desired breakthrough value is achieved. Measure the UV absorbance at the lowest point in the breakthrough curve. This equals 0% breakthrough. Calculate the difference in absorbance units between the 0% and 100% values. To determine the value for 5% breakthrough, multiply the difference between 0% and 100% by 0.05, then add this amount to the UV absorbance at 0% breakthrough. Calculate different breakthrough increments, if desired, accordingly. Measure the volume of sample from the chart mark to the point where absorbance reaches the target breakthrough value. Multiply the volume by the product concentration in the diluted feed stream.
If additional media are to be evaluated, make another chart mark as the next column is put in line.
When the last column has been evaluated, take the column out of line.
Stop flow. Set the A inlet to A2 and the gradient to 0% B. Re-initiate flow and collect the solute rinsed from the lines. Continue until UV signal reaches baseline. This can be done at 5–10 mL/min to save time.
Set the gradient to 100% B. Switch to inlet B2, and run B2 through the system until conductivity stabilizes at target value.
Reduce the flow rate to an appropriate value and put column 1 in line until it has eluted. The shape and width of the elution peak may provide worthwhile characterization of column performance characteristics. Collect the effluent.
If a second column is being evaluated, switch column 1 off line, and column 2 in line. Repeat as necessary to accommodate additional columns.
With the last column eluted and off-line, set the system (flow path) to inject, which will introduce the guanidine. Continue to flow until a steady conductivity value indicates that guanidine concentration has reached equilibrium. Re-zero the monitor.
Put column 1 in line until guanidine has brought UV absorbance to baseline. The size of any peak displaced by the guanidine may provide an indication of retarded elution. If the guanidine peak is substantial it may be worthwhile to pause the system for a period of time then re-initiate flow. Displacement of additional UV absorbance will tend to confirm retarded elution, likely due to slow diffusion of solute from deep within the pore structure of porous particle media.
If a second column is being evaluated, switch column 1 off line, and column 2 in-line. Repeat as necessary to accommodate additional columns.
Switch sample injection valve back to load.
If it is desired to evaluate another set of conditions, for example a different conductivity or pH value, replumb inlet B1 to the new diluent, then repeat instructions 10–29.
When all conditions have been evaluated, set the system to 0% B (inlet A2) and flush the system with A2. Pause the system and put the A1 inlet into buffer A2. Flush the system to clear the sample. Collect the effluent.
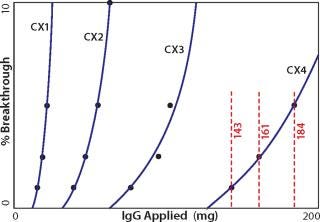
Figure 1: ()
Higher capacity values are generally obtained at lower pH because it increases the positive charge on protein amino residues. Capacity also increases with lower conductivity because there is less competition between dissolved ions and proteins for charged groups on the exchanger, but there are limits. When capacity is plotted over a range of conditions, there is usually an inflection point from which capacity decreases with decreasing pH or conductivity. The conductivity at which this point occurs and the intensity of the drop vary considerably from one antibody to the next (Figure 2, 3). The overall phenomenon has been attributed to bound antibodies decreasing the exchanger’s surface electronegativity (8,9). It probably also involves antibody solubility because IgGs tend to precipitate at low pH and conductivity (6). Precipitates, or transient aggregates on their way to becoming precipitates, are larger and have lower diffusion constants than single antibodies. Slower diffusion reduces the efficiency of diffusive mass transport into particle pores, reducing binding capacity.

Figure 2: ()
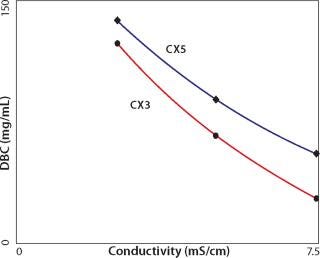
Figure 3: ()
With either explanation, the ability to achieve high binding capacities at moderate pH and conductivity values is beneficial. Feed stream dilution or diafiltration requirements will be reduced, and the antibody is more likely to remain fully soluble for the duration of a long sample-loading interval. Some vendors have suggested that their cation exchangers are “salt tolerant.” The term is understood to b
e relative, because even physiological conductivity is sufficient to prevent high-capacity binding for the majority of IgGs. For example, CX5 exhibits progressively higher capacity than CX3 with increasing conductivity, but by the time it reaches about half-physiological conductivity, capacity is only about 55 mg/mL (Figure 3). The conductivity curves for CX4 and CX5 are more nearly parallel, suggesting similar “salt tolerance” (Figure 2).
Purification Potential and Eluted Product Concentration
Fully loaded or overloaded columns severely stress the ability of chromatography media to fractionate bound materials efficiently. This is an unavoidable limitation of diffusive mass transport. During loading, diffusion is augmented by the electrostatic attraction of the exchanger to draw antibodies inside the pores where most of the binding surface area resides. At elution, high conductivity suspends that attraction, leaving only diffusion to transport the antibody back into the mobile phase. This causes peak broadening and is the reason why it is frequently recommended that flow rate be reduced for eluting highly loaded industrial columns. It partially compensates for inefficient diffusive mass transfer. In practice, the degree of peak broadening varies to a surprising degree from one cation exchanger to another, and it has important significance for industrial separations. Broader peaks are more dilute, and larger elution volumes increase the loading volume at the next process step. The deficiencies that broaden the antibody peak also broaden contaminant peaks. That means broader overlap of product and contaminants, which translates to reduced purification potential.
Pore architecture is likely to be a major contributor to variations in eluted peak width among exchangers. One strategy for increasing capacity of porous particle exchangers is to increase connectivity among pores. Zero connectivity describes a situation in which a protein can diffuse into a pore but exit only from that pore. A connectivity of two describes a situation in which a protein that enters a given pore may exit the same or a different pore. The higher the connectivity, the larger the accessible binding surface area and the higher the capacity (10). However, diffusive path length increases in proportion, causing pore residence time to do the same. At elution, where diffusive limitations already cause peak broadening, higher connectivity is likely to increase it further. Nonspecific interactions between antibody and exchanger surface may also be a factor.
Product Recovery
Whatever the reasons for peak broadening, having spent the time to load columns for capacity determination, it makes sense to exploit the opportunity to characterize elution properties. It is fair to say that more process-predictive results would be obtained from columns loaded only to the extent they would actually be loaded in industrial use. But for a first approximation, equally overloaded columns from the above capacity experiments provide a preliminary indication suitable for comparing different cation exchangers (Figure 4). As shown, eluted peak widths can vary by nearly a factor of 10. This goes beyond concerns about resolution from contaminants and extends to the issue of product recovery. When such dramatic differences are observed, it may be instructive to run a linear gradient elution with a small amount of antibody to see whether the same trend is apparent. Small injections show porous particle ion exchangers at their best. The small sample mass and brief time interval allow only shallow pore diffusion, reducing the lag from the time intrapore buffer conditions change, to the time when the protein can diffuse out to the mobile phase and elute from the column. Figure 5 illustrates low–mass-load and linear gradient elution of the antibody from Figure 4. The tailing factor is reduced in magnitude, but the pattern remains fundamentally the same. Comparing Figure 4 and 5 also shows that small sample application experiments reasonably predict serious peak broadening issues at high column loads. This makes it possible to obtain a quick preview with a small amount of antibody.
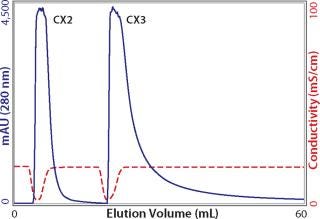
Figure 4: ()
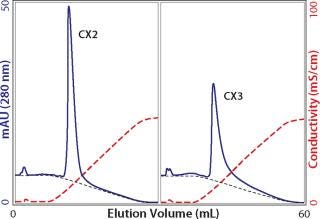
Figure 5: ()
Cleaning a column with 2 M guanidine after elution with NaCl can provide an indication as to whether peak spreading results from pore architecture, nonspecific interactions, or both. In addition to its high conductivity (~155 mS/cm), 2 M guanidine suspends hydrogen bonds and hydrophobic interactions. This should abolish nonspecific interactions along with remaining electrostatic interactions. Guanidine peaks with an area up to a few percent of the main peak are of no great consequence, but conspicuously large peaks warn of poor product recovery. Consider that the guanidine peak may be disproportionately enriched in aggregates, in which case the recovery loss may be a worthwhile investment. Buffer exchange the peak into a physiological buffer, and test it by analytical size-exclusion chromatography. If it is not highly enriched in aggregates, then it simply represents product loss.
Cleanability and Sanitizability
After washing to baseline with guanidine, allow the column to incubate for a few hours without flow, then resume flow. If yet another peak is detected, essentially the only explanation is that it derives from antibody that was initially bound so deeply within the pore volume that it required those extra hours to diffuse out. Under zero-flow conditions in guanidine, the unbound protein eventually reaches diffusive equilibrium with the mobile phase. The portion in the mobile phase elutes when flow is resumed (Figure 6). Beyond poor recovery, such peaks warn that cleaning may be compromised. The cleaning cycle will have to be extended to accommodate the long clearance time for molecules bound deeply within the pore volume. Additional experiments in which flow is stopped for different time intervals can help define the period necessary to achieve the desired level of pore clearance.
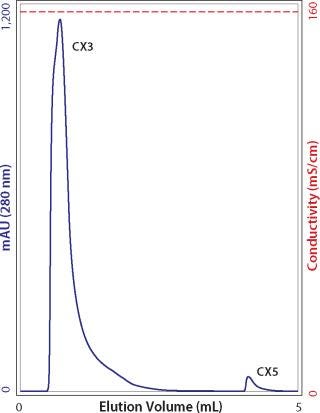
Figure 6: ()
It is prudent to specify that cleaning and sanitization be done under dynamic (flowing) conditions. Under static conditions (described above) eluted components will come to diffusive equilibrium. This will bring some protein into the mobile phase, but that protein will be in equilibrium with the particle pores. So the protein concentration within the pores will be the same as in the mobile phase. In fact, proteins will have the opportunity to diffuse even more deeply into the pore volume, making the problem even worse. If cleaning and sanitization are conducted under flow, the continuous introduction of clean buffer maintains the steepest possible diffusion gradient and hastens the transfer of unbound proteins from pores into the mobile phase. The first few column volumes (CVs) of cleaning or sanitizing agents can be introduced at usual column flow rates such as 100–300 cm/h to bring a column to equilibrium. Diffusion constants for salt ions are ~500× times faster than for proteins (11), so this will be sufficient to permit complete pore penetration of cleaning and sanitizing agents. Flow can thereafter be reduced to deliver another two CVs over a duration necessary to ensure protein clearance from the pores.
Process Control
Sulfo cation exchangers — typically with names such as S, SO3, sulfopropyl, or sulfoethyl — are sometimes referred to as strong cation exchangers. Strong, in this context, means that the charge remains unchanged over the range of pH values at which protein separations are typically conducted. Such exchangers generally have pKa values in the range of 1.1–2.0. Carboxy cation exchangers are referred to as “weak” exchangers because they lose charge within the normal operating range of protein separations. They usually have pKa values in the range 3.7–4.3. Strong and weak exchangers often have different selectivities, so both are commonly screened to determine whether one or the other is more effective for removing a particular contaminant, or product variants such as IgG fragments or aggregates.
Unless the selectivity of a weak cation exchanger is very compelling, strong exchangers are heavily favored for industrial applications. Both strong and weak cation exchangers bind positively charged hydrogen ions during equilibration. When NaCl is introduced to elute the column, sodium ions displace those hydrogen ions into the mobile phase and reduce pH. With weak exchangers, the amplitude may be >2 pH units, and duration may be 10 or more CVs (12,13,14,15). This has important practical consequences: weak cation exchangers require larger buffer volumes to achieve pH equilibration; pH may descend to a point that damages IgG; and pH will wander out of control when salt is introduced for elution. These “pH excursions” are reproducible under strictly controlled conditions, but variable as functions of sodium concentration and the rate at which sodium ions are introduced, as well as the buffer capacity of the system. This complicates both method development and scale-up.
Strong cation exchangers avoid the worst of these liabilities, but it is important not to take this for granted. Some products sold as strong cation exchangers are based on polymers that also bear carboxyl groups. This makes them mixed-bed strong–weak cation exchangers. If the proportion of carboxyl groups is high, then it will impose the same limitations encountered with “intended” weak exchangers. Relative carboxyl contribution is easy to characterize with small columns. If you routinely monitor pH, then salt-related pH excursions will be observed in any of the experiments discussed above (Figure 7). Otherwise, compare cation exchangers by monitoring pH during equilibration to a buffer such as 20–50 mM MES, pH 6.0, then step to the same buffer containing 1 M NaCl, or some other concentration of your choice. Each cation exchanger will produce a distinctive excursion signature. Excursions of greater amplitude and duration reveal a larger proportion of weak cation-exchange groups.
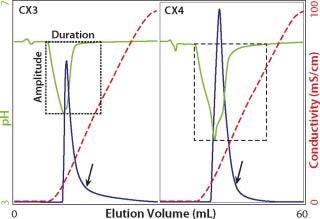
Figure 7: ()
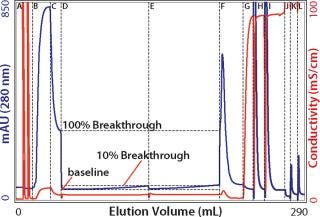
Figure 8: ()
Reproducibility and Chemical Stability
Aside from what pH excursion signatures may tell you about the charge constitution of a particular exchanger, they have valuable practical applications. They can be used to verify the identity of a particular exchanger. They can be used to measure lot-to-lot variability. And they can be used to monitor chemical stability. That last point is important because NaOH causes formation of carboxyl groups in some polymers used to construct cation exchangers (12,15). An incremental increase in the proportion of carboxyl groups over a number of sanitization cycles can potentially alter the performance of the exchanger, producing a systematic drift in results. This is important to acknowledge because a near-universal assumption that ion exchangers are base-stable makes the phenomenon easy to overlook.
Rather than wait for a problem to reveal itself at an inauspicious moment, it is advisable to expose a candidate exchanger to NaOH when performing its initial qualification, then compare its excursion signature with untreated media. How much NaOH and for how long is optional at this stage, but 1–2 M for 48–72 h is an appropriate place to start. If excursion signatures indicate a definite change, then consider running parallel gradient separations on the before-and-after columns and compare the conductivity at corresponding peak centers to see whether there is a significant change in selectivity. If the overall properties of a base-unstable exchanger are sufficiently attractive, it is probably an idea to characterize performance at the highest degree of base exposure the exchanger is likely to receive during its anticipated usage life before committing further resources to it.
Physical Stability
Physical stability of porous particle cation exchangers is usually discussed only in the context of damage occurring from passage through a pump during large-scale column packing. However, physical damage can also occur in packed columns under routine use. The charges on an ion-exchange particle are mutually repellant, which places stress on its particle structure. The higher the ch
arge density, the higher the stress. Because many new-generation ion exchangers achieve higher capacity at least in part through higher charge density, this places higher constraints on the mechanical strength of the polymer backbone. Stress is greatest at low conductivity and least at high conductivity for the simple reason that salt ions damp the intensity of charge interactions.
Gradual changes in conductivity are unlikely to be a concern. If there is going to be a problem with a particular resin, then it is likely to coincide with abrupt transitions between high and low conductivity. This occurs because different regions of the particle equilibrate at different rates. Before a buffer change, conductivity within the particles should be uniform; but when the mobile phase changes, their outer strata equilibrate more rapidly than the inner, thereby generating a structural stress wave toward the center. Repetition may create microfractures that accumulate over a number of cycles, create fines, and alter the flow characteristics of the media.
It is easy to model the physical stability of chromatography media to conductivity changes. Pack the media in a small column at low conductivity. Pack at the linear flow rate you plan to use in your experiments. Lower the inlet adaptor to the bed surface, but do not compress the media. Subject the column to repetitive abrupt transitions between high- and low-conductivity buffers while monitoring backpressure and conductivity. Also observe changes in bed height. Run a control series by doing linear gradient transitions between the same buffers. Plan to run 50–100 cycles. As noted, diffusion constants for salt ions are very rapid, which means that you can use higher flow rates than you would consider for protein fractionation to conduct more cycles in less time. If comparing different ion exchangers, you might consider using water and 2 M sodium chloride. This will create a more extreme transition than encountered in most processes, but accentuate differences among products. If your intent is to qualify a particular number of cycles on a particular exchanger with actual process buffers, then pick the point in your process that represents the largest conductivity differential between two buffers and use those.
Table 1: Cation exchanger performance comparison

Table 1: Cation exchanger performance comparison ()
Notable Improvements
At least four new industrial cation exchangers have been introduced over the past five years, with two of those in the past year. As a group, they represent a capacity improvement of nearly 10-fold over first-generation exchangers, with notable improvements in many other performance factors. They accordingly represent substantial improvements in manufacturing performance and economy, certainly for new purification processes, potentially enough to justify retrofitting existing processes.
Table 1 offers a compilation of experimental results from comparing several cation exchangers, providing a good example of how even a basic evaluation can reveal important practical distinctions among chromatography media. Rankings within a given test method were consistent for the three antibodies used in the present studies, but clear differences became apparent among them, and testing a larger diversity may well have revealed more divergent characteristics among exchangers. Even so, an abbreviated testing scheme such as offered here can help keep abreast of the latest capabilities the field has to offer and provide a foundation for more detailed characterization of a candidate you may wish to incorporate into your manufacturing program.
Cautions
Most current-generation commercial cation exchangers will tolerate the conditions suggested above, but some may exceed limits recommended by vendors for particular chromatography products. If in doubt, check with the vendor.
About the Author
Author Details
Pete Gagnon is chief scientific officer at Validated Biosystems; [email protected].
REFERENCES
1.) Lain, B, M Cacciuttolo, and G. Zarbis-Papstoitsis. 2009. Develoment of a High-Capacity MAb Capture Step Based on Cation Exchange Chromatography. BioProcess Intl. www.bpiseminars.com/webcast/development-of-a-high-capacity-MAb-capture-step.html. 7.
2.) Arunakumari, A, J Wang, and G. Ferreira. 2009. Advances in Non-Protein A Purification Processes for Human Monoclonal Antibodies. BioPharm Intl. 23.
3.) Arunakumari, A, and J. Wang Gottschalk, U. 2009.Purification of Human Monoclonal Antibodies: Non-Protein A StrategiesProcess Scale Purification of Antibodies, JT Wiley and Sons, Hoboken:102-123.
4.) Ferreira, G. 2007. Chromatography: A Two-Column Approach to Purifying Antibodies without Protein A. BioPharm Intl. 21.
5.) Mehta, A. 2008. Purifying Therapeutic Monoclonal Antibodies. CEP 104:S14-S20.
6.) Gagnon, P. 1996. Purification Tools for Monoclonal Antibodies. Validated Biosystems.
7.) Gagnon, P. Shukla, A, M and S 2009.Polishing Methods for Monoclonal IgG PurificationProcess Scale Separations for the Biopharmaceutical Industry, Taylor and Francis, Boca Raton:491-50.
8.) Harinarayan, C. 2002. An Exclusion Mechanism in Ion-Exchange Chromatography. Biotechnol Bioeng 95:775-787.
9.) Fontes, N, and R. van Reis Gottschalk, U. 2009.Advances in Technology and Process Development for Industrial-Scale Monoclonal Antibody PurificationProcess Scale Purification of Antibodies, JT Wiley and Sons, Hoboken:203-221.
10.) Meyers, J. 2001. Determination of the Pore Connectivity and Pore-Size Distribution and Pore Spatial Distribution of Porous Chromatographic Particles from Nitrogen Sorption Measurements and Pore Network Modeling Theory. J Chromatogr. A 907:57-71.
11.) Gagnon, P.Adsorptive Chromatography: The Influence of Stationary Phase Architecture; oral presentation, 4th International Monolith Symposium, Portoroz:29.
12.) Ghose, S, T McNerny, and B. Hubbard. 2002. pHTransitions in Ion-Exchange Systems: Role in the Development of a Cation-Exchange Process for a Recombinant Protein. Biotechnol Progr. 18:530-537.
13.) Pabst, T, and G. Carta. 2007. pH Transitions in Cation-Exchange Chromatographic Columns Containing Weak Acid Groups. J Chromatogr. A 1142:19-31.
14.) Lendero, N. 2008. Characterization of Ion-Exchange Stationary Phases Via pH Transition Profiles. J Chromatogr. A 1185:59-70.
15.) Soto-Perez, J, and D. Frey. 2008. Behavior of the Inadvertent pH Transient Formed by a Salt Gradient in the Ion-Exchange Chromatography of Proteins. Biotechnol Progr. 21:902-910.
16.) Gagnon, P. 2009. Purification Process Development with Monoliths, II: Column Loading. Monthly Monolith News 2.
You May Also Like


