Modeling Flow Distribution in Large-Scale Chromatographic Columns with Computational Fluid DynamicsModeling Flow Distribution in Large-Scale Chromatographic Columns with Computational Fluid Dynamics
Column chromatography remains a key unit operation in downstream processing of biopharmaceuticals. For most commercial processes, two to three chromatography steps are used to remove process-and product-related proteins, DNA and adventitious agents. As the biopharmaceutical industry has increased its product offerings and related demands, downstream processes have fast become a bottleneck (1, 2). Many commercial and clinical processes include a number of cycles on one or more chromatography steps to process the harvest from a single production batch.
PRODUCT FOCUS: ALL BIOLOGICS
PROCESS FOCUS: DOWNSTREAAM PROCESSING
WHO SHOULD READ: MANUFACTURING, PROCESS DEVELOPMENT, AND ANALYTICAL PERSONNEL
KEYWORDS: FLOW DISTRIBUTION, CFD, SIMULATIONS, COLUMN CHROMATOGRAPHY, PACKED BED, DYE STUDIES
LEVEL: ADVANCED
Up-scaling of chromatography steps has been the natural response. Theoretically, scale-up is elegantly achieved by increasing the diameter of a column (1–2 m), maintaining the same linear velocity, and keeping the bed height a constant to assume a uniform flow distribution. This approach, however, presents a challenge for design and process engineers to ensure that larger-diameter columns deliver the same quality of flow distribution as smaller bench-scale (or pilot) columns (3).
Although several designs exist for column head plates and distributors to achieve that goal, limited work has been done so far to study flow distribution in chromatography columns (4, 5). Dye studies have mostly been used in studying it. Such studies can be performed only after fabrication, and they are resource intensive. A complementary approach is needed to help us understand flow distribution and thus aid in fabrication and efficient testing of large-scale chromatography columns.
We present one such approach by using computational fluid dynamics (CFD) to gain a fundamental understanding of fluid and mass transfer inside a large-scale packed chromatography column. CFD is a branch of fluid mechanics that uses numerical methods and algorithms to solve and analyze problems involving fluid flows. It is fundamentally based on the Navier-Stokes equations, which describe the motion of fluid (6). Coupled with fluid flow are additional physical nd/or chemical processes: e.g., multiple phase (gasliquid or solid-liquid or solid-liquid-gas) interaction, species transport, heat transfer, mass diffusion, and chemical reactions.
To treat a continuous fluid discretely on a computer, first the spatial domain of the fluid flow region is discretized into small cells to form a volume mesh or grid (control volumes). Subsequently, the equations are solved in each grid volume to provide solutions for all variables (velocity, pressure, mass concentration of species, and so on). Flow and mass distribution in a system can thus be predicted nonintrusively. This numerical technique complements the experimental approach by supporting efficient experimental design and execution.
CFD technology is well established in the aerospace and automotive industries, and it entered the chemical industries in the past decade. Recently, the pharmaceutical industry has shown increased an interest in CFD for providing insight into fluid flow and related phenomena that can help mitigate risks associated with scale-up of process equipment as well as troubleshooting (7,8,9,10). The accuracy of CFD predictions depends on many factors including computational numerical accuracy, accuracy of model input data, and scientific understanding of the governing laws and the nature of fluids.
Drivers and Scope
Key drivers for gaining increased understanding of flow distribution for the project summarized here are to ensure appropriate sanitary processing and to optimize hardware for the chromatography steps in the downstream process of a commercial product. Low-flow regions can lower the effectiveness of a cleaning process and provide an opportunity for build-up of impurities and adventitious agents. Although such regions can reduce the effective binding capacity of the column, that was not a key driver for our project.
We used CFD to enhance our understanding of flow distribution in a chromatography column using the first principle. First, we set up a geometric flow model for the column to identify low-flow regions. Subsequently, we used that flow model to simulate the mass distribution of an injected dye tracer and compared the results with an actual dye test to validate our model. We subsequently used that model to suggest and confirm hardware and process improvements to improve cleaning effectiveness. The schematic in Figure 1 describes this approach, with phases and corresponding activities.
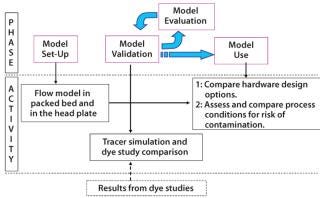
Figure 1: ()
Phase I: Model Set-Up
We developed a flow model for a large-scale column with a diameter <1.5 m packed to a bed height of ∼20 cm. The head plate is provided with four inlets, each with an antijet plate juxtaposed to “splash” incoming fluid in a radial direction in the head plate. This helps to distribute flow in the head plate and packed bed.
A polypropylene mesh is provided to prevent contact between the head plate and the antijet plates. A layered mesh screen is placed just below the antijet plates to serve as the barrier for resin in the packed bed. This layered mesh screen is fitted to the head plate by a “snap ring,” which contacts the packed bed. The column is symmetric across its middle plane, and it can be run in either up-flow or down-flow conditions. All geometrical features that contact process fluids were accurately modeled in the CFD model. Figure 2 provides a schematic of the column and head plate design.
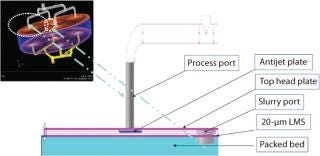
Figure 2: ()
We used the commercial software Fluent (version 6.2 from Ansys, Inc., www.fluent.com) to perform the CFD simulations and the Gambit preprocessor (also from Ansys, Inc.) to model the extremely complex column geometry. As part of our simulation, the fluid-filled volume was divided into ∼700,000 cells in a process called meshing. Fundamental fluid mechanic equations were discretized in each individual cell in the resulting “mesh.” These equations (including Navier-Stokes and Species Transport) are numerically solved in an iterative fashion by the CFD software. Solution data were subsequently processed to determine the distribution of all the fluid mechanical properties (including flow and species mass fraction) inside the column. Flow distribution profiles were obtained for regions of interests.
Flow Model: Figure 3 describes the flow profile illustrated by a velocity vector in the column with fluid (but no resin) compared with a resin-packed column. The flow profile in the column without a packed bed showed strong recirculation, which was significantly reduced (as the flow becomes more unidirectional) in the presence of a packed bed. The figure also illustrates a “splashing” effect at the antijet plates.
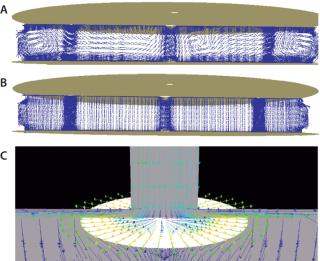
Figure 3: ()
Flow in a Packed Bed: Figure 4 shows a flow distribution obtained from the solution of the flow model for high and low process flow rates, respectively. The colors describe flow magnitude as a linear velocity at the respective points in cm/hr. Flow distribution profiles indicate that flow is uniform across the majority of the packed bed, with linear velocity equal or comparable to expected values.
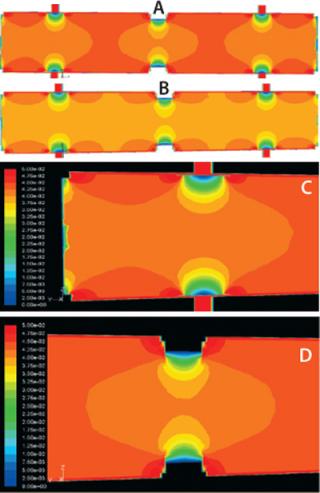
Figure 4: ()
A few regions are exceptions, however. Those adjacent to the slurry port and the process port have significant flow magnitude gradients. This pattern is consistent at both high and low flow rate conditions even though the absolute flow-rate values of flow rates are different. In addition, the figure clearly indicates the effect of the column wall on flow distribution, which is expected because of the “no slip” boundary condition assumed in the model. This effect, however, depends on the design of the snap ring and is discussed below.
Flow in the Head and Bottom Plate: The head and bottom plates account for only a small percentage of total column volume (<2%). Distribution is important in these, however, because it directly contributes to flow distribution in the packed bed and thus can play a significant role in band broadening 8,.
Figure 5 describes the flow distribution in the head plate, with a contour plot representation on the left of flow distribution at a cross-section of head plate right beneath the antijet plates. Evidently there are significant regions close to the slurry port and head plate wall with very low flow. On the right, velocity magnitude is shown on rakes moving up from the antijet plane; their pattern is comparable at different cross-sections throughout the head plate.
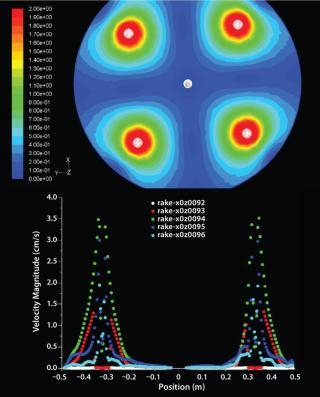
Figure 5: ()
The flow model revealed aspects of flow distribution that were not apparent by standard chromatography column evaluation techniques such as height equivalent to a theoretical plate (HETP) or asymmetry measurements. Before using the model, we deemed it necessary to assess its accuracy by carrying out model validation.
Phase II: Model Validation
Simplifying assumptions is an integral part of most modeling techniques. During CFD model set-up, we made several such assumptions about the best porosity, uniformity, flow regime in the head plate, and physical properties of the resin bed. The output of our flow model depends on the validity and accuracy of these assumptions. Although they were based on science, there was no way to directly verify their validity. Validation of the flow model itself would be a good indirect way to show that set-up was appropriate as well as confirming that the flow model was appropriate for use. Ideally, validation would be best achieved with flow data from different regions of the column compared with the model’s output. Unfortunately, there are no commercially available means of “flow mapping” inside a column and packed bed. Dye testing is one approach that can be used.
Dye Testing 101: As mentioned, dye-testing studies have been the standard approach used in such evaluations using mass distribution of an injected dye tracer to assess flow distribution.
Figure 6 provides a schematic of the dye testing study. In brief, dye is injected into an equilibrated column and allowed to flow for a predetermined time. Subsequently the column is dismantled to expose its resin bed, which is excavated to expose the dye band and get a picture of the mass and (indirectly) flow distribution inside. This type of study is resource intensive and can be performed only after column fabrication, which makes it difficult to make hardware changes if any are suggested by the results.
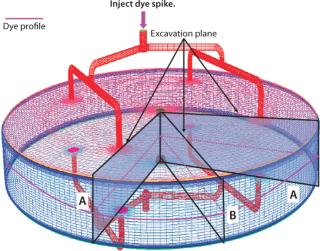
Figure 6: ()
Using Dye-Testing Results to Validate a Flow Model: To validate our model using dye testing, our first step was to develop a tracer distribution model. This essentially involved performing a CFD dye testing simulation in which a simulated dye tracer was injected in the CFD flow field and allowed to migrate. We planned a comprehensive dye testing in parallel with generation of tracer distribution model by CFD. In fact, output from the CFD tracer model greatly aided us in execution of the dye studies because it identified planes of interest along which a packed bed should be excavated. This greatly benefited the efficiency and value of our dye study.
Output from the tracer model indicated that planes midway between the process ports would have less dye coverage (Figure 7). We compared profiles from the CFD simulation with results from an experimental tracer injection analysis (a dye testing study). Figure 8 describes the simulation output and dye testing results, which show general agreement. The simulation predicted that vertical planes midway between the process ports would receive less dye than those directly beneath the process ports. That prediction agreed with results from the dye testing studies. The lack of dye penetration observed beneath the slurry port was predicted by the CFD simulation as well. The curving-up “smile” profile of the dye beneath the slurry port was evident in both sets of results. Distribution of dye adjacent to the process port, however, was one result that was not well predicted by the model.
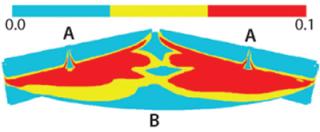
Figure 7: ()
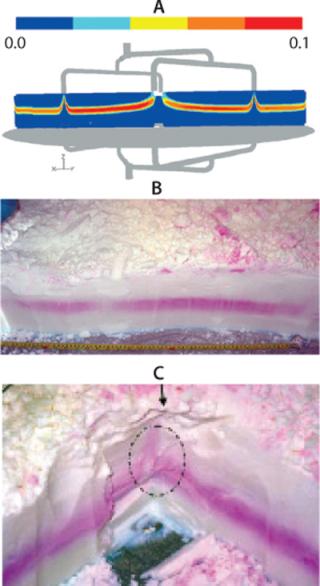
Figure 8: ()
Model Use: Ideally the CFD model should be used at a very early project stage, during hardware selection and optimization and while process conditions are being locked down. This would minimize risk from the start. Upon hardware fabrication, some dye testing should always be performed. CFD should be used to ensure optimum experimental design. For instance, the appropriate excavation planes for dye studies mentioned above had been identified by the CFD model. We present two cases in which CFD was used to evaluate alternative hardware and process conditions for a large-scale column that had already been fabricated before conception of the CFD modeling effort.
Hardware Optimization — Predicting the Effect of Snap Rings on Flow Distribution: As mentioned, a snap ring holding the layered mesh screen to the top head plate is essentially embedded in the packed resin bed and can affect flow distribution. Because of constraints existing when the column was fabricated, the snap ring designed for our column was bulky and had a significant footprint (Figure 9A). Based on limited dye testing data (shown in the figure), we suspected that this could cause distribution issues, with low flow regions close to the wall. If such regions did exist, it would be necessary to modify the snap ring design to mitigate the risk of inappropriate resin cleaning and sanitization.
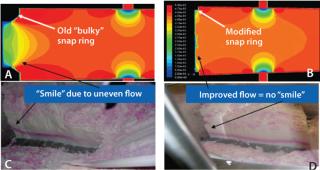
Figure 9: ()
Once our flow model was developed, we used it to compare the bulky snap ring with a different design (Figure 9B). The flow model revealed that the bulky snap ring did lead to a low-flow region of significant size. A modified snap ring much sleeker in design led to significant improvement in flow distribution. Upon implementation of this hardware modification, dye testing confirmed the improved flow distribution. Thus the utility of CFD modeling in hardware optimization was clearly demonstrated. As mentioned, ideally such modeling activities should precede hardware design and fabrication. They should later be confirmed by limited dye studies, which are feasible only when fabrication is complete.
Evaluating the Effect of Processing Conditions on Microbial
Contamination Risk: Chromatography processing conditions are based on achieving a requisite level of capacity, purity, and process economics. In some cases, however, the optimum based on such considerations may present risk to successful operations at large scale. We assessed one such risk, namely that of microbial contamination, and how it can be affected by process flow rate.
The sanitization solution used in every cycle or lot must have complete access to a column’s interior for a minimum contact time to provide microbial control. As is mentioned above and highlighted in Figures 4 and 5, there are areas with very low flow rate in the head plate, and we hypothesized that this can lead to trapping of air pockets. Such stagnant zones could not be appropriately sanitized without requisite contact, which could promote microbial growth. To study this hypothesis, we modeled movement of air bubbles in the head plate under different flow rates using CFD.
To initiate this simulation exercise, we placed cylindrical air pockets at several locations in a top head plate otherwise filled with water before applying the flow distribution obtained from our flow model. We studied two flow-rate conditions spanning a wide range representative of that used in column cleaning procedure. The flow direction was up-flow. We modeled the air pocket movement in the flow field with Fluent’s volume-of-fluid (VOF) model. The rationale behind using this model was to achieve a high level of accuracy in determining the flow of air bubbles by taking into consideration all the forces that can act on them. This model also accurately determines bubble breakup, coalescence, and movement. Significant computational time was invested for these calculations to obtain data for comparative analysis.
Air pockets could either change location in the head plate or leave the column altogether through the process ports. A comparative analysis was performed between the processing conditions of high and low flow rates during column sanitization. Figures 10 and 11 illustrate the simulation results, showing the locations of remaining air pockets in the head plate at various time points. High-flow-rate conditions clearly promoted removal of air, whereas low-flow-rate conditions seemed to promote trapping of residual air pockets. Figure 10 also presents the results of quantifying the amount of air leaving the head plate during the simulation. It was impossible to validate our hypothesis because there was no direct evidence of these air pockets (the column is made of stainless steel) — nor evidence that, if present, they may promote bioburden.

Figure 10: ()

Figure 11: ()

Figure 12: ()
Results of these simulations clearly indicate that flow rates at the lower end of the range used in column cleaning may promote air trapping in the head plate. In addition, the flow distribution results had indicated a pattern of low-flow regions around the slurry and process ports, which will result in significant risk when a column is operating at the lower end of its flow range. These results supported our decision to increase the flow rate during column cleaning, and they played a key role in implementation of process modifications for commercial manufacturing.
Proposed Design Changes to Improve Head Plate Flow
Distribution: We investigated several antijet plate designs to seek improved flow distribution in the head plate. One such design showed promising flow distribution in a CFD simulation. The diameter of the antijet plate was modified, and it was given specific porosity. We ran a CFD simulation of flow and mass distribution (as achieved by simulating a dye study) for the new design, and the results indicated that it was better than the existing design. So the plates were fabricated, and they are pending evaluation by experimental dye testing.
Combining Tools for Best Results
Growth in the biomanufacturing industry is warranting a continuous increase in scale and throughput of new manufacturing processes, equipment, and facilities. At the same time, the industry is under pressure to reduce cost of goods and meet an evolving regulatory focus on increased process understanding. Use of innovative tools and techniques is important to both concerns. CFD can be used to meet the growing industry’s needs related to chromatography steps.
Here we demonstrate that with careful model set-up and validation, valuable flow and mass distribution information was obtained. This effort led to identification of regions with suboptimal flow distribution in column hardware and a packed bed, which was instrumental in confirming that appropriate hardware and process modifications could mitigate cleaning risk. CFD and other traditional techniques (such as dye testing) can be used to complement each other. We used CFD to propose new design features that could reduce risk of microbial contamination. Similar approaches can be applied to other downstream and upstream unit operations and help companies gain valuable process understanding to meet their regulatory and business needs.
REFERENCES
1.) 2006. Purification Woes Upstream Gains: Cooperation Is Necessary to Break the Downstream Logjam and Reap the Benefits. Gen. Eng. Biotechnol. News www.genengnews.com/articles/chitem.aspx?aid=1403 26.
2.) Langer, E. 2007. Downstream Production Challenges in 2007: Study Indicates that Problems May Not Be Solved Before 2011. BioProcess Int. 5:22-28.
3.) Belter, PA, EL Cussler, and WS. Hu. 1988.Bioseperation Downstream Processing for Biotechnology, John Wiley & Sons, Hoboken.
4.) Arlt, W. Presentation.
5.) Tan, SN, and BC. Khoo. 2003.Effect of Column Inlet and Outlet Geometry on Large-Scale HPLC High-Performance Computation for Engineered Systems (HPCES), Massachusetts Institute of Technology, Boston.
6.) Anderson, JD. 1995.Computational Fluid Dynamics: The Basics with Application, McGraw Hill, New York.
7.) Pordal, HS, CJ Matice, and TJ. Fry. 2002. The Role of Computational Fluid Dynamics in the Pharmaceutical Industry. Pharmaceut. Technol. N. Am. Feb.
8.) Moscariello, J. 2001. Characterizing the Performance of Industrial-Scale Columns. J. Chromatog. A 908:131-141.
9.) Ching, CB. 2002. Study of Feed Temperature Control of Chromatography Using Computational Fluid Dynamics Simulation. J. Chromatog. A 945:117-131.
10.) Yuan, QS. 1999. Flow Distribution in Chromatographic Columns. J. Chromatog. A 831:149-165.
You May Also Like


