Reagent Clearance Capability of Protein A Chromatography: A Platform Strategy for Elimination of Process Reagent Clearance TestingReagent Clearance Capability of Protein A Chromatography: A Platform Strategy for Elimination of Process Reagent Clearance Testing
https://bioprocessintl.com/wp-content/uploads/2015/05/052015_qui.mp3
During the manufacturing of monoclonal antibody (MAb) products, many process reagents are used for cell culture and MAb purification to facilitate and control process performance. Process reagents are considered to be process-related impurities, so demonstration of their clearance is required for the chemistry, manufacturing, and controls (CMC) information submission of an investigational new drug (IND) application (1, 2). These reagents may be classified into two categories: generally recognized as safe (GRAS) reagents and potential safety concern (PSC) reagents (3).
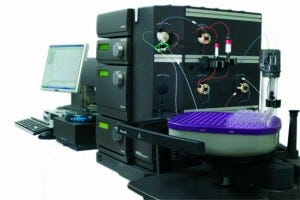
The authors used an ÄKTA Explorer-100 system in their study. GE HEALTHCARE (WWW.GELIFESCIENCES.COM)
GRAS reagents are those defined as inactive ingredients — for intravenous (IV) or subcutaneous (SC) administration only — in FDA- approved drugs (4), components of parenteral nutritional therapies (5), trace elements with parenteral permissible daily exposure (PDE) limits (6), and excipients in commercial products (7–9). Clearance testing of GRAS reagents may not be required because of their history of safe use and insignificant levels of patient exposure for the parenteral route of administration. However, such testing may be necessary for PSC reagents. Their clearance testing requirement can be evaluated according to a safety profile, starting amounts used in a given manufacturing process, maximum dose of the final product, and the process step at which they are introduced (3).
Our company uses a platform process to manufacture MAbs for first-in-human (FIH) products from cell culture to formulation of drug substance. Using the above classification criteria (3), we identified six PSC reagents from more than 70 process reagents used in the platform process. All six reagents are used in the platform cell culture media at starting amounts that in most cases are higher than the corresponding limits of permissible daily exposure (PDE), so demonstration of clearance for the PSC reagents is usually required (1, 2).
Over the past several years, all six reagents have been tested at our company for 16 platform FIH products and five late–development-stage products. Results indicate that the levels of those reagents in all tested products were consistently below the limit of quantitation (LOQ) of their corresponding testing methods in the DS or the cation-exchange (CEX) chromatography pool (data not shown). Those results indicate that the PSC reagents are cleared by the CEX chromatography pool stage if not earlier; however, PSC reagent clearance was tested primarily on DS. In addition, operating conditions of the chromatographic processes involved were optimized for each molecule. Although those operating conditions represented typical FIH purification processes, operating ranges were not well defined for each step of the chromatographic processes. So those operating conditions were discrete with respect to overall ranges.
Protein A chromatography (PAC) is the first step in typical FIH downstream MAb platform processes at our company. It is considered to be one of the most effective ways for achieving a high degree of MAb purity and recovery yield in a single step (10, 11). However, available quantitative information is very limited regarding the capability of PAC to remove PSC reagents. So our objectives were to evaluate the capability of MabSelect SuRe protein A affinity sorbent (GE Healthcare) to clear the identified PSC reagents using a design of experiment (DoE) model. That would provide systematic experimental evidence to support our platform strategy for elimination of reagent clearance testing.
Materials and Methods
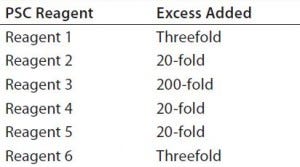
Table 1: Excess levels of six potential safety concern (PSC) reagents used in the design of experiment (DoE) study as compared to those in our platform media.
Cell Culture Medium: We used a platform chemically defined (CD) medium for the DoE experiment and a fed-batch cell culture process. To evaluate the capacity of PAC to clear the PSC reagents, we added additional amounts of them to the media in the DoE experiment. Table 1 lists the levels and excess used in this study relative to our platform media.
We selected three types of MAbs — with theoretical pI values of 6.9 (low pI, MAb 1), 8.1 (middle pI, MAb 2), and 8.7 (high pI, MAb 3) covering a typical pI range of our company’s MAb products — to add to culture media at a concentration of 4 mg/mL. Each preparation was mixed to homogeneity before being loaded onto a protein A MabSelect SuRe column.
Protein A Chromatography: MabSelect SuRe PAC resin is the platform resin for Amgen MAb downstream processing. So we packed it into a 0.66 × 20 cm glass column to capture product proteins from the prepared media. The purification process ran on an ÄKTA Explorer-100 chromatography system (GE Healthcare) with the parameters used in our company’s downstream platform. This laboratory-scale model has been used and well accepted to develop early purification processes for protein A columns, and purification results obtained from such models have been proven internally to be similar to those from large-scale columns (data not shown).
Experiment Design: To evaluate the effects of multiple factors and their interactions, we used a fractional- factorial (FF) DoE design. It comprised five factors with three levels for each factor: protein type with different theoretical pI values (6.9, 8.1, and 8.7), load levels (25 g/L, 35 g/L, and 45 g/L), wash column volumes (4, 6, and 8 CV), elution buffer pH (3.4, 3.7, and 4.0), and elution buffer strength (50, 75, and 100 mM sodium acetate). Table 2 lists the total of 30 runs for our FF design.
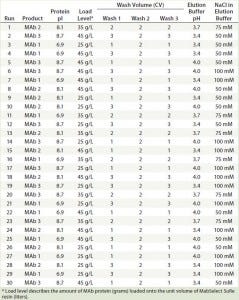
Table 2: 30 experimental run conditions studied in the fractional factorial design with five factors and three levels of each
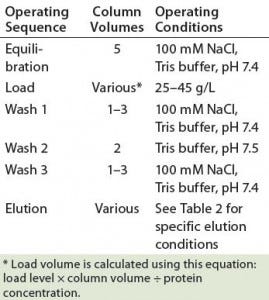
Table 3: Operating conditions for protein A MabSelect SuRe chromatography
PAC Operating Conditions: The platform operating conditions we applied covered equilibration, loading, washes, and elution. After elution, we cleaned the column with both nondenaturing and denaturing procedures. Table 3 shows the operating parameters used in this study. All operations ran at a linear flow rate of ≤300 cm/hour with an operating temperature of 20 ± 5 °C. For all 30 runs, we collected the elution fraction that had absorbance at A280 as a pool sample.
To evaluate the clearance of PSC reagents before elution, a total of 16 fractions (about 6.84 mL each) from load flowthrough to wash steps were collected for each of three runs (run 5, run 7, and run 15) to represent the worst-case scenario (highest load, 45 g/L, and lowest wash volume, 4 CV). We collected 13 fractions from the load step. From fractions 1 to 12 (F1–F12), we pooled two consequential fractions and labeled them as Flowthrough F1–2, Flowthrough F3–4, Flowthrough F5–6, Flowthrough F7–8, Flowthrough F9–10, Flowthrough F11–12, and Flowthrough F13. We also collected three fractions from the wash step and labeled them as Wash F1, Wash F2, and Wash F3.
Analysis of Process Reagents: We used a spectrophotometric procedure to quantify PSC reagent 1; high-pressure liquid chromatography (HPLC) procedures to analyze PSC reagents 2 and 4; an ion chromatography procedure for PSC reagent 3; and an enzyme immunoassay procedure for PSC reagent 5. For PSC reagent 6 samples, we used microwave acid hydrolysis and an inductively coupled plasma mass spectrometry (ICP-MS) procedure. All six methods were developed internally and qualified according to the relevant ICH guideline (12) before sample analyses.
Clearance Factor Calculation and Data Analysis: We express the clearance capacity achieved by PAC with a clearance factor calculated by dividing the amount of each individual PSC reagent loaded (concentration × load volume) by that measured in the pool sample (measured concentration in the pool × pool volume). We used JMP statistical software to analyze main and interaction effects for PSC reagents 5 and 6 clearance factors because two reagents were measurable in most of the 30 PAC pool samples (13). Because the other PSC reagent levels were below the LoQ of their corresponding test methods, we did not conduct statistical analysis for these results.
Results and Discussion
MabSelect SuRe affinity chromatography resin is a rigid, high-flow agarose matrix with an alkali-stabilized protein-A–derived ligand comprising only B domains (14). Interaction between IgG and protein A has been shown to consist primarily of hydrophobic interactions along with some hydrogen bonding and two salt bridges (15). Because protein A binds to IgG with high specificity, this affinity mode of chromatography enables removal of >99% of process impurities in a single step when starting directly from complex solutions such as cell culture harvest media (10, 11). The PSC reagents we identified are part of those impurities and thus should be cleared considerably by a PAC process.
Adequate clearance of those six PSC reagents is important. To better understand the capability of PAC to clear them under the conditions of Amgen’s MAb-purification platform, we planned and executed a FF design of experiment. That design allows us to evaluate five common PAC variable factors (protein pI, load level, wash volume, elution buffer pH, and elution buffer strength) individually as well as investigate their interactions. Those five factors included in the FF design are critical parameters because they often vary slightly when the platform is applied to a new FIH product. We did not evaluate PAC flow rate as a variable in this study because it has been clearly defined and controlled in the platform process.
To cover a wider range of PSC reagent concentrations and evaluate PAC clearance capability, we added extra amounts of the reagents to the CD media based on reagent solubility and concentrations used in the FIH platform media (Table 1). PSC reagent 6 is insoluble in aqueous media, whereas the concentration of PSC reagent 1 was high in the FIH platform media, so only threefold excess amounts were added for each. Because low levels (<5 mg/L) of PSC reagents 2, 4, and 5 were used in the platform media, we applied 20-fold excess of them. PSC reagent 3 is very soluble in aqueous media, and it is used at a modest concentration in the platform media. To evaluate clearance of such a highly water-soluble PSC reagent, we added a 200-fold excess amount.
We loaded CD media prepared with three different types of MAbs and extra amounts of the six PSC reagents onto protein A columns under 30 combined operating conditions. And we analyzed reagents from the different flowthrough and wash fractions as well as protein A column pools for clearance evaluation.
PSC Reagent Concentrations in Elution Pools: In all PAC experimental runs, concentrations of PSC reagents 1–4 in the elution pools were below the LoQ for their corresponding testing methods (Table 4). Concentrations of those four reagents added into the cell culture media were significantly lower than their maximum solubility in water at room temperature (Table 1) (16). Because protein A binds to IgG with high specificity, water-soluble components were readily removed when their concentrations were low relative to their solubility. The results demonstrate that the PAC process could remove such reagents consistently to very low levels regardless of changes in protein pI, load level, wash column volume, elution buffer pH, or elution buffer strength (Table 4).
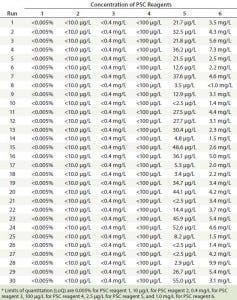
Table 4: Concentrations of six PSC reagents detected in elution pool samples
By contrast, different amounts of PSC reagent 5 and PSC reagent 6 remained in most elution pools. Reagent 5 concentrations in the 30 pool samples ranged from <2.5 to 55.0 µg/L, and reagent 6 concentrations ranged from <1.0 to 9.9 mg/L (Table 4). Those variations may be associated with PAC operating conditions, with chemical properties of the two reagents, and/or with the concentrations used.
Reagent 6 is a mixture of fully methylated linear siloxane polymers and is insoluble in water (16). Because it is highly hydrophobic, it may get trapped on the top or attach to the wall of the protein A column, to resin matrix agarose, and/or to resin bead surfaces through nonspecific binding. Such binding has been observed for a number of molecules (17–19). It could also bind to a MAb through hydrophobic interactions similar to how that MAb interacts with protein A (15). Binding and dissociation rates of nonspecific binding might be inconsistent under different operating conditions. PSC reagent 6 thus is eluted randomly, showing up at varying concentrations in the different pools.
Reagent 5 is a 70–amino-acid protein consisting of a hydrophobic core made up of three well-defined helices (20, 21). The decrease in its clearance efficiency could be attributed to two possible effects: a protein–protein interaction with MAb and/or reagent 5’s hydrophobic core becoming exposed at some conditions to allow for nonspecific binding to hydrophobic surfaces. The protein A operating conditions could modify the binding and dissociation rates of such nonspecific binding.
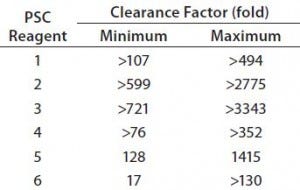
Table 5: Clearance capacity of protein A chromatography (PAC) under 30 operating conditions for six PSC reagents
PAC Capacity to Clear PSC Reagents: Clearance capacity measures the capability of a protein A column to clear a given PSC reagent, and we express it here with a clearance factor. That factor is calculated by dividing the amount of a PSC reagent loaded onto a column by the amount found in the column pool sample. Table 5 summarizes the clearance capacities provided by a protein A MabSelect SuRe column at different operating conditions.
Although the levels of PSC reagents 1–4 were below the LoQ values of their corresponding methods of measurement (Table 4), their clearance capacities varied under different operating conditions. For example, clearance capacities for reagents 2 and 3 were much greater than those for reagents 1 and 4 (Table 5). Because those four PSC reagents were cleared at all operating conditions, however, the differences in their clearance factors within this operating space may be unrelated to the operating parameters we tested. Instead they might depend on the analytical method sensitivity and starting concentrations we used.
Concentrations of PSC reagents 5 and 6 were measurable in most protein A pools. To determine the effects of different operating conditions on their PAC clearance capacity, we conducted statistical analyses for these clearance results in our FF design. Figure 1 shows prediction profilers for the main effects on clearance factors of reagent 5 and 6 in the pool samples. Figures 2 and 3 show two-way interaction profiles for reagents 5 and 6 responses, respectively.
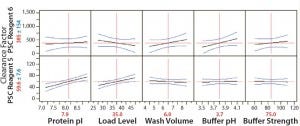
Figure 1: Main effects profiles for PSC reagent 5 and PSC Reagent 6 levels; probability values for the main effect of protein pI and load level on PSC Reagent 6 were 0.0008 and 0.011, respectively, and probability values were >0.05 for the main effects of the other three factors. Probability values were >0.05 for the main effects of all five factors on PSC Reagent 5.
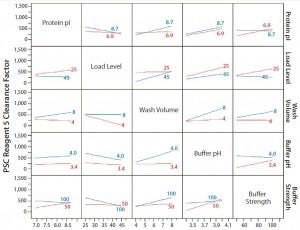
Figure 2: Interaction profiles for PSC reagent 5 responses; probability values were >0.05 for all two-way interactions.
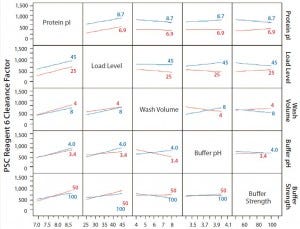
Figure 3: Interaction profiles for PSC Reagent 6 responses; probability values were >0.05 for all two-way interactions.
For PSC reagent 5, the R2 value of the model used for the prediction profiler was 0.47 (p = 0.652). The effects of five factors and two-way interactions on those clearance factors were insignificant at the 0.05 significance level (Figures 1 and 2). These results demonstrated that none of the five factors used in our PAC process had a significant effect on the clearance factor. However, variability in the PAC clearance factor for reagent 5 (128- to 1,415-fold, Table 5) might be due to nonspecific binding with a contact surface as discussed above.
The R2 value of the model we used for the prediction profiler of PSC reagent 6 clearance factor was 0.77 (p = 0.020) (Figure 1). The major effects of protein pI and load level on reagent 6 clearance factors were statistically significant (p = 0.0008 for pI, p = 0.0111 for load level, Figure 1). The clearance factor was significantly higher with a higher-pI product than with a lower-pI product, and higher load levels improved the reagent 6 clearance factor (Figure 1). Higher load levels also may have increased the reagent 6 level loaded onto the column, in turn increasing reagent 6 flowthrough to result in a larger clearance factor. The other factors did not appear to have any effect on the clearance factor for PSC reagent 6 (p > 0.05) (Figure 3). Clearance factors of this reagent varied from 17- to >130- fold (Table 5). Apparently, its PAC clearance factors may depend on protein pI, operating conditions, chemical properties, and concentrations added.
Mass Balance in Three Worst-Case– Scenario Runs: The mass balance for a system without a chemical reaction is defined as input = output + accumulation (22). In our system, the input is the total amount of a PSC reagent that is loaded onto the protein A column, and the output is the total amount of that reagent that is measured in different sample fractions. The accumulation is the total amount of a reagent that remains in the protein A column. For demonstration purposes, we evaluated the mass balance on the results from only three worst-case scenario runs.
We defined the worst case as a combination of the highest load level (45 g/L) and the lowest wash volume (4 CV) and selected one case from each product: e.g., run 5 for MAb 3, run 7 for MAb 1, and run 15 for MAb 2. We calculated the amount of an individual PSC reagent in each fraction by multiplying the reagent concentration by the fraction volume, obtaining the total amount (output) by summarizing the amounts from all fractions. The volume was 13.68 mL in load F1–2 through Load F11–12, and it was 6.84 mL in load F13, wash F1, wash F2, and wash F3. Pool volumes varied from 8.2 mL to 32.5 mL because of the differences in elution conditions. We calculated the reagent amount loaded (input) by multiplying the measured reagent concentration in the medium by the load volume. Finally, we calculated the total recovery by dividing the total amount found in all fractions by the amount loaded and multiplying the results by 100%.
Total recoveries of all PSC reagents except reagent 6 were >75% in three worst-case scenario runs (Figure 4). Run 15 was the best, for which the total recoveries of four PSC reagents (PSC reagents 1, 2, 4, and 5) reached ~100% (Figure 4). However, reagent 6 had extremely low recoveries, with a total recovery of <44% in the three worst-case runs (Figure 4). Apparently, a large portion of PSC reagent 6 accumulated in the protein A column. As discussed above, nonspecific binding to hydrophobic surfaces could be primarily responsible for that accumulation.
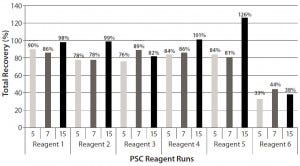
Figure 4: Total recoveries of six PSC reagents in Runs 5, 7, and 15
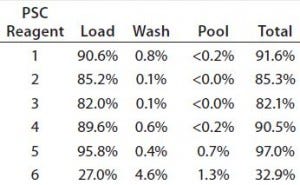
Table 6: Percentage of PSC reagents present in three fractions; values are averaged from Runs 5, 7, and 15.
To determine where removal of the PSC reagents occurred, we calculated the percentages removed in the load, wash, and pool fractions. Over 80% of all the reagents — except PSC reagent 6 — were removed at the load step (Table 6). That was also the main step for reagent 6 removal, the percent- removal of which was twofold lower than that for the other reagents. Under 0.2% or none of the loaded PSC reagents (including reagents 1–4) was present in the pool fraction (Table 6). However, very small amounts of reagents 5 (0.7%) and 6 (1.3%) were found in the pool. Those differences were largely attributable to reagent hydrophobicity, as discussed above.
Platform Strategy for Eliminating PSC Reagent Clearance Testing: Because Amgen uses a platform process to manufacture MAbs for FIH projects, our DoE results could be used in a platform strategy to eliminate clearance testing of PSC reagents for future MAb products. To explore this possibility, we compared the clearance requirement for each reagent with its clearance capacity of PAC. Using the starting concentrations of six PSC reagents in the cell culture and total titer amounts for 11 previous MAb products, we calculated the maximum amounts of all six that could be present in the DS. For a conservative estimate, we established two worst- case scenarios:
assuming that the entire PSC reagent used was retained in the final DS without any clearance
selecting the highest amount used in 11 products for each PSC reagent.
By dividing the maximum amount of each PSC reagent by its exposure limit, we then calculated the necessary clearance to prevent a final amount in DS from exceeding that exposure limit. Table 7 lists those clearance requirements alongside the PAC clearance capacity for each reagent. The latter was 2× higher than the former for PSC reagent 6, 3× higher for reagent 5, 4× higher for reagent 1, 23× higher for reagent 2, 180× higher for reagent 3, and 19× higher for reagent 4 (Table 7).
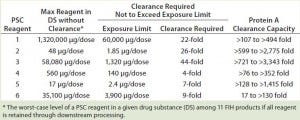
Table 7: Comparing clearance requirements of PSC reagents in 11 first-in-human (FIH) MAb products and clearance capacity achieved by PAC in the DoE study
Because the design space of our DoE study covers the range of the PAC operating conditions, our results can be used in a platform approach to eliminate PSC reagent clearance testing for the impurity section of future FIH product regulatory submissions. No cell culture process variations (from fed-batch to alternating tangential flow) or harvest clarification methods (centrifugation, flocculation, or microfiltration) before the PAC step affect its clearance capability for these six PSC reagents — as long as their concentrations and PAC operating conditions are within the design-space ranges. However, if a PSC reagent concentration and/or PAC operating conditions are outside that design space, then analytical testing must be conducted or sound scientific justification must be made to use the platform strategy.
Our company has implemented this platform approach successfully in several new FIH regulatory filings. Application of this approach has cut >90% of the resources required for preparing those regulatory submissions.
Due Diligence Done
We conducted a five-factor FF DoE study with three levels to evaluate the capacities of MabSelect SuRe PAC to clear six PSC reagents. Four PSC reagents (reagents 1–4 ) were below the LoQ of their corresponding analytical methods in 30 runs under all operating conditions tested. However, levels of PSC reagents 5 and 6 were measurable and varied considerably under different operating conditions. The reagent 6 level in one run and the reagent 5 levels in four runs were below the LoQ for their respective analytical methods. The mass balance evaluation indicates that the recovery of these PSC reagents in the measured samples was ≤44% for reagent 6 but ≥76% for all the others. Over 80% of the reagents (all but reagent 6) were cleared at the load step; detectable PSC reagents 1–4 in the pools ranged from 0% to <0.2%. By contrast, detectable levels of reagents 5 and 6 in the pools were 0.7% and 1.3%, respectively.
Clearance factors of protein A MabSelect SuRe chromatography ranged from 17- to >130-fold for PSC reagent 6, from 128- to 1,415-fold for reagent 5, from >107- to >494-fold for reagent 1, from >599- to >2,775-fold for reagent 2, from >721- to >3,743-fold for reagent 3, and from >76- to >352-fold for reagent 4 . Although our design space covers the ranges of parameters used in fed-batch cell culture and PAC platform processes, it can be applied to other cell culture processes if the concentrations of PSC reagents and PAC operating parameters are within the same design space. PAC clearance capacities were at least twice as high than the clearance requirements for safe levels of all six PSC reagents. Therefore, these DoE results can be used in a platform strategy to eliminate clearance testing of those six PSC reagents for IND filings of future FIH products.
Acknowledgments
The authors thank Victor Wong, Justin Kim, Helen Chung, Samit Kapoor, and Nimesh Savjani for testing the samples; Frank Ye for providing the DoE design; Mark DiMartino for statistical analysis of data; and Karen Miller for discussing the experimental design.
References
1 CBER/CDER. Guidance for Industry, Content, and Format of Investigational New Drug Applications (INDs) for Phase 1 Studies of Drugs, Including Well-Characterized, Therapeutic, Biotechnology-Derived Products. US Food and Drug Administration: Rockville, MD, 1995.
2 ICH Q6B. Specifications: Test Procedures and Acceptance Criteria for Biotechological/Biological Products. US Fed. Reg. 64, August 1999: 44928; www.ich.org/ fileadmin/Public_Web_Site/ICH_Products/ Guidelines/Quality/Q6B/Step4/Q6B_ Guideline.pdf.
3 Qiu J, et al. Risk-Based Approach to Determine Testing Requirement for the Removal of Residual Process Reagents As Process-Related Impurities in Bioprocesses. PDA J. Pharm. Sci. Technol., in press.
4 CDER. Inactive Ingredient Search for Approved Drug Products. US Food and Drug Administration: Rockville, MD, www. accessdata.fda.gov/scripts/cder/iig/index.cfm.
5 Howard L. Enteral and Parenteral Nutrition Therapy. Harrison’s Principles of Internal Medicine (16th Edition). Kasper D, et al., Eds. McGraw-Hill: New York, NY, 2005; 415– 422.
6 ICH Q3D. Guideline for Elemental Impurities. International Conference on Harmonisation of Technical Requirements for Registration of Pharmaceuticals for Human Use: Geneva, Switzerland, December 2014; www.ich.org/fileadmin/Public_Web_Site/ ICH_Products/Guidelines/Quality/Q3D/ Q3D_Step_4.pdf.
7 Nema S, Brendel RJ. Current Usage and Future Directions Excipients and Their Role in Approved Injectable Products. PDA J. Pharm. Sci Tech. 65, 2011: 287–332.
8 Powell MF, Nguyen T, Baloian L. Compendium of Excipients for Parenteral Formulations. PDA J. Pharm. Sci. Tech. 52, 1998: 238–311.
9 Rowe R, et al. Handbook of Pharmaceutical Excipients (Seventh Edition). Pharmaceutical Press: London, UK, 2012.
10 Fahrner RL, et al. Industrial Purification of Pharmaceutical Antibodies: Development, Operation, and Validation of Chromatography Processes. Biotechnol. Genet. Eng. Rev. 18, 2001: 301–327.
11 Follman D, Fahrner RL. Factorial Screening of Antibody Purification Processes Using Three Chromatographic Steps without Protein A. J. Chromatogr. A 1024, 2004: 79–85.
12 ICH Q2(R1). Validation of Analytical Procedures: Text and Methodology. US Fed. Reg. 62(96) 1997: 27463–27467; www.ich.org/ fileadmin/Public_Web_Site/ICH_Products/ Guidelines/Quality/Q2_R1/Step4/Q2_R1__ Guideline.pdf.
13 JMP software, Version 11. SAS Institute, Inc.: Cary, NC, September 2013.
14 Data File 11-0011-65 AC. MabSelect SuRe. GE Healthcare Life Sciences: Uppsala, Sweden, June 2011.
15 Li R, et al. Design, Synthesis and Application of a Protein A Mimetic. Nat. Biotechnol. 16, 1998: 190–195.
16 Budavari S. The Merck Index: An Encyclopedia of Chemicals, Drugs, and Biologicals (11th Edition). Merck and Co., Inc.: Rahway, NJ, 1989.
17 Dai H, et al. Use of Hybridization Kinetics for Differentiating Specific from Non-Specific Binding to Oligonucleotide Microarrays. Nucl. Acids Res. 30, 2008: e86.
18 Zhou JX, et al. Non-Specific Binding and Saturation of Polysorbate-20 with Aseptic Filter Membranes for Drug Substance and Drug Product During MAb Production. J. Membrane Sci. 325, 2008: 735– 741.
19 Mendel CM, Mendel DB. “Non- Specific” Binding: The Problem, and a Solution. Biochem. J. 228, 1985: 269–272.
20 Pierre M, Jonathan W. Structural Biology of Insulin and IGF1 Receptors: Implications for Drug Design. Nature Rev. Drug Discov. 1, 2002: 769–783.
21 Rinderknecht E, Humbel RE. The Amino Acid Sequence of Human Insulin Like Growth Factor I and Its Structural Homology with Proinsulin. J. Biol. Chem. 253, 1978: 2769–2776.
22 Himmelblau DM. Basic Principles and Calculations in Chemical Engineering (Second Edition). Prentice Hall: Englewood Cliffs, NJ, 1974: 82–86.
Xiaoyang Zhao is a senior scientist, and at the time of this work Henry Lin was a principal scientist (now a senior principal engineer at Boehringer Ingelheim); and corresponding author Jinshu Qiu is a principal scientist in process development at Amgen Inc., One Amgen Center Drive, Thousand Oaks, CA 91320; 1-805-447-3183; [email protected].
You May Also Like


