Dynamic Binding Capacities of Protein A Resins for Antibody Capture: A Comparative EvaluationDynamic Binding Capacities of Protein A Resins for Antibody Capture: A Comparative Evaluation
 The dynamic binding capacity (DBC) of a chromatography resin represents the total amount of target protein that the resin will bind under actual flow conditions before significant breakthrough of unbound protein occurs. This is a useful parameter for predicting what the process performance of a resin will be in actual use.
DBC affects the overall amount of resin that can be packed in a given column for a process — and the number of batches that can be processed cost-effectively in manufacturing each year. If resin DBC is low, then more gel must get packed inside a column, ultimately increasing the cost factor involved in running a batch. For resins with higher DB values, less can be packed inside a column, thereby decreasing the overall utility cost of each batch run.
DBC can be determined using either partly purified monoclonal antibodies (MAbs) or cell culture feedstock. If the former are used, then the breakthrough curve can be measured directly by monitoring UV absorbance. Resin DBC also can be evaluated through spectrophotometric analysis at an optical density reading at 280 nm (OD280) and testing a sample of purified MAb eluted under binding conditions.
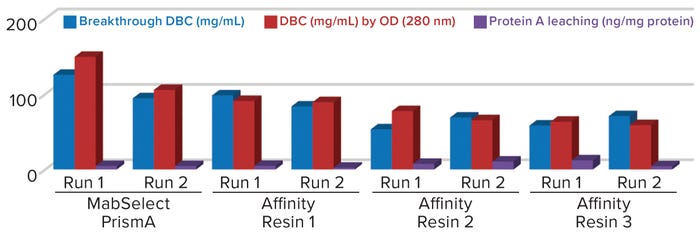
Figure 1: Comparing breakthrough dynamic binding capacity (DBC) and protein A leaching of different protein A resins; OD = optical density
Objective
Bharat Serums and Vaccines Limited (BSV) in India has conducted a study to evaluate the DBC of Cytiva’s (formerly GE Healthcare’s) MabSelect PrismA resin in comparison with three available protein A resins from other manufacturers (labeled below as affinity resins 1, 2, and 3). (Editor’s Note: Details are available from the authors upon request.) The MabSelect PrismA manufacturer describes its DBC breakthrough volumes at ~80 mg of human IgG/mL resin at six minutes residence time and ~65 mg of human IgG/mL resin at four minutes residence time with a protein loss of 10% (QB10).
 BSV conducted the experiments by using one of its own recombinant MAb proteins. We also compared process performance and robustness after 50 clean-in-place (CIP) cycles of all four resins. To test their performance, we measured the following parameters: DBC by QB10 breakthrough, DBC by spectrophotometric analysis (OD280), and protein A leaching.
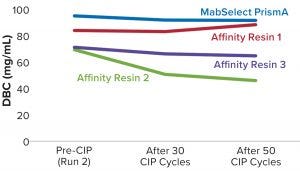
Figure 2: Comparing QB10% breakthrough DBC for different protein A resins
Methodology and Framework
For the first process run, we packed 3 mL of MabSelect PrismA resin into a Cytiva XK 16/20 column at a bed height of 1.5 cm. Using a Cytiva ÄKTA Prime Plus system, we kept the operating flow rate to 0.7 mL/min, considering a residence time of no less than four minutes. Total protein loaded onto the resin was ~500 mg, with the preload volume of 115 mL at a concentration of ~4.312 mg/mL. We adjusted the preload to a pH range of 7.0–8.0 and a conductivity range of 4.00–5.00 mS/cm.
 For column equilibration, we used a normal phosphate and NaCl buffer at pH 7.0–8.0; for elution of protein, we used a low-pH buffer (3.0–4.0) and neutralized the elute with Tris base buffer to pH 7.00. For pre- and post-CIP, we used a 0.1 M NaOH solution given as a wash of three column volumes (3 CV) followed by a 10-CV wash of purified water.
We calculated resin DBCs at 10% breakthrough volume (QB10) with an appropriate formula by monitoring UV absorbance data from the obtained chromatograms. Neutralized elutes were quantitated spectrophotometrically at OD280 for protein concentration and for evaluating both resin DBC and protein A leaching. We repeated each run to check reproducibility of results, keeping all above conditions the same.
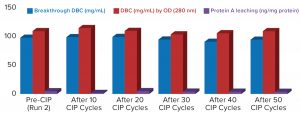
Figure 3: Comparing MabSelect PrismA breakthrough dynamic binding capacity (DBC) and protein A leaching before and after clean in place (CIP)
For evaluating process performance and robustness of the MabSelect PrismA resin, we ran a total of 50 CIP cycles using 0.1 M NaOH solution. At the end of every tenth cycle, we evaluated process performance of the resin at QB10 and measured protein A leaching, then compared the results with those from our pre-CIP process run. Keeping process conditions the same, we performed comparative experiments on three other manufacturers’ protein A resins in duplicate. We subjected those to 50 CIP cycles to the same conditions as had been done for the MabSelect PrismA resin — with process runs taken after the end of the 30th and 50th cycles. Then we evaluated and compared process performance and robustness data from all four affinity resins after 50 CIP cycles. For supporting data to assess the purity of protein eluted from these resins after CIP, we also performed sodium-dodecyl sulfate polyacrylamide gel electrophoresis (SDS-PAGE) under nonreducing conditions.
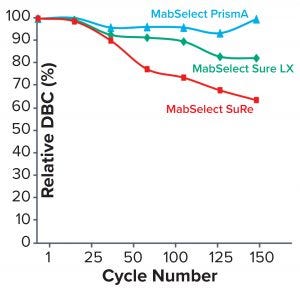
Figure 4: Comparing relative dynamic binding capacity for three Cytiva resins (1)
Results and Discussion
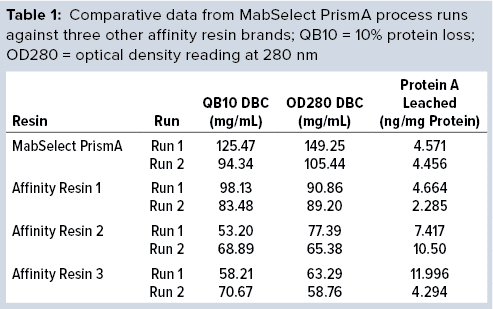
The DBC we determined from our first process run exceeded that claimed by the manufacturer for MabSelect PrismA resin at four minutes residence time. Results of the repeat process run also exceeded the claimed DBC limit. Table 1 compares process-run data for all protein A resins tested.
Comparative data from those process runs show higher DBC values for MabSelect PrismA resin at QB10. DBCs obtained by spectrophotometric calculations of elutes also were higher for the Cytiva resin than for the other three resins. In our study, the protein A leaching profile of MabSelect PrismA resin fell within the predetermined specification limit of our protein product. Affinity Resin 1 had identical results, but those for Affinity Resins 2 and 3 were on the higher side. Figure 1 is a graphical representation of those results.
Process performance and robustness data for MabSelect PrismA resin demonstrated consistency in DBC values up to the 50th CIP cycle. The resin also retains >95% of its initial DBC up to 50 CIP cycles using 0.1 M NaOH (Figure 2).
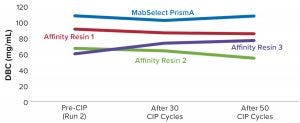
Figure 5: Comparing DBC measured by absorbance at 280-nm optical density (OD280) for different protein A resins
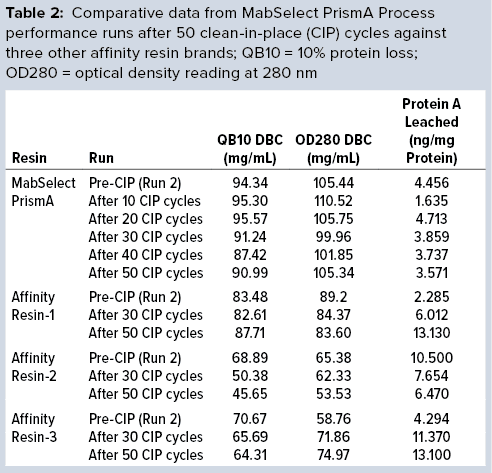
Table 2 lists highlights of the comparative run data from performance runs for all four resins after 50 CIP cycles. The data are consistent with Cytiva’s claim of DBC retention at >95% of initial DBC after 150 cycles (Figure 4). In our results, the DBC of MabSelect PrismA resin was higher than that of the pre- and post-CIP (30 and 50 cycles) DBC values for all three of the other resins. And our spectrophotometrically evaluated DBC values were consistent for MabSelect PrismA resin after every 10th CIP cycle — and higher than those of the other three affinity resins after their 30th and 50th CIP-cycle process runs (Figure 5).

Figure 6: Comparing protein A leaching from different protein A resins
We also found the protein A leaching profile of MabSelect PrismA resin to remain consistent after every 10th CIP cycle and to fall within the predetermined specification limit of our protein product. Protein A leaching data reveal lower leaching of the affinity ligand from MabSelect Prism A resin than that from the other three resins (Figure 6). Finally, the nonreducing SDS-PAGE profiles showed consistency in product purity from the MabSelect PrismA resin. The other resins were comparable in purity profiles (Figure 7).

Figure 7: Nonreducing SDS-PAGE analysis; in each case, Lane 1 is a molecular-weight marker and Lane 2 represents a standard for comparison.
The Bottom Line
We find the cost of affinity chromatography processing for 50 cycles using MabSelect PrismA resin to be as much as three times lower than that of affinity processing with 50 cycles use of resin that has lower DBC values. Ultimately, we conclude that MabSelect PrismA resin offers the highest DBC at the lowest residence time when compared with the other three affinity resins tested. It also offered low levels of ligand leaching, complete and comparable product recovery, and sustainably better performance and efficiency even after 50 CIP cycles.
Reference
1 MabSelect PrismA. Cytiva: Uppsala, Sweden, 2017; https://www.gelifesciences.co.jp/products/bioprocess/pdf/KA553200917DF_PrismA_datafile.pdf.
Further Reading
Glynn J, et al. The Development and Application of a Monoclonal Antibody Purification Platform. BioPharm Int. 22(3) 2009: s16–s20.
How to Determine Dynamic Binding Capacity (DBC) of Chromatography Resins. GE Healthcare: Uppsala, Sweden, 21 September 2018; https://www.gelifesciences.com/en/us/news-center/how-to-determine-dynamic-binding-capacity-10001.
Zhang J, et al. Maximizing the Functional Lifetime of Protein A Resins. Biotechnol. Progr. 33(3) 2017: 708–715; https://doi.org/10.1002/btpr.2448.
Corresponding author Pranav Milind Gupte is assistant manager, Mahesh Gavasane is deputy general manager, Aditee Kambli is manager, Tushar Bhabal is executive, and Saher Cheulkar is officer of biotech R&D in recombinant biotherapeutics downstream processing and formulation development at Bharat Serums and Vaccines Limited, Third Floor, Liberty Tower, Plot No. K-10, Behind Reliable Plaza, Kalwa Industrial Estate, Airoli, Navi Mumbai – 400 708, India; 022-45043100; [email protected].
You May Also Like


