Predictive Algorithm Modeling for Early Assessments in Downstream Processing: Using Direct Transition and Moment Analysis To Assess Chromatography Column Integrity at Production ScalePredictive Algorithm Modeling for Early Assessments in Downstream Processing: Using Direct Transition and Moment Analysis To Assess Chromatography Column Integrity at Production Scale
 Failure to detect breaches in chromatography column performance can be disastrous during large-scale commercial manufacturing. Our company uses algorithm modeling for near–real-time monitoring of column packing quality and sensitive detection of column-integrity breaches. The approach enables us to mitigate risks early on, save cost and time, and thereby deliver consistent product quality and purity during manufacturing.
Here we discuss three case studies in which predictive algorithm modeling using moment analysis and direct transition analysis (DTA) helped us monitor column integrity and performance. We analyzed four performance indicators using production-scale chromatography data.
Preparative chromatography remains the method of choice to obtain high levels of purity during biologics manufacturing. However, the complexity of protein chemistry and upstream process variations complicates efforts to ensure consistent product quality during chromatographic purification. Effective monitoring of column performance can circumvent barriers to ensuring final-product quality.
Monitoring Column Performance
Pulsed-Input HETP Test: A hypothetical zone in which the solid and fluid phases establish an equilibrium with each other, height equivalent to a theoretical plate (HETP) defines the separation efficiency of a chromatography column. Defined as the distance from the center line of a chromatogram peak to its back slope divided by the distance from the center line of the peak to its front slope, the asymmetry factor (Af) specifies the quality of column packing. In a pulsed-input HETP test, a nonreacting tracer is injected into a column so that HETP and Af can be calculated from a normal (Gaussian) distribution elution peak. That method is both labor- and time-intensive, however, making it infeasible for use in long-term monitoring (1–4).
Chromatogram Review and Process Parameter Monitoring: Column integrity can be assessed by reviewing chromatograms or by monitoring process parameters such as elution-pool volume and step yield. But such methods are not robust enough to detect all changes in column performance.
Transition analysis frequently is used to assess column integrity and performance at production scale. A transition is a step change in a parameter such as pH, conductivity, or optical density. Transition analysis leverages process data without requiring separate tests to detect subtle changes in column performance and help establish control limits.
Moment Analysis: Based on more than 300 production-scale transitions, Larson et al. showed that evaluating a limited number of temporal moments (moment analysis) can detect subtle changes in column integrity (5). The authors demonstrated that non-Gaussian HETP is more effective for monitoring column integrity than is Gaussian HETP. They applied noise-filtering methods — e.g., normalizing raw data with minimum and maximum signals, moving averages, and change-band filters — to on-line process data obtained from sensors. However, moment analysis can depend highly on the column and process involved (5).
Direct Transition Analysis: Cui et al. developed DTA to overcome the limitations of moment analysis. Using DTA, the authors showed two column-performance indicators to be reliable for production-scale column performance monitoring: transwidth and direct Af. As an alternative to HETP, the former is a direct measure of band broadening in a column. As an alternative to Af, direct Af is a direct measure of peak asymmetry (6).
Below we present three case studies using moment analysis and DTA in more than 140 production-scale transitions. These methods have been applied in different settings to detect column degradation, establish control limits to monitor column performance, and assist in decision-making on column repacking.
Materials and Methods
Production-Scale Chromatography Data: We used a range of production-scale columns (diameters of 120–140 cm; column volumes of 237–462 L, and column bed heights of 13–30 cm) and two chromatography modes (anion-exchange (AEX) and cation-exchange (CEX)). In-process chromatographic data were extracted from an OSIsoft PI ProcessBook data historian using Microsoft Excel software. For calculation, we paired data points from extracted column outlets (conductivity or pH, hereafter referred to as solute signals) with 1.5- or 2-second intervals and corresponding totalized column volumes. Extracted data cover not only transition points but also pre- and post-transition volumes. Because data noise in a solute signal can make evaluation difficult, we used noise filtering (e.g., the normalized and rolling averages of solute signal data) to overcome errors thus introduced.
Moment Analysis: To monitor HETP and asymmetry values across production cycles, we performed moment analysis (non-Gaussian HETP and Af) according to the method described by Larson et al (5). Before calculation, we min–max normalized the solute-signal data, with C representing the normalized solute signal data and V the totalized volume data paired with a solute signal. Linear regression can be used to estimate dC/dV numerically, and (dC/dV)max represents the maximum value of dC/dV.
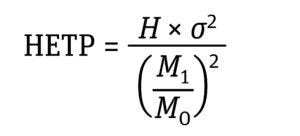
Equation 1: Determination of non-Gaussian HETP where H is the column height, σ2 is variance, M0 is the zeroth moment, and M1 is the first moment (7).
Equation 2: Determination of variance (σ2) expressed as the distribution’s moments where M2 is the second moment of the frequency distribution (7).

Equation 3: Determination of moments (Mn) where t is time and F(t) is the solute signal data. This time-based equation can be converted to a volume-based equation in which V is volume and C is a solute signal (5).

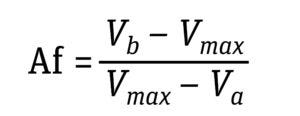
Equation 4: Determination of asymmetry factor (Af), where Vmax is the volume at which
dC/dV is maximum and Va and Vb are volumes at 10% of (dC/dV)max (5).
Direct Transition Analysis: To cover signal noise obtained from production-scale sensors and obtain more consistent contributes, we performed direct transition analysis (DTA) (6).
Equation 5: Determination of transwidth (column volume of band broadening) where CV95% is column volume at a normalized threshold of 95%, and CV5% is column volume at a normalized threshold of 5%.

Equation 6: Determination of direct Af as an average of all bi/ai where CVai is volume at 5%, 10%, 15%, 20%, 25%, and 30% of the normalized solute signal; CVbi is volume at 70%, 75%, 80%, 85%, 90%, and 95% of the normalized solute signal; and CVmid is 50% of the normalized solute signal (6).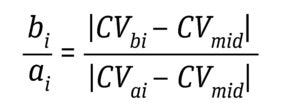
Establishing Statistical Control Limits: We established control limits based on 15 distinct in-process chromatographic data points calculated by moment analysis.
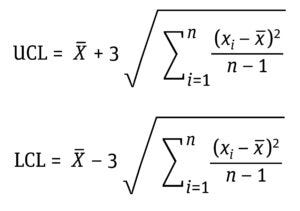
Equation 7: Determination of upper control limits (UCL) and lower control limits (LCL) as ±3 standard deviations (σ) from the mean (x–) where xi is the data value, and n is the number of data points.
Results and Discussion
Case Study 1 — Detection of an Integrity Breach in a Production-Scale Chromatography Column 120 cm in Diameter: An abnormal chromatogram was observed during the purification of a monoclonal antibody (MAb-1) using a 120-cm internal diameter (ID) column packed with noncompressible CEX resin. Investigations revealed a crack in the column as the root cause of the problem. To pinpoint the exact time of column degradation, we performed moment analysis and DTA using MAb-1 chromatography data from purification at scale.
We analyzed in-process chromatographic data from 34 runs and found that HETP values were outside the control limit (established with the first 15 runs) from the 23rd run onward. Asymmetry values also fluctuated, and transwidth values were higher than the upper control limit (UCL) from the 23rd run onward (Table 1 and Figure 1 a–c). In the 34th run, HETP and transwidth values dramatically increased to 2.18 and 1.07, respectively, while asymmetry and direct Af values decreased to 0.34 and 0.38, respectively (Table 1 and Figure 1 c and d). From these data, we can infer that column integrity had been degrading from the 23rd run and ultimately failed at the 34th run. Moreover, pulse-injection HETP test results after run 25 were twice higher than those from run 15, further supporting this inference.
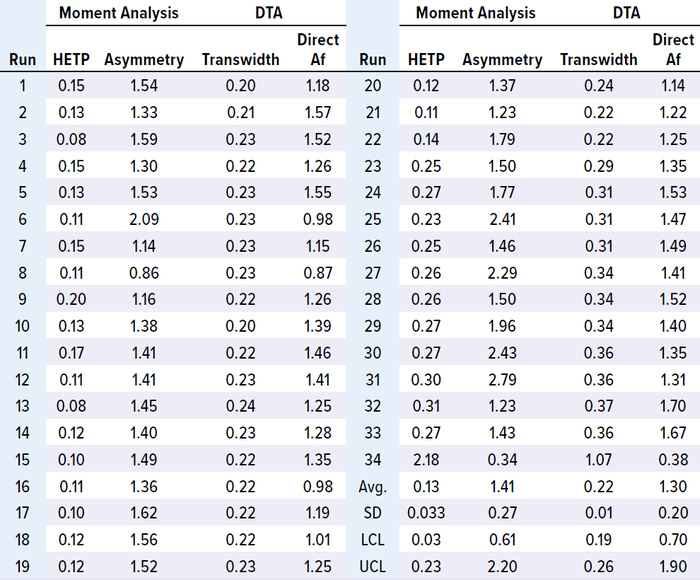
Table 1: Results of MAb-1 moment analysis and direct transition analysis (DTA).
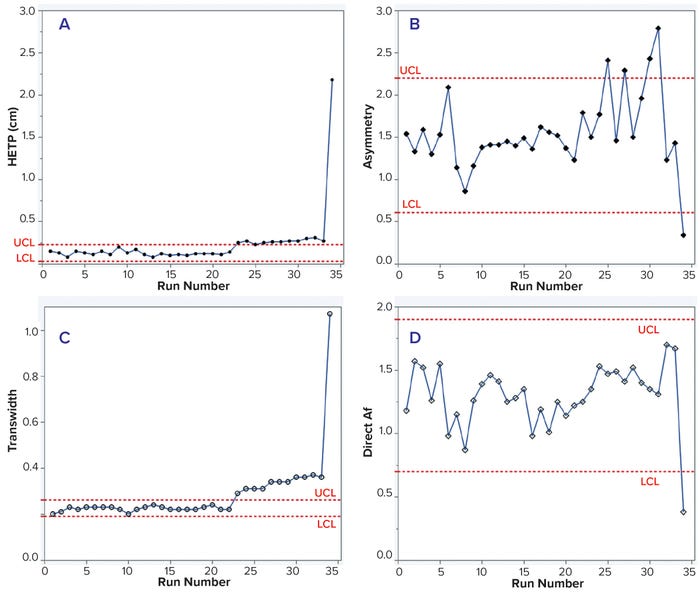
Figure 1: Trends of height equivalent to a theoretical plate (HETP, A) and asymmetry (B) calculated using moment analysis and transwidth (C), and direct asymmetry (Af, D) calculated using DTA for MAb-1 cation-exchange chromatography column runs with control limits.
This case study shows that changes in HETP and transwidth values could signal a breach of column integrity. If those values had been monitored during MAb-1 manufacturing, then the column integrity breaches could have been prevented. Furthermore, this case study demonstrates that moment analysis and DTA are sensitive enough to detect integrity breaches.
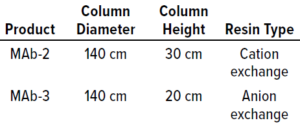
Table 2: Column and compressible resin types used in case study 2.
Case Study 2 — Routine Monitoring of Two Production-Scale Chromatography Columns 140 cm in Diameter: Column integrity breaches can be costly in the middle of downstream-process campaigns, considering the additional time required for investigation, column unpacking, repacking, and testing. In worst-case scenarios, large harvest pools might have to be discarded in short-cadence campaigns, ultimately leading to huge financial losses. This case study comes from routine monitoring of two 15,000-L MAb production campaigns with two days of cadence using large columns (Table 2).
HETP, transwidth, and direct Af values were within the control limits for 28 batches of both MAbs. In addition, HETP and transwidth were more consistent than were the asymmetry and direct Af values. However, measuring asymmetry depends highly on data quality — e.g., the sensitivity of solute signals, data noise, and transition characteristics — so results can vary with chromatographic transitions (Tables 3–4; Figures 2 and 3).
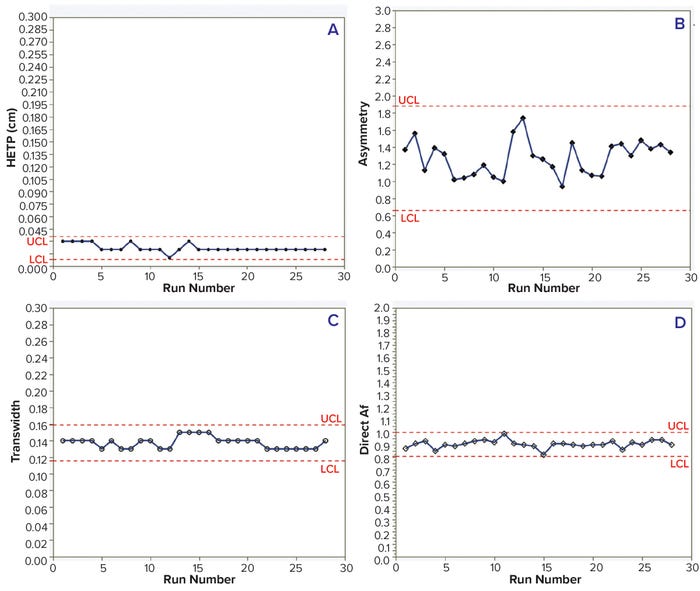
Figure 2: Trends of HETP (A) and asymmetry (B) calculated using moment analysis and transwidth (C), and direct Af (D) calculated using DTA for MAb-2 cation-exchange chromatography column runs with control limits.
Choosing “the right transition” is the most crucial consideration when using moment analysis and DTA for routine process monitoring at manufacturing scale. First, noninteracting solute signals from a column outlet should be identified, and the magnitude of the step change needs to be significant. The transition is inappropriate for analysis if a solute signal is saturated over the associated sensor. Once a transition is determined, the signal/noise ratio should be confirmed to determine whether the resulting data will be appropriate for calculation. The second step is to check the data-extract interval. Longer intervals can give discontinuous solute signals, and short intervals can introduce too many false signals.
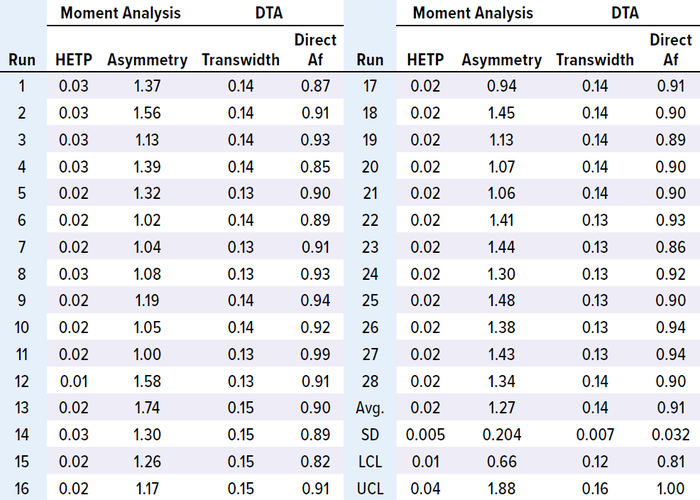
Table 3: Results of MAb-2 moment analysis and DTA.
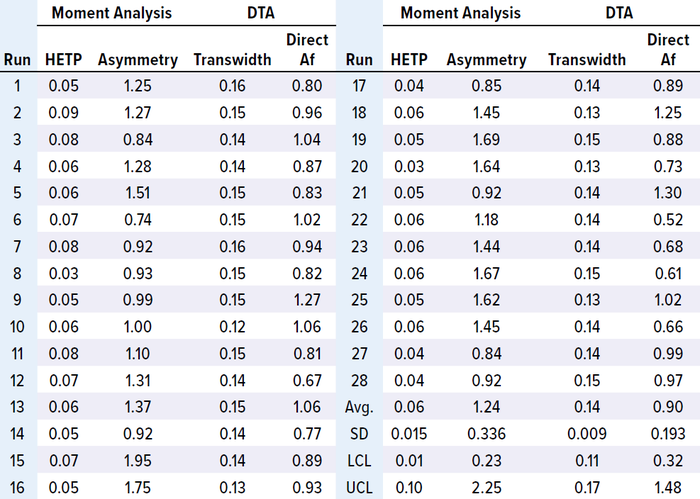
Table 4: Results of MAb-3 moment analysis and DTA.
In this case study, the data demonstrated that appropriate transitions had been selected, so control limits could be established for each chromatography run. Furthermore, the study shows that moment analysis and DTA can be valuable tools for routine monitoring of chromatography column performance, especially for long production campaigns with short cadences. The risks of process delay and/or harvest-pool loss can be mitigated by monitoring column performance and preparing a backup column. If moment analysis and DTA results indicate column degradation or breaches, then a process can be continued without delay using the backup column.
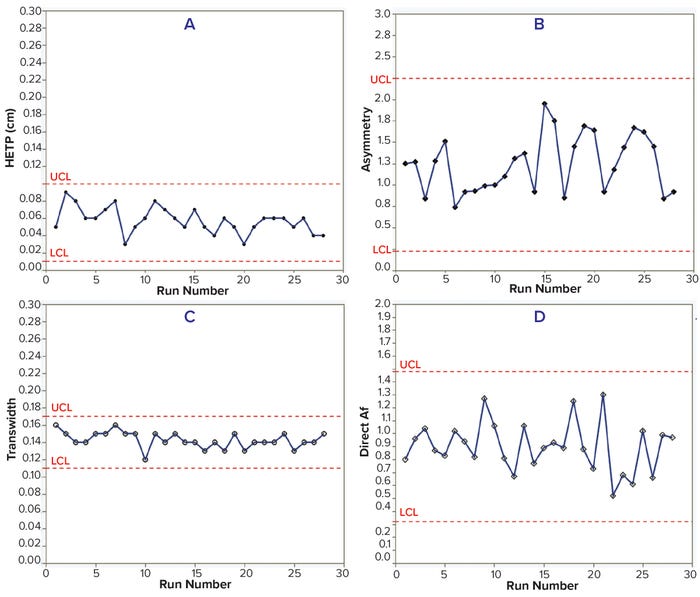
Figure 3: Trends of HETP (A) and asymmetry (B) calculated using moment analysis and transwidth (C), and direct Af (D) calculated using DTA for MAb-3 anion-exchange chromatography column runs with control limits.
Case Study 3 — Packing Evaluation of a Chromatography Column 140 cm in Diameter: Proper column packing ensures stable chromatographic performance over multiple processing cycles. In this case study, we used moment analysis and DTA to monitor a 140-cm ID column packed with CEX resin for downstream processing of a monoclonal antibody (MAb-4) over 36 runs. HETP, asymmetry, and direct Af values remained within control limits for 36 runs (Table 5 and Figure 4, a, b, and d). However, transwidth started to increase at run 16 and reached the UCL in run 19 (Table 5 and Figure 4c). Because of that transwidth excursion, we decided to repack the column, after which transwidths remained within the control limit. If the manufacturing campaign had proceeded without column-integrity monitoring, then a breach might have happened, as illustrated above in case study 1. Hence, early DTA assessment of column integrity can prevent column breaches during manufacturing campaigns.
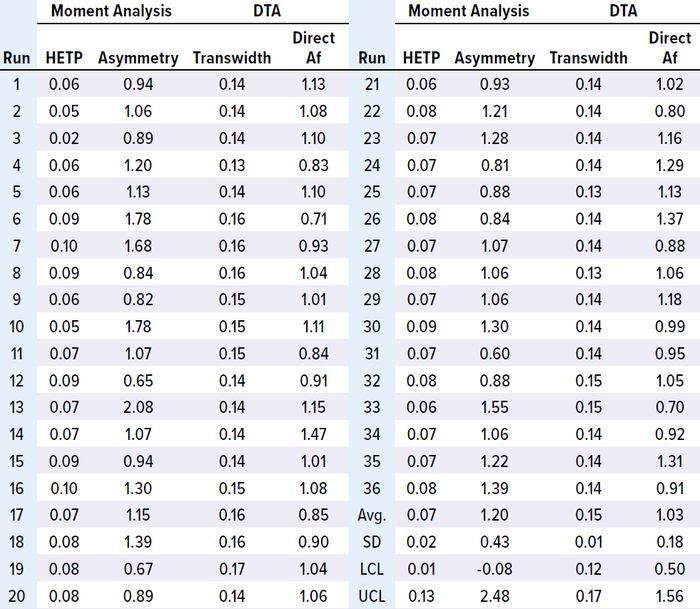
Table 5: Result of MAb-4 moment analysis and DTA.
Reduce Risk with Early Assessment
We studied moment analysis and DTA on in-process data from four MAb campaigns. Three case studies covering 140 transitions from different-sized production columns demonstrate that combining these techniques can provide an easy and reliable tool to monitor and evaluate chromatography-column performance and integrity. The analyses can be performed by applying simple sequential equations without specialized software. This approach is beneficial particularly for long production campaigns with short cadences because it can save cost, human resources, and time.
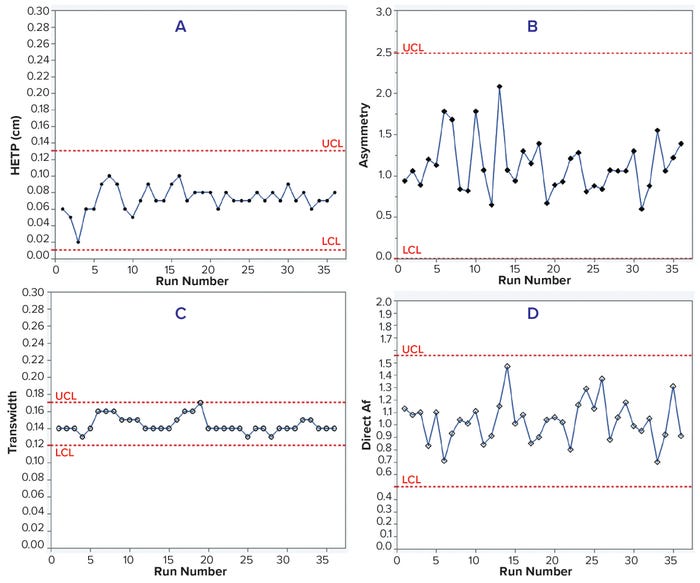
Figure 4: Trends of HETP (A) and asymmetry (B) calculated using moment analysis and transwidth (C), and direct Af (D) calculated using DTA for MAb-4 cation-exchange chromatography column runs with control limits.
Case study 1 demonstrated that moment analysis and DTA are sensitive enough to detect column integrity degradation and breaches. When a column started to degrade, HETP and transwidth values went beyond the control limit, and column failure was detected as a simultaneous spike of HETP and transwidth values with a drop of asymmetry and direct Af values.
Case study 2 showed that column-integrity monitoring using moment analysis and DTA can be applied to short-cadence campaigns (of, e.g., two to three days each). Control limits of HETP, asymmetry, transwidth, and direct Af were established based on moment analysis and DTA results and then used for monitoring column performance.
Case study 3 demonstrated that transwidth values obtained from DTA could help biomanufacturers detect subtle changes in column performance. At our company, we have integrated moment analysis with DTA in all column chromatography steps as a means to detect changes in column integrity, mitigate risks in short cadence campaigns, and guide column preparation. Implementing such early assessment tools helps us minimize risks and save cost and time during large-scale protein manufacturing.
References
1 Hofmann M. Novel Technology for Packing and Unpacking Pilot and Production Scale Columns. J. Chromatogr. A 796(1) 1998: 75–80; https://doi.org/10.1016/s0021-9673(97)00727-9.
2 Gondkar S, et al. Effect of Adsorbent Porosity on Performance of Expanded Bed Chromatography of Proteins. Biotechnol. Prog. 17(3) 2001: 522–529; https://doi.org/10.1021/bp010029m.
3 Moscariello J, et al. Characterizing the Performance of Industrial-Scale Columns. J. Chromatogr. A 908(1–2) 2001: 131–141; https://doi.org/10.1016/s0021-9673(00)01062-1.
4 Williams A, et al. Maintenance of Column Performance at Scale. J. Chromatogr. A 944(1–2) 2002: 69–75; http://dx.doi.org/10.1016/S0021-9673(01)01237-7.
5 Larson TM, et al. Use of Process Data To Assess Chromatographic Performance in Production Scale Protein Purification Columns. Biotechnol. Prog. 19, 2003: 485–492; https://doi.org/10.1021/bp025639g.
6 Cui Y, Huang Z, Prior J. Using Direct Transition Analysis in Chromatography. BioPharm Int. 31(1) 2018: 34–40; https://www.biopharminternational.com/view/using-direct-transition-analysis-chromatography.
7 McCoy B, Goto M. Continuous-Mixture Model of Chromatographic Separations. Chem. Eng. Sci. 49(14) 1994: 2351–2357; https://doi.org/10.1016/0009-2509%2894%29E0042-O.
Nahee Kim and Soonbin Kwon are senior scientists, Yeonha Kim is a scientist, and Gowoon Kim is part lead of late-stage downstream processing; Youngsun Kim is team lead of the early and late-stage downstream process manufacturing science and technology team; and corresponding author Lalit Saxena ([email protected]) is group lead of the late-stage downstream process manufacturing science and technology team (MSAT) at Samsung Biologics, 300 Songdo bio-daero, Yeonsu-gu, Incheon 21987, Republic of Korea 82-32-455-3114; https://samsungbiologics.com.
You May Also Like


