Accounting for Portfolio Risk: Creating an Analytical Framework for Optimizing the Portfolio MixAccounting for Portfolio Risk: Creating an Analytical Framework for Optimizing the Portfolio Mix
December 16, 2015
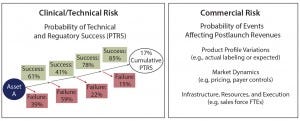
Figure 1: Sources of risk for portfolio assets
In the biopharmaceutical industry, portfolio risk is categorized as clinical/technical or commercial (Figure 1). Both types pose challenges to quantify. Portfolio managers tasked with optimizing the mix of products in a company’s pipeline often struggle to create apples-to-apples frameworks that can consistently compare risk across asset categories. The framework described herein can help you account for both technical and commercial risk using simple analytical tools.
The foundational analytical element of portfolio management is traditionally the asset forecast: a composite best estimate of the most likely product profile. It is an assessment of the commercial market in which a product will play and is hoped to include some market research to determine that product’s value proposition in the marketplace. Although it is an important exercise in its own right, the forecast alone cannot be the single metric on which portfolio optimization is based. A potentially high-value asset is an important component of any portfolio. But the forecast alone does not do enough to quantify the risk inherent in an asset, either clinically or commercially.
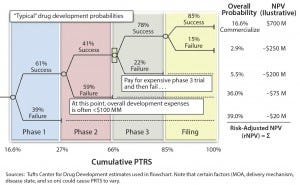
Figure 2: Quantifying clinical/technical risk using a decision tree; PTRS = probability of technical and regulatory success; NPV = net present value
Clinical or technical risk describes a product’s likelihood of progressing past each trial milestone and of ultimately achieving approval by regulators (e.g., US Food and Drug Administration or European Medicines Agency). It is best quantified by a decision-tree format with each node of the tree representing a clinical or technical outcome (Figure 2).
A probability of success (PoS) can be applied to each phase of development (based on historical outcomes from representative products) and then matched to a therapy area (e.g., neuroscience or oncology) and type of product (e.g., small molecule or biologic). The PoS at each node is then multiplied by the product’s net present value (NPV) at that point in development (accounting for the clinical/commercial investments and product return associated with that outcome). Note that this risk-adjusted NPV (rNPV or eNPV) is not equal to simply multiplying the product’s overall PoS by the forecasted NPV. It accounts for the appropriate matching of costs by scenario.
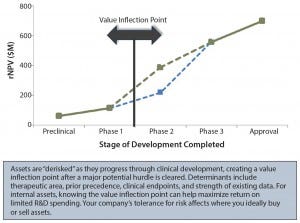
Figure 3: Identifying value inflection points; rNPV = risk-adjusted net present value
It is crucial to identify where the value inflection points fall, as well as the points after which rNPV value jumps significantly (Figure 3). For example, is that jump after phase 2 or phase 3? These points are indicators of how much investment will be necessary before value is created or the asset is “derisked.” Ideally, a company’s full portfolio will include a number of derisked assets or pathways to balance potentially riskier opportunities.
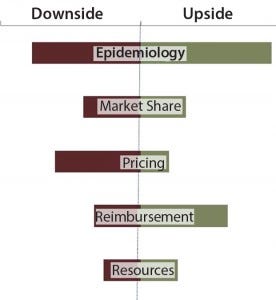
Figure 4: Assessing commercial risk through upside/downside forecasts
Commercial risk stems from inherent unknowns in both what a product will ultimately deliver and what market dynamics will be at launch. This risk can be handled in many ways: as an upside/downside forecast assessment (Figure 4) or in a more sophisticated Monte Carlo simulation (Figure 5). Either option works for the purpose. It is the mentality behind the assumptions that is the more important exercise. You must ask yourself, “Have we done enough market research to understand the range of outcomes associated with our product? What is the worst-case (but approvable) forecast? What is the best?” The absolute value of the range between best and worst is the most important metric with which to make comparisons between assets.
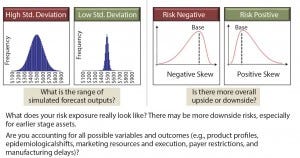
Figure 5: Assessing commercial risk through Monte Carlo simulation, which is a valuable tool for quantifying the risk profile of your assets, if the inputs are accurate.
Finding Balance
When you juxtapose clinical and commercial risk of either a portfolio of assets or a range of development opportunities for the same asset, the goal (as in any investing) is to have a balanced portfolio. High-risk, high-reward opportunities are not bad if they are balanced by less risky alternatives in the portfolio and if they leverage your core competencies to the extent that your company is the best one to develop them. A simple plot of all products in your portfolio will help you visualize the comparison of value and risk, creating an apples-to-apples framework across divergent opportunities (Figure 6).
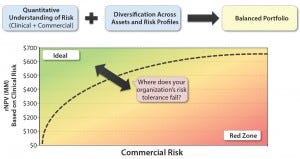
Figure 6: The composite of value and risk; is your portfolio optimized?
That framework will help you to engage in honest conversations with your stakeholders around the trade-off of value and risk, ultimately prioritizing promising assets and deprioritizing those that do not provide enough risk-adjusted value. Herein lies the art of determining your company’s threshold for risk (and financing) to make these decisions as expediently and objectively as possible.
Further Reading at www.bioprocessintl.com |
|---|
Hutchinson N. Understanding and Controlling Sources of Process Variation. 12(9) 2014. |
CMC Strategy Forum, Part 1: QbD and Risk Management. 13(1) 2015. |
Little TA. Quality Risk Management for Drug Products and Drug Products. 12(4) 2014. |
Locwin B. Quality Risk Assessment Strategies for Biopharmaceutical Companies. 11(11) 2013. |
Peuker T, Monge M. Implementing Flexible, Scalable, and Cost-Efficient Bioprocess Platforms: A Proven Project Management Approach. 13(3) 2015. |
Kilian R. Managing Contamination Risk While Maintaining Quality in CellTherapy Manufacturing. 11(3) 2013. |
Davidson S. Risk Assessment and Business Impact Analysis of the Supply Chain. 11(1) 2013. |
Leslie Sandberg Orne is a senior partner at Trinity Partners. She coleads the consulting group and is responsible for Trinity’s pharmaceutical, biotechnology, and medical device clients; 1-781-577-6313; lsandberg@ trinitypartners.com.
You May Also Like


