Revenue per FTE and Cost per FTE: Metrics of Operational Efficiency and PerformanceRevenue per FTE and Cost per FTE: Metrics of Operational Efficiency and Performance
December 11, 2014
https://bioprocessintl.com/wp-content/uploads/2014/12/122014_Jain.mp3 www.graphicstock.com
Revenue from operations (herein referred to as revenue) and operating cost (herein referred to as cost) are two independent sentinels of a corporation’s performance and return on investment (ROI), which is defined as the ratio of revenue to cost (revenue/cost). Although a company can actively manage cost by controlling its number of full-time employees (FTEs) and the number or type of activities, it cannot directly manage revenue. Revenue is entirely driven by market forces. So if a company experiences a decrease in revenue, then cost also must be reduced by the same fraction to maintain ROI. However, none of these three parameters alone (revenue, cost, and ROI) provides information about the operational efficiency of a company. To expand on this point, scenarios for two hypothetical companies (A and B) in the same industry are described below.
Revenue: Company A generates $1,000 revenue with 10 FTEs (or equipment), and Company B generates $10,000 revenue with 200 FTE (or equipment). Although Company B is generating 10-fold higher revenue than Company A, that revenue is achieved through 20-fold greater resources. That suggests that Company B is less operationally efficient for revenue than is Company A. So operational efficiency is not reflected by revenue as a metric.
Cost: Company A incurs a cost of $500 for 10 FTEs, and Company B incurs a cost of $5,000 for 200 FTEs. Although Company B has 10-fold higher costs than Company A, Company B is supporting 20-fold more resources than is Company A. That suggests that Company B is more operationally efficient for cost than is Company A. Operational efficiency again is not reflected by cost as a metric.
ROI: ROIs for both Company A and Company B are both equal to two (revenue/cost). But that alone is not representative of operational efficiency for revenue or cost.
Hence, there is a need to look beyond the traditional metrics of a company’s performance to identify metrics that reflect operational efficiency for revenue and cost. Metrics of revenue per FTE (RPF) and cost per FTE (CPF) have been mentioned in literature in the context of operations (1–3). Here, RPF and CPF have been demonstrated as suitable metrics of operational efficiency and performance.
Although those metrics can be applied to any industry, this article focuses on the biopharmaceutical industry. Although both revenue and cost typically increase with — and are skewed by — a company’s size, RPF and CPF are shown in this article to differentiate companies based on product characteristic because these metrics are not skewed by company size. Further, graphs of RPF and CPF with FTE form asymptotic curves that define an “industry standard” performance. These asymptotic curves are useful for optimizing operational efficiency and maximizing ROI. The article describes a retrospective case study of Pfizer’s acquisition of Wyeth in 2009 using RPF and CPF metrics. The success of this acquisition was marked by RPF value in 2013 that was higher than the additive metric for Pfizer and Wyeth (based on 2008 data) as well as the “industry standard” curve while maintaining CPF relatively unchanged.
Theory
The relationships between revenue and cost with FTE was determined. The theoretical basis is described below.
Revenue can be calculated as the average revenue per product multiplied by the number of products. The average revenue per product is based on market size, competitive situation, and marketing efforts, which are generally independent of a biopharmaceutical company’s size. However, experience curve suggests that (because of efficiencies and synergy) an increase in FTE creates an even higher increase in the number of products (4). That can be written as (number of products) ∝ (FTE)a (for a > 1); or revenue ∝ (FTE)a. So revenue = k1(FTE)n1 (Equation 1).
Cost can be calculated as the average cost per activity multiplied by the number of activities. Experience curve suggests that an increase in number of activities decreases the cost per activity through efficiencies and synergies (4). So that relationship can be written as follows: (average cost per activity) ∝ (number of activities)a — for a < 0. It can be written as cost ∝ (number of activities)(1 + a) These activities are performed by employees. As per experience curve (because of efficiencies and synergies), an increase in the number of FTEs creates an even higher increase in number of activities (4). That can be written as following: number of activities ∝ (FTE)b for b > 1. Therefore cost ∝ (FTE)b(1 + a) or cost = k2(FTE)n2 (Equation 2).
ROI can be calculated as ROI = revenue/cost = (k1/k2)FTE(n1 – n2) If a company leverages efficiencies and synergy effectively, then revenue will increase faster than linear and cost will increase at a slower than linear rate than FTE (n1 > 1 and n2 < 1). Equivalently, RPF will increase with the number of FTEs, whereas CPF will decrease with the number of FTEs. Alternatively, if a company becomes organizationally complex and less efficient as its size increases such that n1 < 1 and n2 > 1, then RPF will decrease with the number of FTEs and CPF will increase with the number of FTEs. Thus, RPF and CPF values are hypothesized as appropriate metrics of operational efficiency.
To evaluate those metrics, SMC analyzed historical (2013) financial data from multiple US biopharmaceutical companies. The study focused on US companies to minimize deviations as a result of currency exchange rates (financial results reported in $US). The study included the assumption that US biopharmaceutical companies have similar organizational and operational structures regardless of their product characteristic, size, and geographical distribution. So the values of the constants k1 and k2 are similar in Equations 1 and 2 for all companies included in this analysis.
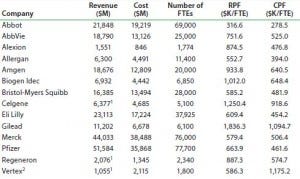
Table 1: Summary of 2013 financial data of US biopharmaceutical companies
1 Revenue from royalty and technology licensing was excluded.
2 For the analysis, Vertex Pharmaceuticals was excluded due to operating loss (revenue < cost)
Analysis of Historical Financial Data
Table 1 summarizes 2013 financial data obtained from the SEC 10k reports filed by multiiple US biopharmaceutical companies. Revenue from technology licensing and royalty was excluded so that the analysis is based on the revenue from core operations only.
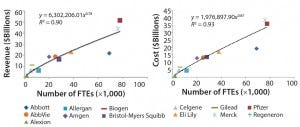
Figure 1: Curve-fits of historical financial data to Equation 1 (left) and Equation 2 (right).
Those historical financial data were fitted to Equations 1 and 2 as shown in Figure 1. Table 2 lists the parameter values k1, k2, n1, and n2. The curve-fits of the historical data in Figure 1 is based on the assumption that the k1 and k2 values are similar for all biopharmaceutical companies. Because these curve-fits are associated with high R2 values (≥0.90), the assumption that the k1 and k2 values are comparable for all companies is confirmed to be valid.
Table 2: Parameter values from the curve fits of historical financial data to Equations 1 and 2
Parameter | Value |
|---|---|
k1 | 6,302,206 |
k2 | 1,976,898 |
n1 | 0.78 |
n2 | 0.87 |
Because both n1 and n2 are >0, both revenue and cost increase with an increase in company size (Figure 2 left). Figure 2 (left) shows that larger companies such as Pfizer are at the higher end of the graph, whereas smaller companies such as Alexion are at the lower end. However, when RPF and CPF are used as metrics, the primarily biologics companies are placed higher (outlined by red box) than the primarily small-molecule (and additionally, in some cases, vaccines, consumer health, and animal health products) companies (outlined by purple box) (Figure 2 right). Therefore, the metrics RPF and CPF differentiate companies based on their product characteristic and are not skewed by company size, unlike traditional metrics of revenue and cost.
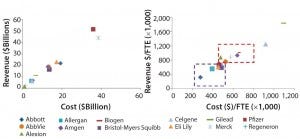
Figure 2: Revenue and cost (left); revenue per FTE and cost per FTE (right)
We studied how RPF and CPF metrics change with the size of the biopharmaceutical company (Figure 3). The asymptotic curves of both metrics with the size of the company define the performance of the biopharmaceutical industry and the point at which company metrics should fall to match the “industry standard.” Those asymptotic curves can be used to optimize operations for ROI maximization, as described below.
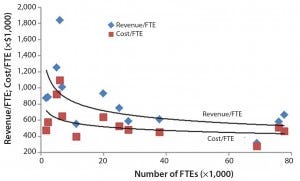
Figure 3: Revenue per FTE and cost per FTE and number of FTEs
Using Revenue/FTE and Cost/FTE for Operational Efficiency
Figure 3 shows the relationship between RPF and CPF. Both metrics can be used to maximize ROI during routine operations and in a merger and acquisition (M&A).
Maximization of ROI During Routine Operations: The curves in Figure 4 (adapted from Figure 3) define where a company’s metrics should fall to match the industry standard: RPF for a company should fall on the top curve, and CPF should fall on the bottom curve. A company can achieve ROI that outperforms the industry standard by either or both RPF in “Outside 2” and CPF in “Outside 1” regions. An RPF value in the “Inside” region is indicates a primarily low-value portfolio, and a CPF value in the “Inside” region suggests that the organization has inefficient operations. Therefore, if either metrics falls in the Inside region, a company must take action to adjust that metric accordingly. The matrix in Figures 4 summarizes the recommended actions to maximize ROI based on those asymptotic curves.
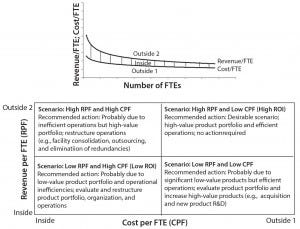
Figure 4: Asymptotic curves of revenue per FTE and cost per FTE based on Figure 3 along with the depiction of inside and outside regions (top); recommended actions to maximize ROI using these asymptotic curves (bottom)
An alternative approach for larger biopharmaceutical companies to maximize ROI is to create strategic business units (SBUs). Creation of SBUs will reduce organizational complexity and encourage entrepreneurial culture within the company while maintaining synergies, thereby increasing RPF values. Although SBUs perform independently, being part of a larger organization will leverage synergies and reduce CPF. Through this alternative approach, larger biopharmaceutical companies can use their size to obtain benefits that can be challenging to obtain otherwise.
Maximizing ROI During M&A Scenario: M&A is a strategy for increasing revenue by merging with and/or acquiring another company. M&A not only adds revenue, but also brings additional cost. Simply increasing revenue through M&A does not increase ROI until synergies between the two companies are exploited to increase revenue and decrease cost compared with the additive value. By leveraging synergies, the (combined) company will increase ROI and will increase shareholder ROI. A retrospective case study of M&A is presented below using RPF and CPF metrics.
Acquisition of Wyeth Pharmaceuticals by Pfizer in 2009: Pfizer acquired Wyeth through a megamerger deal in 2009. To analyze this M&A, SMC calculated both metrics before the acquisition (2008), for the first full-year after that acquisition (2010) and for long-term postacquisition (2013). Following the acquisition, both metrics of RPF and CPF increased in 2010 to higher than the additive and asymptotic curves (Figure 5).
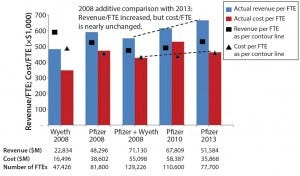
Figure 5: Revenue per FTE and cost per FTE for Pfizer and Wyeth before and after Pfizer’s acquisition of Wyeth in 2009; Pfizer + Wyeth is the theoretical additive scenario for the two companies.
Although RPF being higher than the additive and the asymptotic curve was desirable, the CPF metric was not desirable. The matrix in Figure 4 recommends restructuring operations to reduce CPF. That scenario was further complicated by the impending patent expiration of Lipitor in 2011 (with a consequent decrease in revenue). Between 2010 and 2013, Pfizer significantly restructured operations to decrease number of FTEs (30%) and cost (39%) while revenue decreased (24%). The combination of those efforts resulted in CPF comparable to the additive and asymptotic curve while maintaining RPF above both comparators. This confirms that Pfizer was able to successfully optimize its operations and increase ROI following the acquisition of Wyeth in 2009. Similar analysis is recommended to other biopharmaceutical companies evaluating the success of their M&A activities.
Suitable Metrics
RPF and CPF are suitable metrics of operational efficiency and performance of biopharmaceutical companies. Although revenue and cost are skewed by company size, RPF and CPF differentiate companies based on their product characteristics and are not skewed by company size. The ability of these metrics to compare biopharmaceutical companies regardless of their size clearly highlights the need for all companies to evaluate their performance using these metrics. Specifically, these metrics and the asymptotic curves defined by them can be used to
optimize operations by adjusting the number of FTEs for ROI maximization
evaluate performance and maximize ROI of strategic business units as part of corporate strategy, and
evaluate and increase operational efficiency during mergers and acquisitions to increase shareholders’ ROI.
References
1 Dunn K. Revenue per Employee: The Only Performance Goal You’ll Ever Need for HR Managers; www.hrexaminer.com/revenue-per- employee-the-only-performance-goal-youll- ever-need-for-hr-leaders.
2 World-Class HR Organizations Spend 27 Percent Less, Operate With 24 Percent Fewer Staff. The Hackett Group, 31 January 2013, www.thehackettgroup.com/about/research- alerts-press-releases/2013/01312013-world- class-hr-organizations-spend-less.jsp.
3 Cross RL, Martin RD, Weiss LM. Mapping the Value of Employee Collaboration. McKinsey Quarterly 3 (2006): 29–41.
4 Stern CW, Deimler MS, Eds. The Boston Consulting Group on Strategy: Classic Concepts and New Perspectives. John Wiley & Sons: Hoboken, NJ, 2006.
Siddhartha Jain is a managing partner at SMC Consulting Group LLC, 404 Brunswick Drive, Troy, NY 12180; sid.jain@smcstrategy. com.
You May Also Like


