Worldwide Biopharmaceutical Manufacturing Capacity Analysis: Growth Continues Across the BoardWorldwide Biopharmaceutical Manufacturing Capacity Analysis: Growth Continues Across the Board

ADOBE STOCK (HTTPS://STOCK.ADOBE.COM), FREE IMAGES (WWW.FREEIMAGES.COM), AND CHERYL SCOTT
While the growth in biopharmaceutical manufacturing capacity in developed, major market countries is continuing its slow and steady climb, developing regions often are seeing double that growth rate. Over the past eight years, as detailed in the “About the Data” box, our company’s index of the top 1,000 biomanufacturing facilities (1) has tracked and ranked bioprocessing facilities worldwide in terms of
known or estimated bioprocessing capacity (cumulative onsite bioreactor volume)
number of biological products manufactured at clinical scale
commercial scale
bioprocessing-related employment.
Significant strategic implications come with those changes in growth rates, especially in developing regions. As production of biologics becomes more globalized, we are regularly seeing active pharmaceutical ingredients (APIs) produced in one region, fill–finish activities performed in another, and marketing and sales done in yet another. As more opportunities develop outside the US/EU markets, both biologics innovators and their suppliers are considering how these shifts in growth require predictive plans.
Our database now tracks over 16.5 million liters of active production capacity at more than 1,500 facilities worldwide. That includes 6 million liters (37%) in the United States and Canada, 5.5 million liters in Western Europe (33%), and 4.7 million liters (25%) in the Asia–Pacific region, with 870,000 liters in China and 941,000 liters in India. Those capacity figures are higher than some reported capacity data, partly because we include all global active capacity, including facilities making human and veterinary vaccines, vaccines, and “biogenerics” capacity — noncompliant with good manufacturing practices (GMPs) — used for therapeutics in lesser regulated markets.
Although non-GMP facilities currently do not sell biologics on regulated Western markets, they are part of global capacity. Such emerging global facilities need their own biomanufacturing tools, technologies, and services. As their importance to their own local/regional drug markets increases, many of these facilities eventually (in the not-so-distant future) could be producing APIs, biosimilars, or even finished innovative biologics for global markets. So it is important strategically for the industry to track such regional growth. Much current biomanufacturing capacity being added in developing countries is targeting those biomanufacturers’ domestic markets, but that is likely to change as such facilities achieve their production quality goals and increasingly reach for developed-market export opportunities.
Advances in bringing biomanufacturing capacity online have been notable particularly in China and India (2, 3). Biopharmaceutical contract manufacturing organization (CMO) capacity is growing in China, especially as its regulations are changing to allow third parties to manufacture clinical and commercial biopharmaceutical products. The country is building capacity and adopting newer technologies faster than India and thus will pull ahead of it in biomanufacturing and related services. That has translated to a significant influx of investment. China recently bested India in its number of biopharmaceutical facilities — now with >50% more facilities, although its average facility size is significantly smaller than India’s. Much of India’s well-established biomanufacturing expertise and capacity is in vaccines production, whereas China intends to expand in a broader range of product platforms.
Capacity is growing faster in developing countries than in the major Western markets. But note that members of the former group, especially China, recently have begun from relatively low baselines, so that growth rate is not likely to continue over the long term. Such developing countries are unlikely to represent an immediate threat to US and European dominance in the biopharmaceutical industry, especially for the most profitable activities of innovative product development and GMP manufacturing.
Demand for Bioprocess Equipment and Supplies
Many companies outside the West are establishing commercial-scale biomanufacturing and CMO facilities to serve both domestic and regional needs. According to our studies of China and India, many such companies are targeting eventual CGMP-compliant manufacturing to supply Western markets (2, 3). Doing so will require technologies that meet both GMP and industry standards. We already see markets for bioprocessing supplies and services increasing significantly in those developing countries. Some major bioprocessing suppliers report double-digit sales growth in the Asian markets. At present, very little such equipment and supplies are manufactured in developing countries. Nearly all companies in China, India, Brazil, and elsewhere targeting eventual sales in highly regulated countries are buying US- and EU-sourced “GMP-ready” bioprocessing supplies. Thus, the demand in developing regions for such tools and services is continuing to grow, so Western technology and suppliers will continue to expand in the developing world as domestic revenues increase.
One strategic consideration is the current relatively high cost of Western materials, equipment, and supplies. Such expenses are creating demand potential for domestic/regional suppliers outside the West that can develop acceptable alternatives at lower cost. And as such domestic suppliers emerge, they will create competition for Western suppliers — not just locally, but also possibly in their home markets. Single-use devices, bags, tubing, and filters are a few examples. Chinese suppliers already are developing alternatives to Western equipment and bioprocess materials. And although most may not meet industry standards today, these competitive suppliers are likely to promote their devices (with GMP quality) to Western markets in the future.
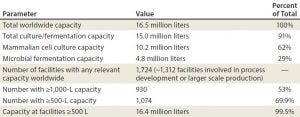
Table 1: Worldwide capacity and facilities summary data
Global Facility Capacity Distribution
Biopharmaceutical manufacturing itself represents the great majority of the world’s biomanufacturing-related capacity, supplies, and services — with research and development (R&D) facilities representing just a small portion of that. We estimate from aggregated data that total worldwide bioprocessing capacity is now about 16.5 million liters. Table 1 lists top-level capacity and facilities data.
Our free online database indexes the global top 1,000 biopharmaceutical facilities and contains records for facilities with ≥500-L capacity, accounting for 99.5% of the total worldwide capacity (1). Facilities with ≥1,000-L capacity generally are involved in commercial-products manufacturing, with 98.7% of worldwide capacity. An estimated 68% of the ≥15 million liters of culture/fermentation-based capacity (excluding capacity for blood/plasma products) is based on mammalian cells (~10.2 million liters), the great majority for MAb manufacture and nearly all using Chinese hamster ovary (CHO) host cells. Nearly all the rest — just under five million liters — is microbial (most of which is using Escherichia coli host cells).
Our database does include a growing number of cellular and gene therapy facilities, but so far only a few of these fit the criteria to make the Top1000bio.com list. Among these facilities, most current capacity is used for manufacturing viral vectors used with gene therapy, including some facilities having scaled up to bioreactors of 1,000-L to 2,000-L scale (4). By contrast, capacity used for cellular therapies generally remains at much lower scales, with many sites manufacturing just a single patient’s cellular therapy for each process line. Besides, few of those products yet are manufactured at the commercial level.
Global Bioprocessing Hotspots: The United States and Western Europe continue to lead in biopharmaceutical R&D based on the number of companies involved, their manufacturing activities, and revenues. That is reflected in facilities and capacity data: North America is the leading region in terms of manufacturing capacity (~6.0 million liters, with ~5.6 million of that in the United States) and very closely followed by Europe (~5.5 million liters).
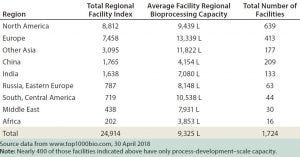
Table 2: Regional bioprocessing concentrations based on facility index ranking
The ratio of a country’s or a region’s total capacity to its number of facilities (“average capacity per facility” in Table 2) is related to its average facility size (capacity). Western Europe has facilities with larger average capacity than those in Canada and the United States. The latter has proportionately more R&D and smaller facilities (based on single-use technologies). Asia is home to about 85% of the number of facilities that Western Europe has, with significantly less total capacity.
By far, the United States boasts the largest number of biopharmaceutical manufacturing facilities (592). But China, which ranks second, has 209 facilities, with about half the US average capacity/facility. With a very large domestic market primarily for biogenerics and vaccines, China now ranks fifth worldwide in total capacity. Its many facilities have low average capacity.
Whether China and other developing countries will adopt now classic bioprocessing (e.g., ≥10,000-L stainless steel bioreactors for commercial MAb manufacturing) or adopt scaling-out with multiple 1,000-L to 2,000-L disposable-based biomanufacturing schemes remains to be seen. However, most facilities in China and other developing countries typically are not large, and large-scale MAb production could use either approach. Among the top countries (those with ≥250,000 L), China is the only one whose manufacturing generally does not meet the GMP standards of highly developed countries.
Only three countries boast a total capacity near a million liters or more: the United States, India, and Ireland. Indian facilities provide much of the world’s biogenerics, and Ireland is home to many of the very largest bioprocessing facilities for leading MAb products. A second tier of just six countries sits in the range of 500,000–1,000,000 L, the next group of nine countries have capacity in the range of 250,000–500,000 L, and six more are home to 100,000– 250,000 L, with all other countries having <100,000 L total capacity.
In average capacity, the 10 counties with the largest average facility capacity are Ireland, Singapore, Austria, (South) Korea, Belgium, Brazil, Switzerland, Japan, Italy, and Iceland (with >15,000 L each). These countries generally have much more commercial manufacturing than R&D activity and facilities. Much like Ireland, Singapore is home to many of the largest international company facilities that supply regional Asian markets.
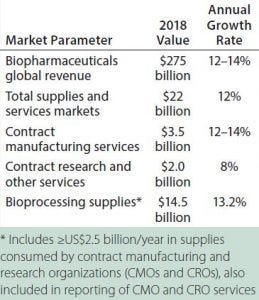
Table 3: Biomanufacturing-related market estimates for 2018
A total of 522 facilities are indexed as offering CMO services, holding ~3.5 million liters of capacity (19.8% of that worldwide) at an average of 6,715 L/facility. That number may be an overestimate, however, because some biologics developers also use their manufacturing facilities to offer CMO services, and some CMO-allocated capacity may not be open for contract operations. Thus, the actual dedicated capacity for CMO services would be lower. A total of 193 facilities are indexed as involved in biosimilars/biogenerics manufacturing, with a total of ~2.3 million liters in capacity (13% of that worldwide) at an average of ~11,900 L/facility. Some of those facilities also manufacture mainstream products, and most (117) are located in Asia.
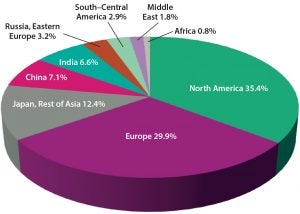
Figure 1: Global bioprocessing operations concentration (by facility index)
Regional Concentration of Bioprocessing: Capacity is just one measure of a region’s bioprocessing presence. To assess a region’s capability more accurately, we established a facility-ranking system. By summing a region’s overall ranking factors, we can compare bioprocessing competence and strength. These rankings are based on four factors: capacity, bioprocessing staff, number of commercial biologics made, and number of clinical-scale biologics produced. Those data create a ranking number for each facility. The resulting index is used to define a region’s overall bioprocessing concentration. Our index numbers can be used to compare and predict where robust capacity and bioprocessing employment are based. Table 2 shows the regional distribution of facilities and capacity worldwide.
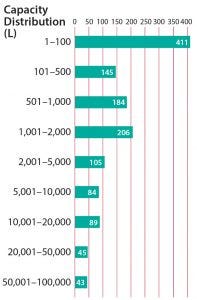
Figure 2: Distribution of worldwide facilities by capacity size range
Global Capacity Distribution
The largest number of facilities are in the range of 100–500 L. That includes many involved in process development and making early clinical supplies. Among facilities in this range, 84% are located in the United States or Europe, which reflects those countries’ strength in R&D. We expect the smaller cluster encompassing the range of 2,001–5,000 L to grow, including many single-use facilities coming online in this size range.
Companies and Products Distribution: Table 4 lists a few total capacity estimates for major capacity-holding companies. All have multiple facilities, generally on different continents to supply regional markets and/or serve as backups. Nearly all companies with the largest capacities are making major MAb products, with some of them manufacturing vaccines. Sanofi (including its Genzyme subsidiary) has the most estimated capacity, much of that vaccine-related, followed by a number of other companies with blockbuster (≥$1 billion/year sales) MAbs and other products. Among leading capacity holders, nearly all are based (headquarters) in the United States or Western Europe. And of the largest facilities, the only ones outside those regions are Bio-Manguinhos in Brazil, Biocon in India, and Samsung and Celltrion in South Korea. Despite the vast size of its own domestic market, China does not yet have facilities or companies with >100,000-L capacity. Its largest facility is reported to have 77,000 L.
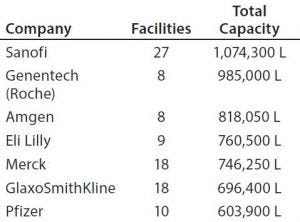
Table 4: Leading biopharmaceutical company capacity
Supplies and Services Markets: Based on our analyses over the past 28 years, the market for bioprocessing tools, materials, and services continues to grow at 12–14% annually (5, 6). The current worldwide market for biomanufacturing-related goods and services (the direct costs of such manufacturing) is ≥US$22.0 billion — ~8.0% of the total current biopharmaceutical revenues. That includes bioprocessing equipment, supplies, and services — e.g., CMOs, contract research organizations (CROs), and others.
So bioprocessing supplies represent a healthy, consistently growing market that tracks related biotherapeutic product revenue. Facilities performing late-stage — and particularly commercial — biomanufacturing account for ~90% of such consumption and revenue. (For example, the protein A resins used for initial MAb purification from a large-scale bioreactor run can cost millions of US dollars.) This includes the >600 facilities worldwide, each with ≥1,000 L in capacity known to be manufacturing commercial biologics.
Our company’s annual survey data show that the biopharmaceutical industry’s use of outsourcing is becoming more strategic and long term (5). Even “big-pharma” companies that formerly eliminated some in-house capabilities to cut staff and maximize outsourced operations now are taking a more sophisticated approach. Companies now evaluate and weigh their manufacturing options carefully, including assessing options from longer-term perspectives.
A Bright Future
Biopharmaceutical manufacturing capacity continues to expand around the world. This is driving growth of the related supplies-and-services market that closely parallels biopharmaceutical revenues, generally in the range of 12–14% per year. Expansions seen in emerging markets and for developing new technologies such as cell therapies indicate that this market growth is likely to continue. We believe that there is every reason to assume that future growth in biopharmaceutical sales will continue in kind, and along with it growth in markets for supplies and services. Measuring regional capacity and using concentration indexes over time are important ways to gauge the strategic relevance of regional segments.
About the Data Source |
|---|
The www.Top1000bio.com database covers all biomanufacturing facilities worldwide at any scale making biopharmaceuticals: biotechnology-derived therapeutics, including recombinant and nonrecombinant cell-culture– and fermentation-derived products. The coverage encompasses marketed therapeutic proteins, monoclonal antibodies (MAbs), vaccines, enzymes, cultured cellular products, and other biopharmaceuticals (both human and veterinary), and blood-derived cellular and plasma protein products. |
Manufacturing capacity is a measure of the near-term ability to manufacture commercial products. A facility’s bioprocessing capacity is defined as the cumulative or total onsite bioreactor volume. For example, a site with 2,000-L commercial production and a 10-L, a 100-L, and a 500-L bioreactor — whether those are used as feeder bioreactors or for (pre)clinical supplies or scale-up — has a total capacity of 2,610 L. Such cumulative bioreactor capacity has been accepted as the single best parameter to characterize bioprocessing capacity. |
Where facilities do not publicly report their capacity data, estimates are based on products manufactured, facility size, reported staff, and so on. Where capacity data are publicly reported only for end-stage production bioreactors, another ≤15% volume generally is added for seed train and other smaller in-house bioreactors. Where capacity is based on singleuse systems, the total used is either |
Rates of capacity use are not considered. For example, if capacity is used only three months of each year (25%), that does not affect capacity calculations. Where complex end products include biopharmaceutical components — e.g., antibodies and culture-derived toxins in antibody–drug conjugates (ADCs) — only capacity for that biomanufactured component is used. Where perfusion, whole plants, transgenic animals, or other nonbioreactor-based manufacturing are used (very rare), output is converted roughly to estimated equivalent conventional bioreactor capacities or the volume of intermediates moving to downstream processing. Coverage does not include antibiotics, other small molecules, or secondary metabolites manufacture. |
The database is worldwide in scope. Based on its extensive coverage of facilities in China and India, BioPlan Associates publishes directories of the top bioprocessing facilities in both countries (2, 3). Coverage also encompasses production of follow-on products (biosimilars, biogenerics, and biobetters) and an associated pipeline directory (7). Capacity currently under active construction also is included. Generally unused, mothballed facilities that can be available if needed, are not counted — including millions of liters of former antibiotics manufacturing capacity in the global industry. |
Data in the Top1000bio database for each facility include geographic location (city, country, and continent), company, estimated total onsite capacity (L), staffing, and the numbers of commercial and clinical-scale products manufactured (average/year), along with a derived index for ranking that takes all those factors into account. Data are derived from a number of sources including daily scanning of news sources, company websites, BioPlan Associates directories, and data submitted by users though a form at the Top1000bio.com website. |
References
1 Rader RA, Langer ES. Top 1000 Biopharmaceutical Facilities Index. BioPlan Associates: Rockville, MD, 2018; www.top1000bio.com.
2 Xia V, Yang LC, Langer ES. Directory of Top 60 Biopharmaceutical Manufacturers in China. BioPlan Associates: Rockville, MD, February 2017.
3 Langer ES, et al. Directory of Top 60 Biopharmaceutical Facilities in India. BioPlan Associates: Rockville, MD, September 2008.
4 Rader RA. Cell and Gene Therapies: Industry Faces Potential Capacity Shortages. Gen. Eng. Biotechnol. News 37(20) 2017.
5 Langer ES, et al. Report and Survey of Biopharmaceutical Manufacturing Capacity and Production, 15th Edition. BioPlan Associates: Rockville, MD, April 2018.
6 Rader RA, Langer ES. Thirty Years of Upstream Bioprocessing Improvements. BioProcess Int. 14(2) 2015: 10–14.
7 Rader RA. Biosimilars/Biobetters Pipeline Directory. BioPlan Associates: Rockville, MD, 2018; www.biosimilarspipeline.com.
Ronald A. Rader is senior director of technical research, and corresponding author Eric S. Langer is president and managing partner of BioPlan Associates, Inc., a biotechnology and life sciences marketing research and publishing firm in Rockville, MD; 1-301-921-5979; [email protected]; 1-301-921-5979. www.bioplanassociates.com.
You May Also Like


