30 Years of Upstream Productivity Improvements30 Years of Upstream Productivity Improvements
https://bioprocessintl.com/wp-content/uploads/2015/02/022015_Langer.mp3
We recently completed an analysis of the past 30 years of industry progress in commercial-scale expression titers and bioprocessing yields.  These basic measures of biopharmaceutical manufacturing efficiency also benchmark the technological progress made in bioprocessing over recent decades. Titer and yield improvements generally indicate related bioprocessing cost savings, something most commercial-scale manufacturers work to improve. This focus on efficiency and productivity has led to constant bioprocessing improvements even for long-approved and -marketed products. Our findings indicate that although upstream titers have improved significantly, the same can’t be said for downstream yields.
This extensive review and evaluation of historical and current titer and yield data represents perhaps the only such comprehensive analysis to date. We retrieved titer and yield data for nearly 40 biopharmaceuticals (all recombinant proteins) with a concentration on major — including blockbuster (>$1 billion/ year revenue) — monoclonal antibody (MAb) products. Data go back to 1985, when the first mammalian-expressed product was in late-stage development: Activase (tissue plasminogen activator; tPA) was approved by FDA in 1987. Our findings demonstrate results from technological advances in commercial- scale manufacture of mammalian- expressed recombinant (glyco)proteins and MAbs.
Data Retrieval and Development
The sources and methods we used to gather current and historical titer and yield data for selected biopharmaceuticals manufactured at commercial scale include literature review and product-specific bioprocessing and facility information retrieved from proprietary internal resources, including the BIOPHARMA database (1). We also used bibliographic databases (e.g., BIOSIS) to identify product-specific bioprocessing papers along with generic articles on titer and yield trends.
Now approaching its 12th year, the BioPlan Associates’ annual report and survey was the source for much current and recent industry historical data (2). Based on input from 238 respondents, the average titer reported in the 2013 industry study was 2.56 g/L. We also networked with bioprocessing professionals for current and historical product-specific titer and yield information, collecting some data from presentations and colloquia. Many bioprocessing professionals provided contributions to the titer and yield data. Among them were the >460 members of BioPlan Associates’ Biotechnology Industry Council (BIC) group, whose members provided input and feedback. An additional 125 bioprocessing professionals are involved in specific product scale-up and manufacture: e.g., authors, presenters, and those working in research and development (R&D).
We also developed “bioprocessing (re)design year” data representing the most recent year for presumed incremental updating of bioprocessing for established products. This generally involved identifying the most recent year when a new manufacturing facility was upgraded, a process came online, a new contract manufacturing organization (CMO) or facility undertook manufacturing, or a process change was reported that would have required filing for supplemental approvals. We considered such information for estimating current titers for which more authoritative data were missing.
Results
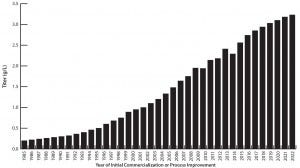
In the 1980s and early 1990s, average commercial-scale titers started at <0.2–0.5 g/L. That average has been increasing by ≤20% annually. In 2014, survey participants (n = 238) reported an average commercial-scale titer of 2.56 g/L and a clinical-scale titer of 3.21 g/L for new bioprocesses. The five-year average (to 2019) commercial-scale titer is projected to be >3.0 g/L, which essentially matches the current average clinical scale. Growth in titers should slow after that year, with the average commercial-products titer remaining <3.5 g/L at 10 years (until the year 2029).
Figure 1 shows the progress in average mammalian and MAb commercial-scale titers over time. It shows data from the BioPlan survey for 2008–2014 as well as the best estimates for average titers for earlier and later years.

Figure 1: Average commercial-scale titers, 1985–2023 (Source: Available data on production trends back to 1985 and forward to 2023, including BioPlan’s 11th Annual Report survey data for 2006–2014)
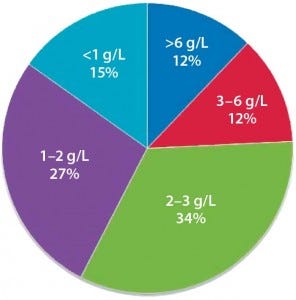
Figure 2 shows current titer distribution for specific currently marketed products (and a few near approval). Nearly all data are for mammalian-expressed MAbs, including most prime candidates for biosimilars development. Most data collected about titers and yields came from data reported in the literature or by bioprocessing professionals. Many data points were derived from secondary sources, with no product-specific data used.

Figure 2: Distribution of current titers for commercial biologics (g/L)
During the first introductions of recombinant therapeutics in the 1980s, mammalian expression titers were on the order of ≤0.5 g/L. Titers now average ∼2.5 g/L and are projected to increase to ∼3.25 g/L in five years. After a somewhat slow start extending into the early 1990s, titers rapidly increased at a rather steady rate of ∼20% annually through to the present. We project a slowing of growth in future titers (e.g., to <18% annually). Reasons for this projection include technological and quality limitations (e.g., high titers causing problems such as aggregation or changes in glycosylation) and an increasing number of older, legacy products on the market.
Titers have continued and will continue to increase. Drivers include a number of technological trends: improved expression systems, cell lines and genetic engineering; culture media and media optimization; better bioprocessing (e.g., equipment and automation); and use of process analytical technologies (PAT) and modeling software for process debottlenecking. Average titers reported here include older, legacy products/ processes, nearly all of which have been serially incrementally improved over the years, along with newer products/ processes coming online, with most of those generally >2.5–3.0 g/L.
BioPlan’s 11th annual report and survey shows that the current average titer is 2.56 g/L for commercial manufacturing and 3.21 g/L at clinical scale (2). So titers for new mammalian, (including MAb) bioprocesses being designed are now usually >3 g/L. With products taking years to go through clinical trials, commercial manufacturing titers (and yields) are generally always lower and lagging behind those attained with newer clinical supplies bioprocessing. So the five-year (2019) projected commercial manufacturing titers of >3 g/L are now comparable to those being attained at clinical scales. That is presumed to be the general rule, with titers attained with new bioprocesses becoming typical for commercial- scale manufacture years later.
Commercial-manufacturing titers vary greatly. Current data include several mostly older products manufactured at titers ≤1.1 g/L, whereas several newer products are manufactured at ≥6 g/L. Many products entering the market in coming years will have titers at or approaching 7 g/L. High titers (concentrations) often contribute to quality problems such as protein aggregation, so we don’t expect new products in coming years to be manufactured at titers much over 7 g/L. Most new products likely coming into commercialization will have titers in the 2.5–3.5 g/L range. Many current and future commercial-scale manufacturing facilities are simply not designed to handle product titers >3 g/L (e.g., protein A resin MAb purifications impose limits at large scales).
Downstream Yield Not Keeping Up
Downstream yields have seen continued improvements with time as well, but at a much slower rate than upstream titers. Advances in purification and other downstream operations have been fewer and less frequent than those for upstream processes. Industry sources have long reported that average or consensus yields attained with commercial- scale mammalian manufacturing are ∼70%-80%, often reported as 75%. However, our studies have indicated a lower current industry average commercial-scale yield.
In July 2014, BioPlan Associates conducted an online poll, receiving responses from 50 members of its Biotechnology Industry Council advisory group (which includes nearly 500 biopharma panel members developing analyses and responding to critical industry inquiries). That survey reported 69% as the average current commercial- scale yield for products approved between 2010 and 2014, with most responses (65–69%) and outliers involving non- MAb products. In this context, we adopt 70% as the industry mammalian commercial-scale manufacturing average yield. Data points were insufficient to enable making conclusions about yields in prior years. However, as with titers, yields only increase over time.
Yields have doubled at best (e.g., assuming 35% yield in the early years), whereas titers have increased tenfold during this same period. Yields are not projected to increase by much in coming years — at least until significant technological advances are adopted for commercial-scale manufacturing, with such trends not yet evident.
These and other BioPlan studies also have confirmed common knowledge that mammalian expression systems (mostly Chinese hamster ovary, CHO cells) dominate marketed biopharmaceutical manufacturing, with MAbs dominating those products. A smaller number of products are manufactured using microbial systems (mostly Escherichia coli), with just a few products manufactured using other systems (e.g., insect and plant cells and transgenic animals).
Survey Findings Summary
Our findings confirm the recognized advances in largest- scale recombinant protein/MAb bioprocessing in recent decades. Also, we define how marketed products generally have their bioprocessing incrementally upgraded over the years, including use of improved cell lines, vectors, culture media, equipment, and process modeling, which have all led to better understanding of bioprocesses. Such upgrades are generally batched to minimize costly submission of supplemental approval filings and are often associated with new facilities, transfer of manufacturing to a new CMO, and other major changes in regulatory terms, with incremental improvements in titer and/or yield.
Current titer and yield trends present major implications to the biopharmaceutical industry. Many legacy MAbs and other older products are being manufactured at higher titers (and to a lesser extent, higher yields) than in previous years. Already, with the trends for improved bioprocessing efficiency, much of the current in-place industry bioreactor capacity is underused. For example, using current titer data for some MAbs, we determined that some of the very largest manufacturing facilities — especially those handling legacy blockbuster MAbs — might be operating at only 10–20% capacity. They are running processes with bioreactors only partially or less frequently filled.
Although bioprocessing efficiency (and particularly, upstream titers) have increased with time — both for new bioprocesses and those for marketed products — the relatively modest 70% current industry overall average for downstream yield attained with commercial manufacturing is likely to continue creating bottlenecks. Similarly, innovators will have increased pressures for new and better purification methods.
References
1 Rader RA. BIOPHARMA: Biopharmaceutical Products in the U.S. and European Markets; online database, www.bioplanassociates.com/biopharma.
2 Langer ES, et al. 11th Annual Report and Survey of Biopharmaceutical Manufacturing Capacity and Production, BioPlan Associates, Inc.: Rockville, MD, April 2014; www.bioplanassociates.com.
Ronald A. Rader is senior research director, and Eric S. Langer is president and managing partner of BioPlan Associates; 1-301-921- 5979; [email protected].
You May Also Like


