Expression of a Fab Fragment in CHO and Pichia pastorisExpression of a Fab Fragment in CHO and Pichia pastoris
Mammalian cell expression systems are currently essential for production of glycosylated biopharmaceuticals such as monoclonal antibodies or molecules requiring even more complex glycan structures. Various host cell and vector systems aimed at improving expression levels and quality have been established (1, 2). Development of biopharmaceutical product candidates from genes to clinical trials should be based on technology platforms that will require no major changes in the entire development chain, including manufacturing once a product candidate has successfully progressed through phase 1–2 clinical testing. The intrinsic cost structure thus is widely determined by the category of technology platform chosen very early in development.
Development time is currently considered by modern management to be of utmost importance. Antibody fragments (Fabs) represent an interesting category of potential biopharmaceuticals (3, 4). About 20% of all Fabs have glycosylation sites that putatively might contribute to their biological in vivo performance (5). We investigated two different state-of-the-art technology platforms — the CHO mammalian system and the Pichia pastoris yeast system — to produce Fab fragments with identical primary sequence and compared the results. We analyzed the time needed for development of different technology platforms and intrinsic parameters such as specific and volumetric productivity as well as quality criteria based on preclinical and in vitro properties.
Figure 1:
POLYMUN SCIENTIFIC GMBH (WWW.POLYMUN.COM)
Materials and Methods
3H6 Fab Expression Vectors: A human/mouse Fab fragment, 3H6/Fab (6), was expressed in CHO cells by using a two plasmid strategy (7). We cloned the light-chain vL-cκ into the pIRESdhfr vector derived from pIRESneo from Clontech Laboratories, Inc. (www.clontech.com) by exchanging the neom ycinphosphotransferase with the dihydrofolate reductase (dhfr) at 3′ of the internal ribosomal entry site (IRES), resulting in the cotranscription of 3H6 light chain and dhfr under control of the human CMV promoter (8). The heavy chain was separately cloned into a eukaryotic expression vector under control of the SV40 early promoter. Expression of 3H6/Fab in P. pastoris was accomplished by the pPICZalphaA vector. Both chains were cloned at 3′ of the alpha mating factor leader sequence, and expression was controlled by the methanol-inducible AOX promoter (9).
Clone Selection, Screening, and Recombinant Production of Fab Fragments: We transfected protein-free–cultivated CHO cells (DUKX-B11, ATCC CRL-9096) with a nucleofector from Amaxa AG (www.amaxa.com) and started selection (hypoxanthine/ thymidine-deficient medium) 24 hours later in combination with limiting dilution to select predominantly single clones in 96-well plates (10). Transfection was done in four independent experiments, each with 4,000,000 cells plated at 1,000,000 cells per plate.
After three weeks, 75% of seeded wells showed a minimum of semiconfluent growth, and we screened the supernatants of such selected clones using ELISA for human Fab productivity. Those identified as best producers (less than 10% of screened wells) were further propagated in 50 nM methotrexate (MTX) and in the next passage adapted to 100 nM MTX for gene amplification. Following stabilization of clones, we subcloned the best clone by limiting dilution and implemented a second subcloning step with 400 nM MTX before adapting the best clones to 1.6 µM MTX. The best clone was then evaluated according to specific growth rate and productivity.
For expression in P. pastoris, we used the wild-type strain X33 as our host strain and transformed it with the linearized pPICZalphaA3H6Fab introduced into the cells by electroporation (11). We then used Zeocin (100 µg/mL) for selection of positively transformed clones and cultivated more than 20 different clones of two independent transformation events in 10 mL volumes for more detailed clone screening.
We then cultivated the best of the 3H6/Fab P. pastoris clones in a 1.8-L bioreactor to stress the yeast system and evaluate its potency (9). The production phase was induced by switching to methanol metabolism after a 29-hour batch phase, and cell density was measured by OD600 of 100 (12). That phase (methanol feeding) was maintained at a constant feed rate of 0.121 g/min of methanol medium for a total of 86.5 hours.
ELISA Quantification: We quantified 3H6/Fab fragments by double-sandwich ELISA (13). Briefly, polyclonal goat antihuman Fab-specific antiserum (gah-Fab) was precoated onto the immunosorbent plates. We used human Fab antibody fragments from Sigma (www.sigma-aldrich.com) as a standard protein in an eightfold serial dilution starting at 200 ng/mL. Then we allowed 50 µL per well of serially diluted standard or samples to bind to the precoated well for an hour before detection with horseradish-peroxidase–labeled gah-Fab.
Gel Analyses of Ab2/3H6: We combined discontinuous sodium-dodecyl sulfate polyacrylamide gel electrophoresis (SDS-PAGE) with subsequent Western-blot analysis on a polyvinylidene difluoride (PVDF) membrane from Millipore (www.millipore.com). Electrophoresis was carried out on 10% polyacrylamide slab gels under denaturing conditions in Laemmli SDS running buffer from Hoefer, Inc. (www. hoeferinc.com). Following electrophoresis, we visualized the proteins either by calconcarboxylic acid (NN)-silver staining (14) or transferred them to a PVDF membrane for Western-blot analysis. We used alkaline-phosphatase–coupled antihuman Fab conjugate for detection of the Fab in culture supernatant.
Results
Fab Expression in CHO cells: Following transfection of CHO host cells, selection with hypoxanthine and thymidine deficient medium takes two to three weeks before culture supernatants can be tested for human Fab secretion. By seeding 10,000 cells per well (and based on a calculated stable transfection efficacy of 0.01%), we expected each well to develop one stably transfected clone. In our experiment, 75% of the wells contained growing cells. Only 101 out of 1,536 seeded wells produced more than 50 ng human Fab per mL when analyzed in the first ELISA screening two to three weeks after transfection.
All those clones were then amplified to 50 nM MTX in a 48-well plate and adapted to 100 nM MTX in T25-flasks over two weeks. Again, we identified the best producing clones by weekly ELISA screening and tested specific productivity from continuously growing T25-flasks. The specific production rate of clone 3H6/Fab/11F9, one of the primary transfectants, was in the range of 1–5 pg/cell/day for 12 weeks after initial screening (Figure 1). We subcloned 3H6/Fab/11F9 in week seven after transfection.

Figure 1: ()
We performed limiting-dilution subcloning with 10 and 20 cells per well, resulting in 3.5% and 9.4% growing wells. Single clones were then verified by microscopic analysis of those wells, and we went forward with only those. So limiting-dilution cloning was performed at 100 nM and 400 nM MTX, and the final clone 3H6/Fab/11F9/4F9/6F6 was adapted to 1.6 µM MTX, with continuous screening of intermediate clones. Figure 1 illustrates the time schedule and stepwise increase of specific productivity during clone development of the different 3H6/Fab subclone generations. The final clone (3H6/Fab/11F9/4F9/6F6) has since been cryopreserved as a working cell bank. We have thawed and tested the subsequent stability of that clone over a period of 10 weeks.
Fab Expression in Pichia pastoris: We transformed 3H6/Fab expression vectors into P. pastoris wild-type strain X33 and selected positively transformed clones insured with Zeocin antibiotic from Invitrogen (www.invitrogen.com) at 100 µg/mL. After about three days, single colonies were picked and 3H6/Fab clones expressed at small scale after overnight preculturing of clones in BMGY medium (1% yeast extract, 2% peptone, and 100 mM potassium phosphate at pH 6.0 with 1.34% YNB, 4 × 10⁻⁵% biotin, 1% glycerol, and 100 µg/mL antibiotic) from Difco Laboratories. The next day, we inoculated the culture with BMMY (BMGY using 0.1% methanol instead of glycerol) to an optical density (OD600) of 0.1, then adjusted methanol concentration to 0.1% at intervals of 12 hours.
Generally the productivity of recombinant yeast is expressed as product secretion into culture supernatant per OD600 and hour. In our study, 24 clones from two different transformations were inoculated with 0.1 OD600 and harvested 56 hours later. Our evaluation of these clones was based on titer in the supernatant and the final number of yeast cells measured by OD600 (Figure 2). Cultivation time was kept constant for all experiments to prevent differences in specific productivity due to cells at unequal growth stages. Our titers were in the range of 1–5 µg Fab per mL, and OD600 readings ranged from five to 14, resulting in a specific productivity of 0.002–0.006 µg/OD each hour.
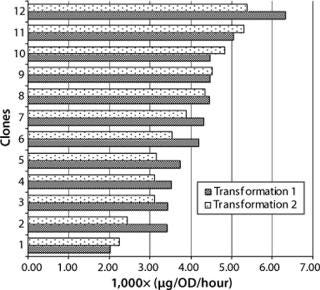
Figure 2: ()
Transformation did not influence the average range of productivity in these clones, and no significant differences were detected with factors of more than fivefold. Figure 2 shows the specific productivity of 12 randomly picked clones from two transformations sorted by increasing specific productivity. That seems rather low considering that production in the medium is roughly proportional to the concentration of cells in culture (15). Nevertheless, with an inoculum density at about 2,000,000 cells/mL at an OD600 of 0.1, and the time until harvest <3 days, those values are reasonable considering the advantage of this production system (its specific growth rate).
Fab Fermentation in P. pastoris: One clone was selected for fermentation in a 5-L bioreactor starting at an OD600 of 1.0 (1% yeast extract, 2% peptone, 2% glycerol). During this fermentation process, temperature was controlled at 25 °C, dissolved oxygen was set at 20%, and pH was controlled at 5.0 with 25% ammonium hydroxide. When cell density reached an OD600 of ∼100, we initiated expression with methanol. The accumulated recombinant Fab fragment was two orders of magnitudes higher than it had been in the shake flasks, and it was the first time such a high titer was reached for a specific monoclonal Fab fragment.
After 86 hours of methanol induction, the expression level of 3H6/ Fab reached 260 mg/L. Table 1 lists the titer, specific productivity based on the arithmetic average of cell counts, and specific growth rates at different time points. Yeast dry cell weight (DCW) had been used for estimating the number of cells and their specific growth rate. We recalculated yeast wet cell weight (WCW) based on the generally accepted assumption that dry mass represents 25% of wet mass.
Table 1: Fermentation characteristics describing product formation, qP, and µ calculated from one sampling time to the next; maximal cell densities were about 85 g DCW per L, and the qP average is 0.5851 mg/g of dry cell weight (DCW) per day.
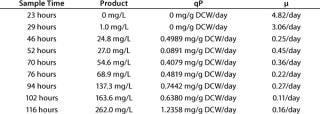
Table 1: Fe rmentation characteristics describing product formation, qP, and µ calculated from one sampling time to the next; maximal cell densities were about 85 g DCW per L, and the qP average is 0.5851 mg/g of dry cell weight (DCW) per day. ()
To demonstrate the specificity and integrity of our recombinant product, we applied SDS gels and Western-blot analyses to all samples collected. In Figure 3, the increase of 3H6/Fab in culture supernatant is indicated by applying 10 µL of supernatant to each slot. The lowest titers visible are 24.8 µg/mL 3H6/Fab at the silver stain as well as Western blot lane 46. No free heavy or light chains were detected in the culture supernatant, even at high secretion rates after >100 hours of fermentation.
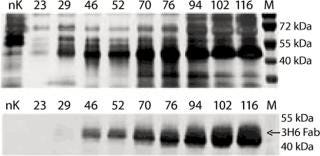
Figure 3: ()
The purity and quality of an expressed protein depends on many factors such as cell density and viability as well as media components that might becom
e product contaminants themselves or through cell metabolism. So we cultivated both expression systems in the exponential growth phase and with protein-free media. No significant differences in the amount of secreted product and protein-related contaminants could be detected (Figure 4).
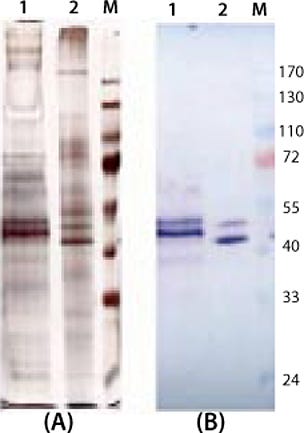
Figure 4:
Interestingly, despite the two products being transcribed from identical coding regions, they did not migrate with the same mobility in SDS gels. One explanation is the N-glycosylation site on the protein, which might not be deglycosylated completely even in the lower band (9). Another possible explanation might be based on the fact that the yeast system does not terminate translation at the first stop codon and cotranslates the His-tag that is fused in the pPICZalphaA vector. With the higher band, it seems reasonable that the yeast expression system generates high-mannose carbohydrate chains that increase the molecular weight of the whole protein.
Discussion
For a basic comparison, we’ve expressed a mouse/human chimeric Fab fragment using two different eukaryotic state-of-the-art expression systems: P. pastoris and CHO cells. For clarity, we compare the routine achievements for both systems. Further optimizations of specific productivities are undoubtedly possible. The expression systems have different advantages and disadvantages concerning time schedule for the establishment of expression clones, quality and purity of expressed product, fermentation properties, and costs (16).
Time to Establish Expression Clones: Cloning distinct expression vectors is similar in both cases, and genetic transformation requires comparable amounts of DNA and host cells. A significant advantage of the P. pastoris system is the time needed for clone development. Particularly, the DHFR-deficient CHO cells represent a major time bottleneck by comparison. Isolation and selection of a recombinant Pichia clone transformed by homologous integration of the exogene is completed after three days, whereas the first round of picking CHO clones alone takes over two weeks, followed by two further rounds of amplification and selection.
From the first P. pastoris clones a convenient number is used for screening, mostly in a shake flask under reproducible conditions. Using this strategy allows easy identification of the best producer out of a hundred or more clones in a short time through basic efforts such as ELISA testing and OD600 measurement.
Eukaryotic transcription is regulated in two stages: Localized changes in chromatin structure cause selected regions of the chromatin to decondense, and the uncoiled chromatin loops out. DNA is then accessible for binding of transcription factors, so RNA polymerase and transcription follows. In CHO cells and other higher eukaryotic cells, development of a recombinant stable clone is complicated because the commonly used method for transgene uptake is heterologous integration combined with gene amplification to increase copy number, transcription rate, and product formation. Adding to that a significantly lower growth rate than for yeast cells leads to a time consuming clone-selection process. It takes about 20 days to grow a single CHO clone in a 96-well plate for ELISA screening.
Furthermore, screening of the best clone in a subcloning round must be combined with adaptation to MTX for gene amplification, which requires another three to four passages at two per week. At the end of this clone development — realistically after five to seven months — a recombinant clone must be generated that is ready for deposition as a cell bank or for production culture in a bioreactor. So clone development clearly favors the Pichia system’s time lines of just two weeks (rather than six months for CHO).
Product Quality: Concerning product quality, the focus is generally on posttranslational modifications — and not only glycosylation. Generation of disulfide bonds and protein maturation by proteolytical cleavage in complex proteins with heteropolymeric structures are not optimal in yeast systems yet (17). However, single-chain proteins are often expressed in yeast with great success, though not objectively when compared with CHO system results (18,19,20).
We so far have had the opportunity to compare binding specificities and affinities of our Fab fragment expressed in both systems. Overall, the quality of these molecules is identical when measured by these parameters (7). For the moment, unfortunately, we are unable to predict deviations during in vivo application as a therapeutic immunogenic antigen administered to human volunteers. So this latter question remains unanswered.
Cell Density: Mammalian cells do not have cell walls and are sensitive to the osmolarity of their environment. Consequently, achieving high CHO cell densities in a bioreactor can be extremely tedious (21, 22). Balanced growth media and perfused systems with cell retention are used to overcome these limitations (23).
The typical maximum cell density of P. pastoris in high-density fed-batch cultures is 50–100 g dry cell weight per liter of culture broth with our feeding and overall process control strategy. There is a wide range of available environmental parameters for a Pichia recombinant expression system used to promote specific productivities and/or cell densities.
In terms of overall bioprocessing technology, high cell densities in upstream processing are favorable. However, such cell densities in culture broth — if we consider real large-scale technology — can create severe overall problems for downstream processing. Consider our comparison of “cell densities” on the basis of wet biomass (metabolic active biomass) in Table 2. The volume of a single CHO cell is fifty times higher than that of a P. pastoris cell. That is compensated, however, by a 6,000-fold higher cell count in a fed-batch process, meaning that the accumulated biomass is still ∼100 times higher in the P. pastoris system.
Table 2: Overview of key data comparing cell volume (wet biomass) calculated from an average diameter of 15 µm for CHO cells and 4 µm for P. pastoris (cell counts calculated from weight cell weight, WCW = 100g DCW × 4) divided by the volume of a single cell)

Table 2: Ov erview of key data comparing cell volume (wet biomass) calculated from an average diameter of 15 µm for CHO cells and 4 µm for P. pastoris (cell counts calculated from weight cell weight, WCW = 100g DCW × 4) divided by
the volume of a single cell) ()
Productivities: The CHO cell system constitutively and permanently expresses recombinant proteins independent from its growth phase; whereas Pichia requires induction such as by methanol, which has a significant effect on its growth rate. The specific growth rate of methanol-induced yeast is comparable with that of CHO cells.
To compare the specific expression potential of these systems, we estimated the average specific productivity shown in Table 1 for P. pastoris from the point of induction to the end of fermentation. Table 3 details specific productivities (qP) based on one cell, wet biomass in mL, and volumetric productivities (Qp) based on one liter of cell broth related to the data from Table 2. Standard cultivation conditions are assumed: fed batch and continuous (chemostatic) culture for the Pichia system and continuous or continuously (chemostatic) perfused culture with cell retention for the CHO system. According to our manufacturing experience, we conclude that this represents a realistic approach for comparing the systems.
Table 3: Specific (qP) and volumetric (Qp) production rate for CHO and Pichia
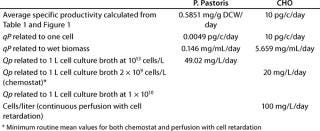
Table 3: Sp ecific (qP) and volumetric (Qp) production rate for CHO and Pichia ()
Specific Productivity (qP): It is not admissible to compare the qP of these systems based on a single cell, which is commonly applied to characterize recombinant mammalian cell systems alone. Metabolic active wet biomass volume represents a realistic and valid base for comparing respective qPs. In our concrete comparative case study, the quotient between the qP of CHO cells and P. pastoris is ∼2,000 (10/0.0049), and considering the 50-fold cell volume for CHO cells, the CHO system is ∼40× more efficient in expressing and secreting the Fab fragment into its culture supernatant.
We are fully aware of the potential to optimize each system to improve their respective specific expression rates. We’ve established recombinant CHO clones producing different complex proteins showing 3×-4× higher qPs than the concrete case considered here. The qPs of recombinant Pichia can be improved by similar orders of magnitude. In both systems, even minor differences in target gene sequences and/or expression vector design can lead to different fidelities of recombinant protein expression.
However our comparative case study clearly indicates that expression and particularly the secretion machinery of the mammalian eukaryotic cell is obviously more potent within the controlled environment of a bioreactor. The different check points of controlling expression and secretion in higher or lower eukaryotes are widely unknown. It should therefore be extremely useful to deepen this comparative study with a systems biology approach of investigation using transcriptomics, proteomics, and metabolomics. Eventually we could learn how to engineer the Pichia system using our findings from the CHO system.
Volumetric Productivities (Qp): Qp (product ÷ volume × time) is one sensitive parameter for efficiency of technology. With Pichia, high cell biomass of 300–400 mL/L can be accumulated in a relatively short time because of high growth rates before induction.
It is a comparably tedious undertaking to reach high biomass with the mammalian system because of low growth rates and limits in growth media design due to cellular osmotic pressure sensitivity. By designing continuous culture processes (e.g., chemostatic manufacturing mode or more effectively continuous perfusion with cell retention), those clear disadvantages can be compensated in part. Cell numbers of ∼1-2 × 10¹⁰ cells/L (representing 18–36 mL of wet biomass) are usually accumulated with perfused cell retention modes.
Consequently, the Qp of the CHO system would be roughly two times higher than that for the Pichia system in our concrete case of Fab fragment production (Table 3). Another bonus in favor of the CHO system comes from more efficient product recovery in downstream processing.
Costs of Culture Media: Another point to consider here is costs of media resulting from special supplements. Both systems are cultivated in protein-free media that are also free of animal-derived ingredients. In mammalian cell clone development, use of protein free systems is state of the art (24). Commercially available media are often very expensive, and continuous perfused cultures are even more sensitive to media costs than are fed-batch cultures. The costs of the growth medium we used for the CHO system (including all additives, routinely used for GMP-production of clinical grade proteins) is about one Euro per liter. The costs of media for the P. pastoris system are only slightly lower and on a similar order of magnitude.
A Complex Comparison
In our comparative case study, antibody Fab fragments were cloned and expressed using P. pastoris and CHO cells. Fab fragments expressed by the Pichia system showed nearly identical binding affinities and in vitro inhibition properties as those expressed by CHO cells (7). However, although the two products were expressed from identical coding regions, they did not migrate with the same mobility in SDS-PAGE.
Some questions that were not investigated in detail still remain open and might or might not be significant to human in vivo application. We hypothesized that for glycosylated Fabs the mammalian expression system is closer to human nature than is Pichia. With respect to speed of development — from genes to clinical-grade products — use of the Pichia platform is significantly faster. And overall, technology cost structures are comparable once an established Fab-drug is reaching a state of commercialization.
REFERENCES
1.) Andersen, DC, and L. Krummen. 2002. Recombinant Protein Expression for Therapeutic Applications. Curr. Opin. Biotechnol. 13:117-123.
2.) Sethuraman, N, and TA. Stadheim. 2006. Challenges in Therapeutic Glycoprotein Production. Curr. Opin. Biotechnol. 17:341-346.
3.) Andersen, AD, and DE. Reilly. 2004. Production Technologies for Monoclonal Antibodies and Their Fragments. Curr. Opin. Biotechnol. 15:456-462.
4.) Birch, JR, and AJ. Racher. 2006. Antibody Production. Adv. Drug Del. Rev. 58:671-685.
5.) Filpula, D. 2007. Antibody Engineering and Modification Technologies. Biomol. Eng. 24:201-215.
6.) Kunert, R. 2002. Anti-Idiotypic Antibody Ab2/3H6 Mimics the Epitope of the Neutralizing Anti-HIV-1 Monoclonal Antibody 2F5. AIDS 16:667-668.
7.) Gach, JS. 2007. Partial Humanisation of an Antiidiotypic Antibody Against Monoclonal Antibody 2F5, A potential HIV-1 Vaccine?. AIDS Res. Hum. Retrov. 23:1405-1415.
8.) Kunert, R. 2004. Control of Key Parameters in Developing Mammalian Production Clones. BioProcess Int. 2:5
4-59.
9.) Gach, JS. 2007. High-Level Expression of a Promising Anti-Idiotypic Antibody Fragment Vaccine Against HIV-1 in Pichia pastoris. J. Biotechnol. 128:735-746.
10.) Lattenmayer, C. 2007. Protein-Free Transfection of CHO Host Cells with an IgGFusion Protein: Selection and Characterisation of Stable High Producers and Comparison to Conventionally Transfected Clones. Biotechnol. Bioeng. 96:1118-1126.
11.) Gasser, B. 2006. Engineering of Pichia pastoris for Improved Production of Antibody Fragments. Biotechnol. Bioeng. 94:353-361.
12.) Cos, O. 2006. Operational Strategies, Monitoring, and Control of Heterologous Protein Production in the Methylotrophic Yeast Pichia pastoris Under Different Promoters: A Review. Microb. Cell Fact. 5:17.
13.) Kunert, R. 2000. Stable Recombinant Expression of the Anti HIV-1 Monoclonal Antibody 2F5 After IgG3/IgG1 Subclass Switch in CHO Cells. Biotechnol. Bioeng. 67:97-103.
14.) Jin, LT. 2004. Sensitive Silver Staining of Protein in Sodiumdodecyl Sulfate-Polyacrylamide Gels Using an Azo Dye, Calconcarboxylic Acid, As a Silver-Ion Sensitizer. Electrophoresis 25:2494-2500.
15.) Cereghino, JL, and JM. Cregg. 2000. Heterologous Protein Expression in the Methylotrophic Yeast Pichia pastoris. FEMS Microbiol. Rev. 24:45-66.
16.) Fussenegger, M, and HJ. Hauser. 2007. Protein Expression By Engineering of Yeast, Plant, and Animal Cells. Curr. Opin. Biotechnol. 18:385-386.
17.) Hamilton, SR. 2006. Humanization of Yeast to Produce Complex Terminally Sialylated Glycoproteins. Science 313:1441-1443.
18.) Li, H. 2006. Optimization of Humanized IgGs in Glycoengineered Pichia pastoris. Nat. Biotechnol. 24:210-215.
19.) Shukla, AK. 2007. Heterologous Expression and Comparative Characterization of the Human Neuromedin U Subtype II Receptor Using the Methylotrophic Yeast Pichia pastoris and Mammalian Cells. Int. J. Biochem. Cell Biol. 39:931-942.
20.) Müller, D, and K Bayer. 2006. Mattanovich D. Potentials and Limitations of Prokaryotic and Eukaryotic Expression Systems for Recombinant Protein Production: A Comparative View. Microb. Cell Fact. 5:P61.
21.) Link, T. 2004. Bioprocess Development for the Production of a Recombinant MUC1 Fusion Protein Expressed By CHO-K1 Cells in Protein-Free Medium. J. Biotechnol. 110:51-62.
22.) Reiter, M, and G. Blüml. 1994. Large-Scale Mammalian Cell Culture. Curr. Opin. Biotechnol. 5:175-179.
23.) Yin, J. 2007. Select What You Need: A Comparative Evaluation of the Advantages and Limitations of Frequently Used Expression Systems for Foreign Genes. J. Biotechnol. 127:335-347.
24.) Reisinger, H. 2007. Serum-Free Transfection of CHO-Cells with Tailor-Made Unilamellar Vesicles. Cytotechnol. 54:157-168.
You May Also Like


