Modeling Bioprocess CostModeling Bioprocess Cost
At every stage of biopharmaceutical development, efficient and cost-effective protein production is critically important to maintaining the economic viability of both a product and the company developing it. Biopharmaceuticals have significantly evolved through recent protein engineering advances, resulting in highly complex, novel proteins dominating the development pipeline. Such proteins are by definition very difficult to express in a soluble and active form. The success of these products depends on accessing a platform that rapidly produces high-quality, properly folded, active protein while ensuring seamless scale-up to maintain economic viability of each product throughout development and commercialization.
The three primary sources of value that can be derived from a robust expression are
opportunity-cost avoidance (specifically associated with the long labor-and cost-intensive process of identifying a production strain)
minimization of quality risk (preventing heterogeneous and/or hyperglycosylation, or proteolysis)
reduction of overall cost of goods (CoG) through achieving high titers of soluble active protein and efficiently purifying the expressed product.
The Pf&ebar;nex Expression Technology system uniquely addresses all three of these areas. However, here we focus on only one aspect of the value proposition: large-scale process economics.
PRODUCT FOCUS: AGLYCOSYLATED PROTEINS
PROCESS FOCUS: PRODUCTION
WHO SHOULD READ: PROCESS DEVELOPMENT, ANALYTICAL, OPERATIONS, AND MANUFACTURING
KEYWORDS: PROCESS ECONOMICS, COST OF GOODS (CoG), COST MODELING, EXPRESSION SYSTEMS, PROCESS YIELD
LEVEL: INTERMEDIATE
Mammalian expression systems are commonly used for producing glycosylated proteins such as full-length antibodies (1,2). But microbial systems offer several advantages for producing aglycosylated proteins such as antibody fragments (e.g., Fabs, scFvs), cytokines, chimeric, engineered proteins, and many vaccine antigens. Mammalian cell culture processes involve extended fermentation cycle times (typically 10–14 days) and require complex, expensive media (3,4). Microbial fermentations, by contrast, have short cycle times (two to three days) and use simpler, lower-cost media. Current microbial expression options include Escherichia coli, yeasts (Saccharomyces cerevisiae, Pichia pastoris) and Pseudomonas fluorescens, on which the Pf&ebar;nex system is based (5,6,7,8).
Early work on aglycosylated protein production relied on expression in E. coli. As a microbial host, it requires simple media for rapid growth in short fermentations, generally less than two days. However, in most cases, the recombinant proteins are produced in the form of insoluble inclusion bodies. Several additional processing steps are required for products expressed as such: inclusion-body harvesting, washing, solubilization, and refolding. Those steps add process time in the production suite.
Refolding typically needs to be conducted at low protein concentrations (~0.1 g/L or less) to minimize production of misfolded proteins and aggregates. That necessitates the use of large process vessels, consumes large quantities of expensive buffers, and creates significant waste streams. Refold step yields are usually low (20–40%). Such steps can also produce misfolded variants that need to be cleared in subsequent process steps. Large process volumes (accompanied in many instances by long refold times) can create production bottlenecks and limit capacity use.

Yeasts such as P. pastoris and S. cerevisiae are also used for producing aglycosylated proteins. Fermentation cycle times are typically longer than for E.coli and shorter than for mammalian cell culture. Media tend to be of intermediate complexity. Methanol is commonly used during induction, necessitating some additional materials handling requirements because of its flammable nature. As lower eukaryotes, yeasts have intracellular glycosylation machinery, but their pattern of glycosylation differs significantly from natural human proteins. In many cases, expression in yeast results in undesirable, unnatural, or hyperglycosylation.
Expression technology from Pf&ebar;nex Inc. is a microbial expression system based on the Gram-negative organism Pseudomonas fluorescens. It was specifically developed to overcome shortcomings experienced with other expression systems. The technology comprises
an extensive toolbox of genetic elements that can be rapidly combined to create 1,000 or more unique expression strains
a high-throughput, robotic screening approach enabling rapid identification of a subset of strains based on expression yield and protein function/activity
scaled-down fermentation evaluation under a number of expression conditions in miniaturized, scalable bioreactors to select a final production strain.
Specific advantages include rapid production strain identification (about eight weeks); short fermentation cycle times (less than two days); a simple, inexpensive, defined mineral-salts-based fermentation medium; and high levels of soluble, active protein (≤25 g/L in some cases). Over the past five years, the Pf&ebar;nex system has expressed soluble, active protein in >85% of cases in which other expression systems were unsuccessful (based on Pfenex internal data compared with client information). The company has also developed a toolbox of periplasmic release methods that selectively permeabilize cell walls while keeping inner cell membranes intact to allow release of periplasmically expressed proteins and minimize host-cell contaminants, resulting in extracts of higher purity — and consequently an improved downstream process.
Here we evaluate production costs of a typical aglycosylated protein expressed using Pf&ebar;nex technology compared with other expression systems. The other expression systems examined are E. coli, P. pastoris, and mammalian cell culture using Chinese hamster ovary (CHO) cells. Recombinant protein expression in E. coli was assumed to be in the form of insoluble inclusion bodies, whereas Pf&ebar;nex protein expression was assumed to be periplasmic and soluble. Other systems were assumed to express and secrete soluble protein extracellularly. The P. fluorescens process was based on procedures developed by Pfenex Inc. The other processes are assumed to have the same purification sequence as the Pf&ebar;nex system; however, their upstream and harvest steps are generic process sequences derived from commercially relevant operations commonly practiced in the industry. We used a Microsoft Excel–based process-cost modeling tool called BioSolve from BioPharm Services Ltd. for estimating production cost.
CoG Model Simulations
Fast and efficient evaluation techniques are required for rapid assessment of manufacturing approaches and their relevant operating c
osts. Computer-aided design (CAD) tools can help you achieve such objectives. Software tools are becoming increasingly critical to aid in better decision-making for manufacturing. The advantages of CAD tools for development and economic evaluation of bioprocesses have long been recognized in the biotechnology industry (9,10).
Application of process-cost modeling allows rapid comparison of manufacturing alternatives as well as development options and enables pharmaceutical companies to estimate the value of their technologies. An approach for predicting CoG has been discussed (11). The prediction tool needs to account for direct production costs and indirect facility overheads. In addition, it is important to capture cost items associated with ancillary activities such as cleaning operations. We used the BioSolve commercial software package to assess and quantify the economic advantages of manufacturing an aglycosylated protein produced using Pf&ebar;nex technology relative to the other three technologies.
Modeling Methodology
BioSolve process-cost model software provides rapid analysis of the impact of process and technology choices on manufacturing costs and facility operations. It is an Excel-based tool implemented modularly for ease of use and flexible configuration. Modularity gives users a bird’s-eye view of a facility’s infrastructure: e.g., process data, bill of materials, and cost outputs (Figure 1). This spreadsheet-based platform is especially easy for users who are already familiar with Excel.
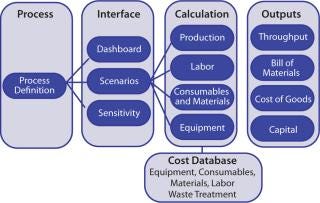
Figure 1: ()
Process: The cost model is driven by a process definition (including upstream, recovery and purification operations) at its core. A sequence of unit operations with key process parameters (e.g., yields, binding capacities, flux rates) is defined in the model. It also captures a detailed breakdown of unit operations into substeps with solution type/quantity, operating time, and personnel requirements.
Interface: BioSolve software offers a high-level degree of model transparency, quick customization of solutions, and ease of use, benefits that come from its spreadsheet-based modular and extensible framework. Key input parameters (e.g., process scale, disposable options, operating strategy, and costs) are centralized in a few worksheets, which allows users to access, maintain, and update relevant data. Such an interface enables review of all changes in the underlying data. The tool enabled us to model four different expression processes in the same workbook, which facilitated our CoG evaluations. Two analysis tools — called “Scenario” and “Sensitivity” — enabled us to investigate the impact of varying key input parameters on operating costs.
Calculations: The model computes facility throughput, materials, and consumables use; labor requirements; cleaning requirements; waste management; and plant equipment. Operatingl costs account for both indirect/fixed costs (e.g., capital charges, insurance, and taxes) and direct/variable costs (e.g., consumables, materials, and labor). Similar calculation approaches have been used to assess the economic feasibility of disposable chromatography for use in biomanufacturing (12,13). The model includes a cost database to maintain information covering the pricing of raw materials, equipment, consumables, labor, QC tests, and so on.
Outputs: Key output parameters include plant productivity, capital investment, and a bill of materials, all of which contribute to the overall CoG calculation.
Assumptions
Our BioSolve model compared production of a generic aglycosylated protein in four expression systems: Pf&ebar;nex P. fluorescens (soluble periplasmic), E. coli (in inclusion bodies), P. pastoris (secreted), and CHO (secreted). The base case study assumes a single 2,000-L bioreactor with a product titer of 3 g/L in all four expression options.
P. fluorescens fermentation and harvest information was provided by Pfenex Inc. We used the downstream steps provided for the Pf&ebar;nex technology with all four expression systems. Data used for the fermentation and harvest steps in the other three expression systems are based on typical production systems. Figure 2 depicts the process sequences for production of a target protein expressed using the four systems. The E. coli sequence is longer because insoluble inclusion bodies necessitate additional protein recovery steps.
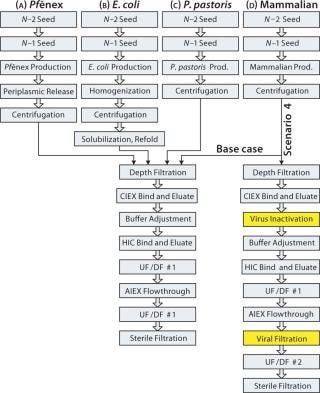
Figure 2: ()
The Pf&ebar;nex production step is a high-cell-density fed-batch fermentation, commonly used for commercial-scale production with microbial systems. Both seed steps included in the model are assumed to be batch fermentations. A glycerol feed is used during induction, triggered by isopropyl thiogalactoside (IPTG) addition. The harvest procedure is periplasmic release followed by centrifugation and depth filtration. During buffer adjustment before the hydrophobic-interaction chromatography (HIC) bind and elute step, the product stream’s salt concentration is increased to a final concentration of 0.6 M using a stock sodium sulfate solution. All other steps are industry standard unit operations for producing aglycosylated proteins using routine solutions and cycle times. The overall process yield is 43%.
E. coli production is in fed-batch mode, with two batch-mode seed fermentation steps. The medium used for those two steps is based on a typical glucose-based mineral salt medium commonly used for E. coli fermentation. The production medium has the same base format with a higher concentration of additives. Target protein production is induced with 0.1 mM IPTG. Harvest steps include homogenization, centrifugation, solubilization, and refolding followed by depth filtration. The solubilization and refold steps have a low combined yield, expected to be 15–40%. For the base case, we assumed a refold yield of 20%, with further downstream assumed to be the same as for the Pf&ebar;nex process. The overall process yield for this base-case E. coli process is 9%.
P. pastoris production is a fed-batch fermentation with glycerol and methanol feeds. Both seed steps are assumed to be batch fermentations. The fermentation sequence and media types used came from Life Technologies (Invitrogen, www.lifetechnologies.com) literature. The seed medium is a buffered minimum glycerol medium (BMGY) s
olution, and the main production medium is a fermentation basal salts medium with PTM1 trace salts. The feeds are a 50 w/v% glycerol solution and a 100 w/v% methanol solution, with additives. Additional safety equipment is assumed to be required because of the methanol feed, so our model assumes a 10% extra capital cost for each P. pastoris bioreactor. Centrifugation and depth filtration are used for harvest, and further downstream steps are assumed to be the same as for the Pf&ebar;nex process. The overall process yield is 51% for P. pastoris.
The mammalian process begins with a fed-batch cell culture, with seed bioreactors operated in batch mode. Both the growth and production media are Dulbecco modified Eagle’s medium (DMEM) with additives. The feeds are glucose and glutamine solutions. The harvest steps are centrifugation and depth filtration, and further downstream steps are the same for all processes. The overall mammalian process yield is 51%. Viral removal steps were intentionally left out of this base-case process sequence to provide a fair comparison of upstream and recovery steps among the four expression systems.
Simulation Results
Scenario 1, Base Case — Comparing Expression Systems at the Same Bioreactor Size and Titer: In evaluating CoG for all four expression systems using the same bioreactor size and product titer, the model results indicate that at a 2,000-L scale and 3 g/L, the Pf&ebar;nex system (Scenario 1a) is most cost-effective, with a CoG per gram of US$129/g (Figure 3). The P. pastoris system (Scenario 1c) is slightly more expensive at $148/g, whereas the mammalian (Scenario 1d) is much more expensive at $206/g. The E. coli system (Scenario 1b) at this scale and titer has a very high CoG of $588/g.
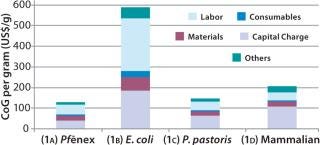
Figure 3: ()
CoG per gram is inversely proportional to annual product mass, with the Pf&ebar;nex system producing the most product per year (252 kg) and E. coli producing the least (53 kg/year). We expected such a correlation because increased throughput of product provides lower costs per gram produced. Pf&ebar;nex technology saved about 13% and 37% in costs compared with the P. pastoris and CHO systems, respectively. Although mammalian cell culture is commonly used for producing glycosylated proteins, its cost for aglycosylated proteins is significantly higher primarily because of longer bioreactor cycle times. The highest savings for the Pf&ebar;nex system is over E. coli, with the Pf&ebar;nex CoG being 78% lower.
Scenario 2 — Changing the Titer for the P. pastoris Expression System: When we examined the impact of reducing the product titer for the P. pastoris option from 3 g/L (base-case Scenario 1c) to 1 g/L while keeping the bioreactor size at 2,000 L. This lower figure is more representative of current industrial processes for production of aglycosylated proteins (14,15). As expected, lowering the titer increases CoG because the annual throughput is substantially reduced (Figure 4). CoG increases from $148/g in base-case Scenario 1c to $408/g (Scenario 2), and the percentage breakdown remains very similar. The capital spend is higher for the 3-g/L case ($50 million) than for the 1-g/L case ($46 million), which we expected given that higher titers require larger downstream equipment capacity. With the P. pastoris titer reduced, the Pf&ebar;nex option (Scenario 1a) seems more attractive because the base-case cost savings increases from 13% to 68%.
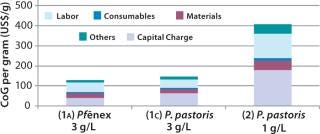
Figure 4: ()
Scenario 3 — Changing the Refold Yield for the E. coli Expression System: To investigate the effect of varying the refold yield in the E. coli expression system, we kept the bioreactor scale and titer constant as in the base case. In the E. coli base case (Scenario 1B), we used a refold yield of 20%. For this scenario we analyzed 15%, 30%, and 40% refold yields.
The refold yield has a large effect on CoG per gram (Figure 5). As expected, higher yields result in a lower CoG/g and a higher annual throughput. For example, at the 15% refold yield (Scenario 3A), the CoG is $774/g, whereas at a 40% refold yield (Scenario 3C) it’s ~$300/g. Those refold yields resulted in 7% and 17% overall yields, respectively. The capital charge did not vary significantly across the scenarios (from $46 million to $48 million), with the slight difference due to the scale of the downstream equipment required. However, capital charges per gram vary significantly ($96/g to $244/g) because annual throughput is related directly to yield.
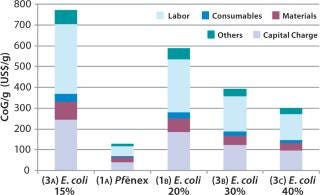
Figure 5: ()
Our analysis reveals that with 15–40% refold yields, the E. coli CoG remains higher (by at least twofold) than the Pf&ebar;nex CoG.
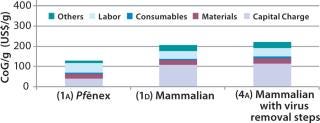
Scenario 4 — Adding Viral Removal for the Mammalian Expression System: To evaluate the cost impact of adding viral removal steps to a mammalian–based processing sequence, we added a virus inactivation step after the cation-exchange (CIEX) bind and elute step and inserted a viral filtration unit operation before the final ultra-/diafiltration (UF/DF) stage. The overall process yield decreased from 51% in the base case to 49%. As Figure 6 shows, adding viral steps to the mammalian-based process increased the base-case CoG ($206/g) by 8% to $222/g (Scenario 4A). That rendered the Pf&ebar;nex process more cost effective. We calculated its CoG to be 58% of the mammalian CoG.
 ign=”left” style=”background-color:#f7f7f7;margin-bottom:5px; margin-right:5px; margin-left:5px;margin-top:5px;cursor:pointer;” >

Figure 6: ()
Relating Productivity to Cost of Goods
We used a computer–aided approach to evaluate the process economics for commercial production of a standard, aglycosylated protein using different expression systems. Our simulation results revealed that in the base case of a 2,000-L bioreactor and 3-g/L expression, the Pf&ebar;nex Expression Technology system based on P. fluorescens is the most cost-effective option. In a base case, the Pf&ebar;nex CoG was calculated to be 22%, 87%, and 63% of the E. coli, P. pastoris, and CHO CoGs respectively. Mammalian process costs are higher mainly because of longer bioreactor cycle times and also because of additional viral inactivation steps. For the E. coli process, CoG is higher due to the need for solubilization and refold steps. If P. pastoris titer is reduced from 3 g/L to 1 g/L (which is more typical of current industrial processes), cost savings with the Pf&ebar;nex system increase to 68%. With an increased refold yield for the E. coli process, its CoG decreases. We used a typical refold yield of 20% as the base case and examined a range of 15–40%. At all refold yields, the E. coli CoG remains higher than the Pf&ebar;nex CoG. Financial benefits gained from the Pf&ebar;nex process can be attributed to higher facility productivity, which translates to lower overall operating costs.
About the Author
Author Details
Janice Lim is a bioprocess consultant ([email protected]), Gráinne McDonagh is a bioprocess engineer ([email protected]), and first corresponding author Andrew Sinclair is managing director ([email protected]) of Biopharm Services Ltd., Lancer House, East Street, Chesham HP5 1DG, United Kingdom, 44-1494-793243; www.biopharmservices.com. Second corresponding author Anant Patkar is director of downstream processing ([email protected]), and Patrick Lucy is vice president of business development ([email protected]) at Pfenex Inc., 5501 Oberlin Drive, San Diego, CA 92121, USA, 1-858-352-4317, www.pfenex.com. Pf&ebar;nex Expression Technology is a trademark of Pfenex Inc.
REFERENCES
1.) Chadd, HE, and SM. Chamow. 2001. Therapeutic Antibody Expression Technology. Curr. Opin. Biotechnol. 12:188-194.
2.) Kelly, BD. 2001. Biochemical Engineering Bioprocessing of Therapeutic Proteins. Curr. Opin. Biotechnol. 12:173-174.
3.) Wurm, FM. Knablein, J 2005.Manufacture of Recombinant Biopharmaceutical Proteins By Cultivated Mammalian Cells in BioreactorsModern Biopharmaceuticals, Wiley-VCH, Weinheim:723-759.
4.) Hacker, DL, M de Jesus, and FM. Wurm. 2009. 25 Years of Recombinant Proteins from Reactor-Grown Cells: Where Do We Go from Here?. Biotechnol. Adv. 27:1023-1027.
5.) Demain, AL, and P. Vaishnav. 2009. Production of Recombinant Proteins By Microbes and Higher Organisms. Biotechnol. Adv. 27:297-306.
6.) Choi, JH, KCC Keum, and SY. Lee. 2006. Production of Recombinant Proteins By High Cell Density Culture of Escherichia coli. Chem. Eng. Sci. 61:876-885.
7.) Squires, CH, and P. Lucy. 2008. Vendor Voice: A New Paradigm for Bacterial Strain Engineering. BioProcess Int. 6:S22-S27.
8.) Chew, LC Gellissen, G. 2005.Pseudomonas fluorescens (Chapter Three)Production of Recombinant Proteins: Novel Microbial and Eucaryotic Expression Systems, Wiley, Hoboken:45-66.
9.) Evans, LB, and RP. Field. 1989. Bioprocess Simulation: A New Tool for Process Development. Chem. Eng. Australia 14.
10.) Petrides, DP. 1994. Biopro Designer: An Advanced Computing Environment for Modeling and Design of Integrated Biochemical Processes. Computers Chem. Eng. 18:S621-S625.
11.) Farid, S. 2007. Process Economics of Industrial Monoclonal Antibody Manufacture. J. Chromatog. B B848:8-18.
12.) Mora, J. 2006. Disposable Membrane Chromatography: Performance Analysis and Economic Cost Model. BioProcess Int. 4:S38-S43.
13.) Lim, JAC. 2007. Economic Benefits of Single-Use Membrane Chromatography in Polishing: A Cost of Goods Model. BioProcess Int. 5:48-56.
14.) Kunert, R, J Gash, and H. Katinger. 2008. Expression of a Fab Fragment in CHO and Pichia pastoris. BioProcess Int. 6:S34-S40.
15.) Julien, C. 2006. Production of Humanlike Recombinant Proteins in Pichia pastoris: From Expression Vector to Fermentation Strategy. BioProcess Int 4:22-31.
You May Also Like


