Near-Infrared Spectroscopy for Rapid, Simultaneous MonitoringNear-Infrared Spectroscopy for Rapid, Simultaneous Monitoring
March 1, 2008
The use of cellular physiology to make target molecules has been practiced for centuries, with early examples being the production of wine and beer through yeast fermentation. Single (e.g., bacteria and yeast) and multicellular (plant or animal) organisms can be harnessed to produce otherwise chemically complex, low-yield, or chemically uncharacterized materials. These include “lock-and-key” receptor complexes with perfect stereochemical specificity, large-scale protein scaffolds, or antibiotics. One example is penicillin, with a sensitive β-lactam ring structure at its core (1). Mass-production of penicillin began several years before its first synthesis was even published (2).
PRODUCT FOCUS: Biologics
PROCESS FOCUS: Production
WHO SHOULD READ: QA/QC and process development
KEYWORDS: PAT, spectroscopy, cell culture, batch processing
LEVEL: INTERMEDIATE
In the 20th century, designer biological synthesis entered the age of mass production. The first large-scale manufacture of penicillin succeeded in time to treat soldiers at the end of World War II (3). And biological manufacturing continues to evolve today with large-scale production of vaccines, biopolymers, proteins, and viruses (4).
Online analysis is an essential part of modern manufacturing protocols. Currently, most biological manufacturers use multiple analytical tools to gauge critical process information such as osmolality, temperature, and pH. Biological systems are extremely sensitive complex matrices and require constant data feedback, analysis, and control to achieve a successful reaction. Small variations in temperature, for example, will lead to cell death and eliminate an entire culture. Loss of nutrients or accumulation of waste in a fed-batch process will cause suboptimal reaction performance. Accumulation of excess ammonia, for example, has been found to interfere with protein glycosylation in CHO cells (5).
The use and acceptance of near-infrared (NIR) spectroscopy as an online multicomponent analytical tool for the bioprocessing industry has grown substantially since early studies of NIR in cell culture media appeared in the 1990s (6). One main reason for the popularity of Fourier-transform NIR (FT-NIR) as a measurement technique in cell culture is its ability to provide rapid, accurate, high-resolution chemical analysis for major components of interest such as glucose or ammonia, even when they are present at low concentrations. FT-NIR has been commonly used in industries such as chemical, polymer, and pharmaceutical manufacturing for decades, but its adoption has been slower for biopharmaceutical processes.
Near-infrared spectroscopy uses overtones and combination bands to show the concentration of certain analytes. Once light from an FT-NIR analyzer impinges on a sample, characteristic vibrational frequencies are absorbed by various molecular species (e.g., glucose or water), providing a unique spectrum. By collecting multiple spectra over time and combining them with known analyte concentrations, users can create a calibration using multivariate algorithms such as partial least squares (PLS) regression. Such analytical technology allows for accurate, real-time predictions of multiple components within a complex matrix based on a single spectrum.
Here we offer experimental data from a cell culture of HEK293 (human embryonic kidney) cells using a Thermo Scientific brand Antaris FT-NIR analyzer to predict four critical in-process components: glucose, lactate, ammonia, and glutamine. Our study, however, includes component predictions for pH and cell density in addition to those critical nutrient (glucose and glutamine) and waste (ammonia and lactate) calibrations.
Experimental
We cultured HEK-derived cells transformed with Ad5 DNA (HEK 293) in a chemically defined, serum-free culture medium (HyClone CDM4HEK293) using a 10-L working volume, stirred-tank bioreactor at Thermo Fisher Scientific in Logan, UT. The bioreactor used a recirculation loop to continuously feed its culture contents (cells and spent media) through an optical flow-cell. A temperature-controlled NIR transmission compartment housed that flow-cell throughout the entire process.
We initiated this culture at a cell seeding density of 3.0 × 10⁵ viable cells/mL. Total process time was about 11 days. Cells reached a maximum population density of 8.5–9.0 × 10⁶ viable cells/mL by day seven of the batch culture. Viability remained above 90% throughout most of the process until about day ten as the cells reached senescence.
We used the Antaris FT-NIR analyzer (method development sampling system) to analyze this culture. The analyzer was equipped with a liquid-transmission sampling compartment that had a heated-cell option so the cell temperature could be kept at a constant 37 °C. We’d purchased a 1-mm fixed–path-length NIR flow-through cell from Hellma (www.hellmausa.com). The NIR spectral analysis range was from 4,000 cm−1 to 10,000 cm−1 at a resolution of 4 cm−1. We collected NIR data every hour while simultaneously drawing aliquots for electrochemical analysis.
For electrochemical analysis, we used a BioProfile 100 Plus analyzer from NOVA Biomedical (www.novabiomedical.com). We entered its values for pH, glutamine, glucose, lactate, and ammonia into a spreadsheet, which we used in concert with our spectral data to construct a chemometric model. Using a Beckman Coulter ViCELL counter (www.beckmancoulter.com), we also measured cell density and fit that into the model.
We built our chemometric model using TQ Analyst chemometrics software from Thermo Scientific with a PLS1 algorithm. Of the six components we analyzed in this experiment, four (glucose, glutamine, pH, and lactate) were treated together in a single chemometric model, whereas cell density and lactate were treated separately. For the four together, we pretreated the data using a first derivative with a Norris smooth (5,5) and mean centering. Lactate showed the best results with a slightly more aggressive smooth (11,5) and a combination of variance scaling and mean centering. Cell density optimized with no spectral pretreatment except for a mild Savitsky-Golay 5,3 smooth and mean centering. So a good deal of the information on cell density seems to be contained in baseline information, either offset or slope, or a combination of both. Table 1 lists other chemometric information, including regions.
Table 1: Chemometric method variables for the six components of interest in the HEK293 analysis
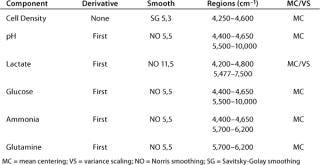
Table 1: Ch emometric method variables for the six components of interest in the HEK293 analysis ()
Results and Discussion
In our experiment, the major constituents of HEK293 culture medium
were analyzed using potentiometric and amperometric techniques. Glucose and glutamine (nutrients), ammonia and lactate (wastes), and pH (a critical in-process variable) were monitored using this methodology. Figure 1A and Figure 2B show component concentration data over time for the above components. Common y-axis scaling necessitated the plotting of glucose together with lactate and glutamine with ammonia. Figure 3C and Figure 4D respectively show the changes in viable cell population density (in units of cells/mL) and viability (in percentage units).
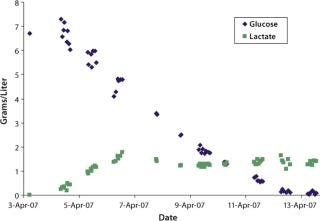
Figure 1a: ()
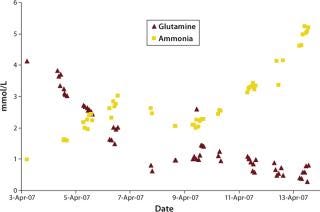
Figure 1b: ()
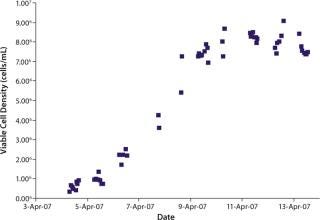
Figure 1c: ()
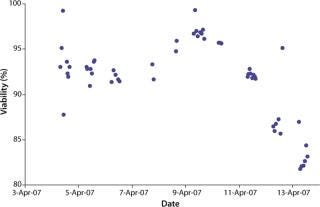
Figure 1d: ()
Trends in those data are commonly observed in batch-process cell cultures but not in fed-batch cultures. Glucose and glutamine (the primary sources of carbon and nitrogen, respectively) are consumed as time progresses and ammonia, lactate, and cell density increase. Glucose is consumed rapidly throughout the process until nearly completely consumed by day nine of the culture.
Lactate, a product of glucose metabolism, accumulates early in the culture until reaching a peak of ∼1.8 g/L on day three. Thereafter, the cells use it as a carbon source, so lactate level decreases or is maintained throughout the remainder of the batch. An inverse correlation between pH and lactate level is also observed during the culture due to the increased presence of lactic acid. Glutamine concentration decreases quickly during early culture. At 4.5 days its level is maintained or even increased for several days. Such increase is further supported by the apparent consumption of glutamate (not shown) and ammonium beginning on day four. Those metabolites are used in glutamine anabolism by action of the enzyme glutamine synthetase.
We collected NIR spectra throughout this culture process (Figure 2). The first salient feature of these spectral data are major absorbances by water at about 5,150 cm−1 and 7,000 cm−1. Such behavior is expected from aqueous samples, which is why a proper path-length specification is critical to accurate measurements. In this case, we fixed the path length at 1.0 mm to keep the 7,000 cm−1 peak in a reasonable absorbance range for analysis. The water combination band region was not used in this analysis due to its high absorbance of light even at small path-length.
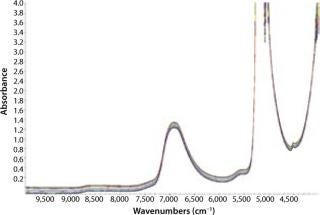
Figure 2: ()
The second significant spectral feature is a slight slope (tilt) and bias (offset) in the baseline. This can be caused by varying solids or cell density. The higher the cell density, the more NIR light scatters, giving rise to the above-mentioned effects. This comes into play when calibration for cell density is treated separately from the remaining components.
NIRS is a “secondary” technique, which means that NIR spectra must be correlated to primary or “known” data for predicting unknown samples. Such correlation is embodied in a NIR calibration curve, which is a plot of sample data for each component using values from the primary method plotted on its x-axis and values from the NIR predictions on its y-axis. If the NIR analyzer is successful in predicting analytes of interest, then a linear relationship will exist between these data sets, with a slope approaching 1 and a y-intercept approaching 0. We correlated our FT-NIR spectra to data from the BioProfile analyzer to yield calibrations for lactate, glucose, glutamine, pH, and ammonia. Cell density was correlated to the ViCELL automated cell counter.
Chemometrics is the study of statistical correlations in chemical data sets, which is critical to the science of NIR analytics. Chemometric analysis parameters can be broken down into two main categories: pretreatments and diagnostics. Data pretreatments are a way to increase the chances that a calibration will succeed. Common pretreatments include derivitization, smoothing, and path-length treatments. Diagnostics include the tools necessary for demonstrating or quantifying the success of a calibration. Table 1 shows chemometric data treatments for the six components in our HEK293 cell culture experiment. MC is mean centering, VS is variance scaling, NO is Norris smoothing, and SG is Savitsky-Golay smoothing. Analysis regions were designed to avoid the highly absorbing water band around 5,150 cm−1.
Our calibration model for nutrients, waste
, and pH used a first-derivative pretreatment with mild smoothing. Cell density data were used without the aid of derivitization, implying that most of the spectral response that contributes to this calibration model is contained in baseline effects. That conclusion is backed by loading spectra showing first loadings with little to no peak information. The only component that required more stringent smoothing was lactate. All component data were mean centered. We set the path-length treatment to constant for all calibration models because the path was physically controlled by a flow-through cuvette set at 1.0 mm.
Once a calibration curve has been constructed, statistical methods are used to quantify the correlation between NIR spectra and reference data. The main statistical parameters in our study are the correlation coefficient (R), root mean square error of calibration (RMSEC), root mean square error of cross validation (RMSECV), and factor analysis. Table 2 shows component range information as well as the calibration model output for these metrics.
Table 2: Data from the TQ Analyst PLS1 calibration for all six cell culture components

Table 2: Da ta from the TQ Analyst PLS1 calibration for all six cell culture components ()
Our calibration results and chemometric diagnostics show a strong correlation between FT-NIR data and the primary results from both the BioProfile analyzer and the cell counter. R values for all six components are between 0.926 and 0.995. We calculated RMSECV as a “jack-knife” or a one-at-a-time cross validation, showing a robust data model across components. Figures 3A and 3B show calibration curves for two components, pH and glucose, respectively.
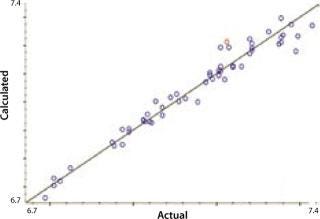
Figure 3a: ()
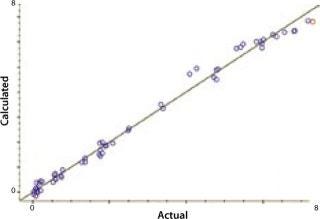
Figure 3b: ()
Another indicator of method performance in multivariate analysis is the predicted error sum of squares or PRESS plot. Such data comes from the relationship between the error of cross validation (plotted on a y axis) and the complexity of the model. In this case, model complexity is denoted by the number of factors. Too many factors can overfit a model; too few will underfit it. The shape of a PRESS plot should be a struggle between competing contributions to the model, one from interference and one from estimation (7). The resulting plot should begin high, reach a minimum, and then rise slightly from there. The two PRESS plots shown in Figures 4A (glutamine) and 4B (glucose) are examples of this trend, indicating reasonable model performance.
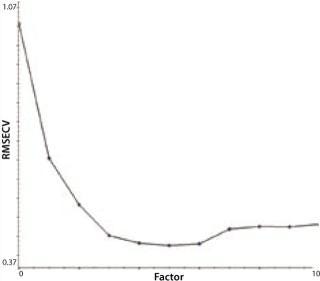
Figure 4a: ()
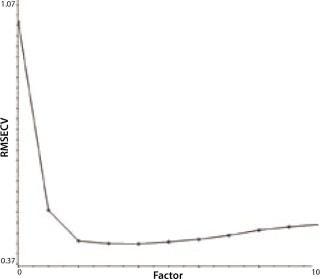
Figure 4b: ()
Near-infrared spectroscopy shows very reasonable correlations to primary datasets from a BioProfile analyzer for glucose, glutamine, lactate, ammonia, and pH and from a cell counter for cell density. These are all critical in-process components for judging the health of a mammalian cell culture. So our data strongly suggest that NIR analysis of online cultures can readily provide rapid, accurate analysis in real-time.
REFERENCES
1.) Nicolaou, KC. 2000.. Angew. Chem. Int. Ed. 39:44-122.
2.) Sheehan, JC. 1984.The Enchanted Ring: The Untold Story of Penicillin, MIT Press, Cambridge.
3.) Andersson, I. 2001. Towards New β-Lactam Antibiotics. Cell Mol. Life Sci. 58:1897-1906.
4.) Finter, NB, and AJM. Garland. 1990.Telling RC in Large-Scale Mammalian Cell Culture Technology, Marcel Dekker, New York.
5.) Zanghi, JA. 1999. Bicarbonate Concentration and Osmolality Are Key Determinants in the Inhibition of CHO Cell Polysialylation Under Elevated pCO2 or pH. Biotechnol. Bioeng. 65:182-191.
6.) McShane, MJ, and GL. Cote. 1998. Near-Infrared Spectroscopy for Determination of Glucose, Lactate, and Ammonia in Cell Culture Media. Appl. Spec. 52:1073-1078.
7.) Martens, H, and T. Naes. 1989.Multivariate Calibration, John Wiley and Sons, New York.
You May Also Like


