Aggregation from Shear Stress and Surface Interaction: Molecule-Specific or Universal Phenomenon?Aggregation from Shear Stress and Surface Interaction: Molecule-Specific or Universal Phenomenon?

WWW.PHOTOS.COM
Exposure to solid–liquid and air–water interfaces during production, freezing and thawing, shipment and storage of protein therapeutics may be a contributing factor in their degradation (e.g., aggregation, fragmentation) (1, 2). Surface exposure, particularly during manufacturing processes, often is accompanied by various degrees and durations of shear stresses originating from fluid flow and acting on proteins at interfaces. The magnitude and duration of shear rates depends on velocity gradients within each solution and varies significantly among manufacturing steps. On the low end, a shear rate of 50 s–1 (inverse seconds or Hertz) is applied to biotherapeutics during mixing processes typically lasting from minutes to hours. On the high end of the range, shear rates of up to tens of thousands of Hertz arise during filling (up to a million during high-pressure homogenization), but those usually are limited in duration to mere seconds (3). Additionally, proteins may be subjected to high shear rates when injected through thin needles (4).
No consensus yet has been reached on whether surface interaction, shear stress, a combination of those, or other events (e.g., cavitation) are causative for frequently observed protein aggregation (3, 5–7). Although Bee and colleagues found that the shear rates of manufacturing and injection are insufficient to induce protein aggregation or denaturation, Biddlecombe and colleagues have expressed an opposing opinion (4, 6). Using a rotating-disk device as a shear stress environment, they found that a shear rate of 30,000 s–1 can cause aggregation of an IgG4 as assessed by size-exclusion chromatography (SEC). However, the extensive solid–water interface could be a major contributor to protein degradation in their experimental set-up.
Previously, Perevozchikova and colleagues showed that a monoclonal antibody (MAb 1) in a citrate formulation adsorbed irreversibly to solid silicon oxide (SiOx) surfaces (8). Desorption induced by gentle buffer rinses over the SiOx layer resulted in formation of subvisible, micron-sized protein particles; however, no smaller oligomers were observed using multiple techniques.
Here, we extend this area of study by introducing high shear stress and evaluating the stability of the above-mentioned formulation (MAb 1 in citrate buffer) exposed to solid–water interfaces in the presence of a 20,000-s–1 shear rate, which resembles the maximum shear stresses encountered in biomanufacturing. We compare the degradation of MAb 1 in a citrate formulation to that of MAb 1 and MAb 2 in alternative histidine formulations to determine whether a common aggregation pathway exists for shear/surface-stressed antibodies. To test whether higher shear rates but shorter surface exposures would have the same detrimental effect on protein quality, we also subject those formulations to shear rates typical of injections.
Materials
We used three MAb formulations at 20 mg/mL in this study: MAb 1 in a citrate-based formulation and a histidine-based formulation and MAb 2 in a histidine-based formulation. To mimic the effects of manufacturing stress on biotherapeutic stability, we subjected both MAbs to the shear rate of 20,000 s–1 for 300 and 1,800 seconds, respectively. Both periods significantly exceed the typical durations of milliseconds to several seconds when proteins experience 20,000 s–1, and we chose them to demonstrate a worst-case, forced-degradation scenario.
We created a controlled shear-stress environment using a rotation rheometer set-up as previously described by Bee and colleagues (3). Stress is induced by placing 0.3 mL of a MAb sample onto the lower plate of the parallel plate (PP) measuring system (0.1-mm gap) of an Anton Paar Physica M301 rheometer and subjecting it to rotational shear for a specified period. We repeated this procedure three times to collect an amount of stressed sample sufficient for our planned analytical testing.
To control for degradation induced by surface interactions alone, we placed an aliquot of the protein formulation on the PP50 unit between nonrotating plates for a selected period (300 or 1,800 seconds). To estimate the contribution of nonproteinaceous particles leached from the PP surface to the overall microflow imaging (MFI) counts observed in stressed MAb formulations, we applied an additional citrate buffer sample to the rheometer at 20,000 s–1 for 1,800 seconds.
For the high–shear-rate and short–surface-exposure stress conditions, we subjected MAb 1 and MAb 2 molecules to shear rates of ~100,000 s–1 and ~300,000 s–1 by injecting them through a 27-gauge needle at 0.0625 and 0.2 mL/s, respectively. To amplify the amount of stress applied to these samples, we injected each formulation three times. A 3-mL MAb formulation sample in a 10-mL Becton Dickinson (BD) syringe with a 27-gauge needle was placed on a syringe-pump (Harvard Apparatus) set up with one of the two specified flow rates.
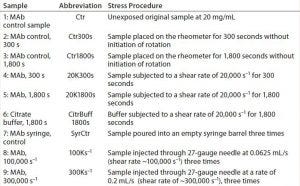
Table 1: Samples created and their abbreviations in graphs and tables
To evaluate whether any particles were contributed by the surface of the syringe itself, we poured a control sample directly between the inner surfaces of two 10-mL syringe barrels for a total of three times. Table 1 describes samples created during this study. Exposed MAb samples were analyzed by visual inspection, SEC with multiple-angle light scattering (SEC-MALS), dynamic light scattering (DLS), and MFI. We analyzed the citrate buffer sample with MFI alone.
Methods
Visual Inspection: We evaluated sample appearance by visually examining the color, clarity, and particulate content of each test article. Colors were evaluated by comparison with a certified color standard prepared to a prespecified range of intensities in accordance with the European Pharmacopoeia. Clarity was evaluated by comparison with water. We also visually examined our samples for the presence of particulate matter.
SEC-MALS: To determine the molecular-weight distribution of our biopharmaceuticals, we used high-performance SEC-MALS with UV and refractive index (RI) concentration detectors. Each species was separated on a 30 cm × 7.8 mm TSK-GEL G3000 SWXL analytical column (Tosoh Biosciences). For light-scattering measurements, we used an 18-angle Dawn Heleos II laser light scattering unit (Wyatt Technology) equipped with a QELS probe at detector 16 (140.7°). We measured sample concentration by UV detection at 280 nm.
Using a first-degree fit of the Zimm formalism in Astra 6 software (Wyatt Technology) and the standard protein refractive index increment (dn/dc) value of 0.185, we calculated molecular weight. Light-scattering detectors were normalized to the 90° detector in the mobile phase using isotropic scattering of a bovine serum albumin (BSA) monomer before all calculations.
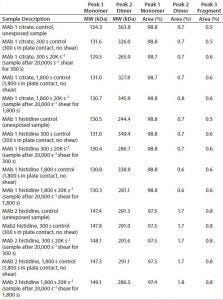
Table 2: Size-exclusion chromatography with multiangle light scattering (SEC-MALS) results on samples exposed to lower shear and long surface interaction conditions
DLS: Formation of aggregates in the nanometer-scale size range was followed by DLS using the Mobius Wyatt instrument in QELS mode. We placed undiluted 55-µL samples into disposable cuvettes and analyzed them with a DLS acquisition time of two seconds, collecting a total of 10 DLS acquisitions per measurement. Then we obtained an average of three measurements and calculated the standard deviation for adding to the graphs.
Data were analyzed using a 0.5-nm minimum and 1,000-nm maximum species size. Monomer peak 1 was assumed to represent monomer species because it ranged to 10 nm, peak 2 would represent smaller oligomers (tetramer to decamer), and peak 3 would be larger species (hundreds of nanometers). We measured the hydrodynamic radius, percent polydispersity, and percentages by intensity and mass of each defined peak.
MFI is an image-based method that measures particles as they flow through the detection zone in a flow cell. We used a Protein Simple MFI DPA4100 instrument for subvisible particle analysis, operating the instrument at low-magnification mode (5×) with a 400-µm flow cell. For each analysis, we set the sample run flow rate at 0.22 mL/min and analyzed 0.5-mL samples in triplicate. We checked flow-cell cleanliness with a blank run using water for injection (WFI) before each measurement. Particle concentrations (number of particles/mL) are reported in different size ranges based on their measured equivalent circular diameter.
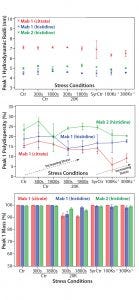
Figure 1: Dynamic light-scattering (DLS) experiments evaluate the aggregation propensity of MAbs subjected to different durations of shear stress and extents of surface exposure; (top) change in molecular hydrodynamic radii; (middle) percent polydispersity with increasing exposure to shear stress; (bottom) percent by mass of monomer peak reduced for sample exposures to the large surface area but relatively low shear stress. Error bars are calculated from running experiments in triplicate on each sample.
Results
Visual inspection indicated different initial general properties of tested formulations. MAb 1 was a hazy, colorless solution in both formulations; whereas MAb 2 represented a slightly yellow (BY6) liquid. Nevertheless, we found that all collected samples retained their original visual characteristics and remained particle free, signifying that no visible aggregates were formed by exposure to the shear stresses.
SEC-MALS Analysis: We used SEC-MALS to probe low–molecular-weight (MW) oligomers formed as a response to prolonged surface interactions in the presence of a 20,000 s–1 shear rate. Data obtained revealed no monomer loss in any of the three formulations (Table 2). We observed the same results for MAbs exposed to different injection shear rates (data not shown).
DLS: We investigated the formation of nanometer-scale aggregates using DLS. Figure 1(top) shows that no detectable changes in hydrodynamic radius (Rh) of peak 1 species (Rh cut-offs of 0.1–10 nm) resulted from low shear with long surface and high shear with short surface exposure. Similarly, we observed no trend of increasing polydispersity as a function of increasing shear stress in this study (Figure 1, middle). Both observations are in agreement with the SEC-MALS data, suggesting that formation of small aggregates is not associated with stresses induced in all conditions.
However, our assessment of the percent by mass of peak 1 (Figure 1, bottom) indicated a decrease of monomer contribution to the overall intensity in samples exposed to the lower 20,000 s–1 shear rate and longest surface interaction. Further examination of the DLS profile revealed the remaining species of the observed DLS signal to be aggregates sized in hundreds of nanometers. Because that size range is almost out of DLS detection capabilities, we analyzed the stressed and control samples using MFI.
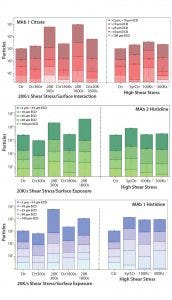
Figure 2: Microflow imaging (MFI) measurements demonstrate the effect of low shear with high surface exposure and of high shear alone on particle formation in three formulations: (top) MAb 1 in citrate buffer, (middle) MAb 1 in histidine buffer, and (bottom) MAb 2 in histidine buffer. Error bars are calculated from triplicate measurements. Sample abbreviations are as described in Table 1 and Figure 1 (with CitrBuffer1800s for buffer alone subjected to 20,000 s–1 shear for 1,800 s). Control samples exposed to no stress; ECD = estimated circular diameter.
MFI: We used MFI to evaluate the propensity for subvisible particle formation as a consequence of surface interaction and/or shear stress. To control for particles possibly leaching from the surface of the rheometer during plate rotations, we subjected citrate buffer to the shear rate of 20,000 s–1 for 1,800 seconds. Figure 2(top) shows an increase in particles of all size ranges resulting from surface contact for both 300-s and 1,800-s periods (for MAb 1 in citrate buffer).
The most significant increase came with the 20,000 s–1 shear rate for 1,800 seconds. “CitrBuff1800s” demonstrates that ~6,000 particles leached from the surface of the PP set-up during rotation (compared with 98,000 particles in a protein solution). Those results suggest that the observed increase of particles throughout all size ranges should be attributed to formation of proteinaceous species and considered to be a consequence of shear stress and surface interaction on protein stability.
But the MAb 1 citrate sample exposed to syringe injection (high shear with low surface exposure) demonstrated a negligible increase in the number of particles, with most of those originating from silicon oil droplets in the solution (their aspect ratio being ≥0.85). Figures 2(middle) and 2(bottom) show a similar observation for both MAb 1 and MAb 2 in histidine buffers: a measurable increase in particle count related to the low shear and surface interaction of the PP, but no effect of high shear on the observed particle formation after triple needle injection.
Figure 3 shows a screening for particle-formation propensity of tested formulations and antibodies caused by exposure of protein molecules to 20,000 s–1 shear rates for 1,800 seconds. Throughout all size ranges — except for particles >50 µm, which are too few to reliably compare the formulations — the MAb 1 histidine formulation appears to be the most stable against shear/surface-induced degradation. MAb 1 in citrate is the most susceptible to stress-induced aggregate formation. Comparing formulated unstressed samples would yield no ranking insights: All controls show the comparable number of particles between them.
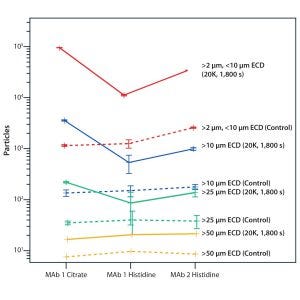
Figure 3: Screening MAb solutions for their propensity for aggregation induced by shear stress and surface interaction; three formulations were compared based on the extent of particle formation after exposure to 20,000 s–1 shear stress rate for 1,800 seconds. Straight and dotted lines represent stressed (20K1800s, samples exposed to 20,000 s–1 shear rate for 1,800 seconds) and control (Cntr, unexposed) samples, respectively. The y axis shows the number of particles formed within each size range measured as estimated circular diameter (ECD) — red (2–10 µm), blue (>10 µm), green (>25 µm), and yellow (>50 µm).
Discussion
Expanding on the previous work of MAb 1 adsorption to a SiOx surface (8), we investigated whether additional stress would alter or exacerbate the degradation pathway of the molecule by exposing the same antibody to that solid interface both with and without shear stress. We have found that for MAb 1 in a citrate-based formulation, aggregates formed predominantly in the subvisible particle-size range, as detected by DLS (particle sizes in the hundreds of nanometers) and MFI (2–100 µm particle sizes). No visible aggregates were detected.
We also observed no signs of degradation using different analytical techniques for MAb 1 injected three times through a 27-gauge needle. Because no aggregate formation was detected following the high shear stress and short surface exposure of injection, we believe that a likely explanation for the observed protein instability is interaction of the protein with the solid surface. Protein adsorption to the surface could lead to partial unfolding of the molecular structure followed by desorption of the resulting partially unfolded species, which would then nucleate aggregation. Alternatively (or additionally), surface aggregates could slough off to become detectable in solution.
We find it interesting that exposing MAb 1 in a citrate solution to SiOx surfaces under low-shear conditions also led to formation of subvisible particles but not low-MW aggregates (small oligomers) or visible species (8). In terms of particle count, it is difficult to compare quantitatively the extent of protein degradation between both studies: In the original work, MAb 1 was diluted significantly with buffer during desorption.
In our experimental design, antibody solutions placed on the rheometer but not subjected to shear showed several orders of magnitude less particle formation than did shear-stressed material. Our results suggest that particle formation is intensified by the amplified desorption effects of shear stress. The alternative histidine-based formulations of both MAb 1 and MAb 2 also demonstrated aggregation (subvisible particles) at lower shear and prolonged surface interaction, but they did not demonstrate an effect from the high shear of injection. Consistency in aggregate types formed in these systems suggests a common degradation pathway for the antibodies tested.
Although the aggregation mechanism appeared to be consistent for both MAb molecules, the extent of degradation varied substantially between them and their formulations. This demonstrates that probing surface adsorption and subsequent desorption due to shear stresses can be an effective methodology to use in forced-degradation studies (Figure 3).
Proteins and Shear Stress in Bioreactorsby Cheryl Scott |
|---|
In preparing this manuscript for publication, I got to thinking about protein aggregation in bioreactors — in particular related to shear forces therein. We often hear about how those can cause trouble for sensitive eukaryotic cells, but I hadn’t really thought about them in relation to expressed protein stability. So I decided to do a little reading up on the topic, and here’s what I learned. |
Impeller Shear Force: The classic bioreactor design uses a propeller-like apparatus to mix and stir the contents and keep them from settling in layers to the bottom of the vessel. Impellers may use radial or axial flow and come in a number of formats (1). Marine-blade, cell lift, and spin filters are low-shear options; Rushton and pitched-blade impellers less so. In relation to the findings reported herein, what rate of shear does each impart upon a cell culture? It depends on the the rotational speed of the impeller (2). And that seemingly simple question takes you down the rabbit hole of fluid dynamics, the mathematics of which are beyond me. But the layman’s answer appears to be in the hundreds to low thousands of inverse seconds — not so daunting in relation to the forces discussed in this article. However, the duration of a fed-batch culture can be days long, and that’s where the trouble lies. |
Sparger Shear Force: Spargers introduce vital gases into cultures, providing cells with what they need for “respiration” as well as helping to maintain pH and other conditions. Some bioreactors use bubblers for mixing as well. And we know that bubbles create shear, so what rates of shear do spargers impart? The mathematics here make impeller forces look easy (2). Bubble shear depends on the superficial gas velocity and is a function of fluid/gas volume, consistency, and density. And I’m not an engineer; I just spend a lot of time around engineers. So again, I seek a general rule of thumb. And it’s interesting that the answer is similar to that for impellers above. Here too, duration is the deciding factor. So gentle mixing of a formulation for a few minutes or hours doesn’t compare to what the drug substance went through in its infancy! And as my grandfather used to say, “I can wrestle a bear for a little while.” So too, as the authors point out here, can even a fragile protein handle exponential shear rates for a second or two. |
Osmolality and Osmolarity: One of the strange consequences of learning biochemistry backward — from nearly 20 years of editing manuscripts, that is — is a familiarity with terms you don’t fully understand. “Wait, osmolarity and osmolality are two different things? Time for a little research. . .” Osmolality describes osmoles (Osm) of solute present per kilogram of solvent (osmol/kg or Osm/kg); osmolarity describes the number of solute osmoles per liter of solution (osmol/L or Osm/L). We know that cells do best when these parameters in a bioreactor culture mimic those they would experience in their natural enviroment (a living body). But what does this have to do with expressed protein aggregation? That question takes me back to one of our most popular articles of all time (3). In it, the authors point out that proteins are sensitive to slight changes in solution chemistry and remain stable “only within a relatively narrow range of pH and osmolarity.” Changing osmotic strength is a common option for reversing soluble aggregation, as well. Osmotic conditions are thus an important parameter in production, processing, and formulation of biotherapeutics. Adjusting them may alter how proteins (and cells) respond to the stresses that shear imparts upon them. Understandably, if you make your cells “happy,” then so too should be the proteins they express. But not necessarily: Conditions inside those cells aren’t always the same as what’s outside them — most notably that pesky shear force. Controlling osmotic conditions along with temperature and pH will help keep the protein of interest correctly folded and safely in solution. |
References1 Mirro R, Voll K. Which Impeller Is Right for Your Cell Line? A Guide to Impeller Selection for Stirred-Tank Bioreactors. BioProcess Int. 7(1) 2009: 52–57. 2 Pérez JAS, et al. Shear Rate in Stirred Tank and Bubble Column Bioreactors. Chem. Eng. J. 124(1–3) 2006: 1-5; doi:10.1016/j.cej.2006.07.002. 3 Patel J, et al. Stability Considerations for Biopharmaceuticals: Overview of Protein and Peptide Degradation Pathways. BioProcess Int. 9(1) 2011: 20–31. |
Acknowledgments
Thanks to Aarti Gidh, James Colandene, and Trevor Wiley for valuable input and insightful discussions.
References
1 Fleischman ML, et al. ShippingInduced Aggregation in Therapeutic Antibodies: Utilization of a Scale-Down Model to Assess Degradation in Monoclonal Antibodies. J. Pharm. Sci. 12 December 2016, doi: 10.1016/j.xphs.2016.11.021.
2 Hawe A, et al. Forced Degradation of Therapeutic Proteins. J. Pharm. Sci. 101(3) 2012: 895–913.
3 Bee JS, et al. Response of a Concentrated Monoclonal Antibody Formulation to High Shear. Biotechnol. Bioeng. 103(5) 2009: 936–943.
4 Rathore N, et al. Characterization of Protein Rheology and Delivery Forces for Combination Products. J. Pharm. Sci. 101(12) 2012: 4472–4480.
5 Biddlecombe JG, et al. Determining Antibody Stability: Creation of Solid–Liquid Interfacial Effects within a High Shear Environment. Biotechnol. Prog. 23(5) 2007: 1218–1222.
6 Biddlecombe JG, et al. Factors Influencing Antibody Stability at Solid–Liquid Interfaces in a High Shear Environment. Biotechnol. Prog. 25(5) 2009: 1499–1507.
7 Wang W, et al. Antibody Structure, Instability, and Formulation. J. Pharm. Sci. 96(1) 2007: 1–26.
8 Perevozchikova T, et al. Protein Adsorption, Desorption and Aggregation Mediated By Solid–Liquid Interface. J. Pharm. Sci. 104(6) 2015: 1946–1959.
Corresponding author Tatiana Nanda is an investigator in biopharmaceutical product sciences; Jing He and Matthew Haas are senior scientists, and Igor Rusanov is a scientist in biopharmaceutical analytical sciences; Robert Sweder is an investigator, and Douglas Nesta is director of biopharmaceutical product sciences at
GlaxosmithKline, 709 Swedeland Road, King of Prussia, PA, 19406; 1-610-270-5885; [email protected]. Shirley Shpungin is an associate scientist in drug product development at Janssen R&D, LLC (Malvern, PA), and Charlene Brisbane is director of drug product development and operations in biologics CMC at Teva Pharmaceuticals (West Chester, PA).
You May Also Like


