Comparing Techniques for Viscosity Measurement of Biopharmaceutical ProductsComparing Techniques for Viscosity Measurement of Biopharmaceutical Products

https://stock.adobe.com
In fluid dynamics, viscosity refers to the physical property that characterizes a fluid’s resistance to flow (1). Most fluids can be classified as Newtonian or non-Newtonian (2). The viscosity of a Newtonian fluid is independent of the amount of shear applied to that solution at a constant temperature (2). Thus, the fluid’s shear rate is directly proportional to the shear force applied (3). By contrast, for non-Newtonian fluids, the fluid viscosity decreases (shear thinning) or increases (shear thickening) depending upon the level of shear applied (3, 4). Most monoclonal antibody (mAb) solutions behave as Newtonian fluids, although certain concentrated mAb solutions have exhibited non-Newtonian behavior (5). Usually, mAb-solution viscosity increases linearly with rising protein concentrations up to 100 mg/mL; however, for some mAb products, viscosity increases exponentially above 100 mg/mL (6). Therefore, viscosity is an important physical property that must be measured during development of protein formulations to enable both drug substance/product manufacturing and delivery through a compatible device.
Several techniques can measure viscosity, and each method has distinct capabilities, advantages, and limitations. For specialists developing protein formulations, using the right technique for a given solution is important to generating meaningful rheological data as a function of relevant variables. Our study evaluated methods based on rotational rheometers, automated capillary viscometers, and Viscometer/Rheometer-On-a-Chip (VROC) viscosity-measurement technology (RheoSense) to determine whether those techniques yield comparable measurements for the same solution.
We applied a sucrose solution as a mAb surrogate because it displays Newtonian behavior, provides a broad range of viscosity values at different concentrations, and yields a concentration-dependent relationship with viscosity resembling that of mAb solutions (7, 8). Sucrose solutions with a range of viscosities were measured on a rotational rheometer, automated capillary viscometer, and VROC instrument, and we compared the generated viscosity values against those reported by the National Bureau of Standards (9). This article summarizes our findings and provides some guidance.
Overview of Evaluated Techniques
Rotational Rheometer: The Brookfield Ametek DVNext rotational rheometer leverages a cone-and-plate design (10). Analysis with this instrument typically requires >500 µL of sample. The principle of measurement is that the torque required to turn an object in a solution is a function of that fluid’s viscosity. Shear flow in the liquid is generated by rotating the cone while keeping the plate stationary. Sample fluid between a spindle and a stationary flat plate exhibits resistance to rotation, which the instrument determines optically by measuring the shift in the spindle’s position (spring deflection). The torque that the fluid exerts on those fixtures enables calculation of the fluid’s viscosity.
For such instruments, the range of viscosity measurement depends on a spindle’s rotational speed, size, and shape, as well as sample-container properties and the full-scale torque of a calibrated spring. The higher the spring torque, the higher the measurement range will extend. A CP40 spindle can achieve shear rates as high as 1875 s–1 (7).
Automated Capillary Viscometer: The Big Kahuna automated capillary viscometer (Unchained Labs) uses the Hagen–Poiseuille law (Equation 1) and associated equations to calculate a sample’s viscosity (Equation 2) and shear rate (Equation 3) (11):

Equation 1
ΔP = 8µLQ πR4
Equation 2
Viscosity = |ΔP|πR4 8QΔx
Equation 3
Shear Rate = 4Q πR3
During application, a sensor in the viscometer measures pressure drops across the capillary (ΔP). The length of the capillary (Δx) is known, and its radius (R) is determined by calibration with organic viscosity standards of 2–75 cP. Defined as the rate at which a sample is injected into a capillary (µL s–1), the flow rate (Q) is a user-specified variable that can be adjusted per sample depending on the experiment.
A specific shear rate can be targeted by adjusting the flow rate accordingly. Due to limitations of the instrument’s pressure sensor, the maximum shear rate that a Big Kahuna viscometer can measure differs by sample viscosity. It is not recommended to measure low-viscosity samples (<15 cP) at shear rates <5000 s–1 because of increased variability in results.
As a fully automated system, the Big Kahuna instrument can operate for extended periods without manual intervention. The viscometer can measure samples in the temperature range of 0–40 °C with samples as small as 100 µL. An automated mechanism seals sample plates to prevent evaporation throughout an experiment.
VROC Technology: The VROC initium one plus system (RheoSense) combines microfluidic and microelectromechanical systems (MEMS) technologies in its measurement cell (chip) to take viscosity measurements over a wide dynamic range of shear rates with low sample-volume requirements (≤100 µL) (12). Users can design unique protocols for each sample with variable parameters such as shear rate (40–150,000 s–1), temperature (4–70 °C), and number of replicates at each condition. The chip used for sample analysis is selected based on the expected viscosity range of the sample and the desired shear conditions of the measurement.
The VROC system uses this equation to calculate the dynamic viscosity:
Equation 4
Dynamic Viscosity = Shear Stress ÷ Shear Rate
Shear rate is calculated based on sample flow rate and the dimensions of the flow channel. The system uses a precision syringe pump to control the flow rate as a sample moves through the chip. Shear stress is calculated based on the pressure drop of the sample as it moves through the chip and on the dimensions of the flow channel. A silicone pressure-sensor array records sample pressure at multiple points in the flow cell to calculate the pressure drop.
Results and Discussion
Rationale for Using Sucrose Solutions as Surrogates for Viscosity Measurement: We prepared and measured sucrose solutions to compare viscosity results across the three instruments described. We selected sucrose solutions because they are well characterized, readily available, stable, and Newtonian in behavior. Moreover, viscosities of sucrose solutions have been published by an accredited source, the US National Bureau of Standards (9). Those characteristics make sucrose solutions a reliable standard for comparing viscosity measurements of other Newtonian fluids with different instruments.

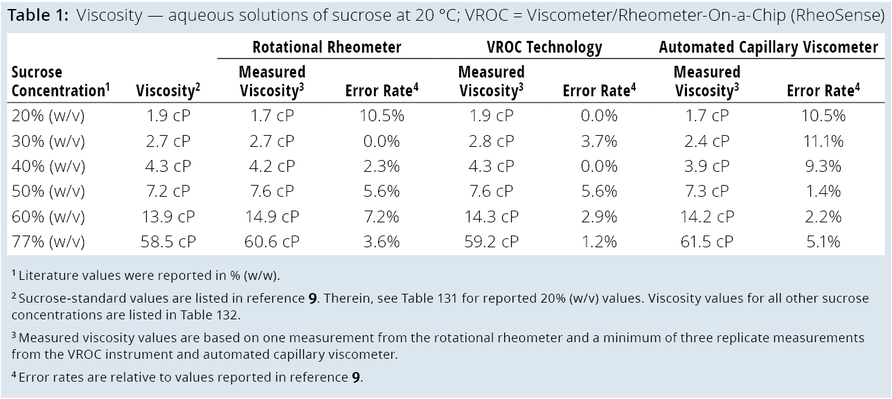
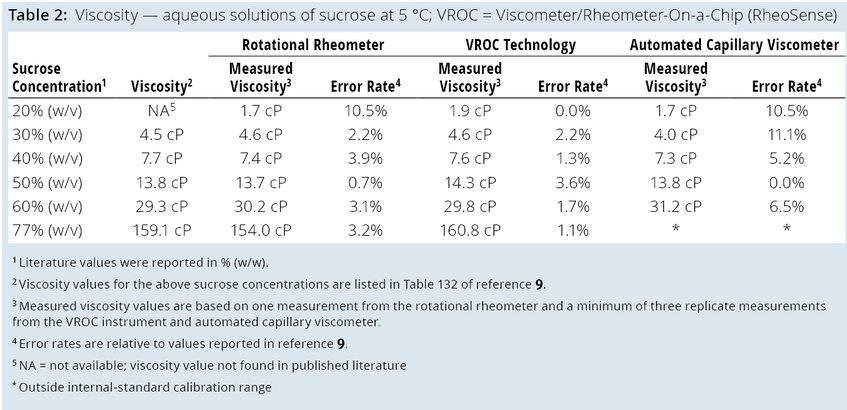
Comparing the Three Techniques: Our team used the three described methods to measure the viscosity of aqueous sucrose solutions between 20% (w/v) and 77% (w/v) at 5 °C and 20 °C and at shear-rate ranges specific to the technique. Tables 1 and 2 list the viscosity results.
Table 1 shows that viscosity measurements among the three techniques were comparable at 20 °C in the range of 2–60 cP. Likewise, viscosity measurements were consistent with those reported in literature (9). At 5 °C (Table 2), the techniques’ measurements were comparable and consistent with reported values except for the 77% (w/v) sucrose solution. The viscosity of that solution fell outside of the standard calibration range of the Big Kahuna system, precluding viscosity measurement.
We also used the three described techniques to measure the viscosity of two mAb solutions, with concentrations of 90 mg/mL and 171 mg/mL. Data generated using mAb solutions are not shown for proprietary reasons, but measurements were comparable across the methods. Our results show that the three techniques can provide comparable viscosity measurements for solutions that exhibit Newtonian behavior in the viscosity range of 2–160 cP.
Conclusions and Guidance
We found that viscosity-measurement techniques based on rotational rheometer, automated capillary viscometer, and VROC technologies provide comparable results for a given Newtonian fluid when measured at 5 and 20 °C within the viscosity range typically observed with protein solutions. Our study suggests that, during process and device development, any of those three techniques may be used effectively for viscosity measurements to assess protein formulations that exhibit Newtonian behavior.
Some protein formulations are known to exhibit non-Newtonian properties. Further evaluations would be necessary to understand whether results for non-Newtonian fluids are comparable across viscosity-measurement techniques.
Acknowledgments
We thank Prasad Oruganti, Andreas Sophocleous, Joseph Perchiacca, Shubhadra Singh, Julie Zhu, Renuka Thirumangalathu, Manish Gupta and several other colleagues from GSK for their support and feedback.
References
1 Maheshwar M. A Review Article on Measurement of Viscosity. IJRPC 8(1) 2018: 69–77; https://www.ijrpc.com/files/13-01-18/08.pdf.
2 Chinyoka T. Comparative Response of Newtonian and Non-Newtonian Fluids Subjected to Exothermic Reactions in Shear Flow. Int. J. Appl. Comput. Math. 7, 2021: 75; https://doi.org/10.1007/s40819-021-01023-4.
3 George HF, Qureshi F. Newton’s Law of Viscosity, Newtownian and Non-Newtonian Fluids. Encyclopedia of Tribology. Encyclopedia of Tribology. Wang QJ, Chung YW, Eds. Springer: Boston, MA, 2013; https://doi.org/10.1007/978-0-387-92897-5_143 2013, 2416-2420.
4 Rosti ME, Takagi S. Shear-Thinning and Shear-Thickening Emulsions in Shear Flows. Physics of Fluids 33, 2021: 083319; https://doi.org/10.1063/5.0063180.
5 Allmendinger A, et al. Rheological Characterization and Injection Forces of Concentrated Protein Formulations: An Alternative Predictive Model for Non-Newtonian Solutions. Eur. J. Pharmaceut. Biopharmaceut. 87(2) 2014: 318–328; https://doi.org/10.1016/j.ejpb.2014.01.009.
6 Palm T, et al. The Importance of the Concentration-Temperature-Viscosity Relationship for the Development of Biologics. BioProcess Int. 13(3) 2015: 32–34; https://www.bioprocessintl.com/monoclonal-antibodies/the-importance-of-the-concentration-temperature-viscosity-relationship-for-the-development-of-biologics.
7 Arian E, Pauer W. Sucrose Solution as a New Viscous Test Fluid with Tunable Viscosities up to 2 Pas for Micromixing Characterization by the Villermaux–Dushman Reaction. J. Flow Chem. 11, 2021: 579–588; https://doi.org/10.1007/s41981-021-00158-1.
8 Galmarini MV, et al. Comparison of the Viscosity of Trehalose and Sucrose Solutions at Various Temperatures: Effect of Guar Gum Addition. LWT — Food Sci. Technol. 44(1) 2011: 186–190; https://doi.org/10.1016/j.lwt.2010.04.021.
9 Swindells JF, et al. Viscosity of Sucrose Solutions at Various Temperature: Tables of Recalculated Values. Supplement to National Bureau of Standards Circular 440. US National Bureau of Standards: Washington, DC, 31 July 1958; https://nvlpubs.nist.gov/nistpubs/Legacy/circ/nbscircular440sup.pdf.
10 DVNext Rheometer Operations Manual (M19-2101-D). Ametek Brookfield: Berwyn, PA, 2019.
11 Viscosity Station for Big Kahuna and Junior. Unchained Labs: Pleasanton, CA, 2018; https://www.unchainedlabs.com/wp-content/uploads/2021/12/11_viscosity_station_spec_sheet.pdf.
12 VROC® initium one plus User’s Manual (manual version: 2.1.1.8, softwhttps://nvlpubs.nist.gov/nistpubs/Legacy/circ/nbscircular440sup.pdfare version: 2.2.2.0). RheoSense: San Ramon, CA, 2023, https://www.rheosense.com/customer-access/vrocinitiumoneplus.
Corresponding author Ning Wang is a principal scientist ([email protected]), Brenden Turner is a senior associate scientist, Summer Stephens is an automation scientist, Alejandro D’Aquino is an investigator, Himanshu Sharma is a scientific leader, James D. Colandene is a scientific director, and Kashappa Goud Desai is an associate director, all in the Drug Product Development — Steriles division of GSK, 1250 South Collegeville Road, Collegeville, PA 19426.
You May Also Like


