Emerging Analytical Technologies for Biotherapeutics DevelopmentEmerging Analytical Technologies for Biotherapeutics Development
A major goal of pharmaceutical development is to characterize pathways of chemical and physical instability and then to develop strategies to minimize them. Deamidation and oxidation are examples of the former, aggregation a result of the latter. The potential for the presence of multiple variants in protein-based pharmaceuticals highlights a need for analytical methods capable of reliably and accurately identifying and measuring those variants. The ideal analytical method would be sensitive, accurate, linear over a broad range, resistant to sample-matrix interference, capable of measuring all possible structural variants of a protein, and would allow for high throughput. Needless to say, such a method does not yet exist. So multiple methods are used to study the different characteristics of each protein.
PRODUCT FOCUS: PROTEINS/PEPTIDES
PROCESS FOCUS: DOWNSTREAM PROCESSING, FORMULATION DEVELOPMENT
WHO SHOULD READ: ANALYTICAL, PROCESS DEVELOPMENT, FORMULATIONS, AND PRODUCT DEVELOPMENT PERSONNEL
KEYWORDS: PROTEIN AGGREGATION, PARTICULATES, ANALYTICAL METHODS, HIGH-THROUGHPUT, IMMUNOGENI#CITY
LEVEL: INTERMEDIATE
Chromatography and electrophoretic techniques have traditionally been the analytical “work horses” for measuring and monitoring protein quality. They are used in all stages of research and development including formulation development, comparability assessment, and commercial-product quality testing (release and stability). Although several of these methods have long been common in biotechnology product development, motivation for continued advancement stems from the desire to improve their sensitivity, accuracy, and specificity and adapt them to changing sample characteristics (e.g., high-concentration formulations) as well as higher throughput. We focus here on methods to detect, measure, and/or characterize protein aggregates and particles as well as advances in high-throughput technologies.
Protein Aggregates
Aggregation is a major regulatory concern due to its potential link to immunogenicity (1). This is a major challenge for pharmaceutical development of bioproducts because of their heterogeneous nature, complex mechanisms of formation, and potential for aggregate loss depending on the analytical method used (2, 3). A wide variety of aggregates are encountered in biopharmaceutical samples, ranging in size and characteristics (e.g., soluble or insoluble, covalent or noncovalent, reversible or irreversible) (2). Protein aggregates span a broad size range, from small oligomers (nanometers) to insoluble micron-sized aggregates that can contain millions of monomer units.

Figure 1:
DIGITAL VISION (WWW.DIGITALVISIONONLINE.COM)
Aggregation can occur at any stage during manufacture, storage, distribution, or handling of products, and it results from various kinds of stress such as agitation and exposure to extremes of pH, temperature, ionic strength, or various interfaces (e.g., air–liquid interface). High protein concentrations (as in the case of some monoclonal antibody formulations) can further increase the likelihood of aggregation (4). Therefore, aggregation needs to be carefully characterized and controlled during development, manufacture, and subsequent storage of a drug substance and formulated product.
Size-exclusion chromatography is the most commonly used control method and an industry standard for quantitation of aggregates. It is a versatile technique for separation and quantitation of aggregates because of its high precision, high throughput, ease of use, compatibility with a quality control (QC) environment, and in most cases accurate quantitation of aggregates. In spite of its strengths, several concerns exist with size-exclusion chromatography (SEC): a potential loss of aggregates (especially multimers), interaction of samples with a column matrix, change of a sample buffer matrix to SEC mobile phase, and inherent dilution of samples (2, 3, 5,6,7,8). Additionally, perturbation of aggregate distribution under standard SEC method conditions was recently suggested when an enriched fraction of an antibody dimer when reanalyzed by SEC exhibited a greater extent of dimer conversion into monomer and trimer compared with measurement by sedimentation-velocity analytical ultracentrifugation (AUC-SV) (9).
It is well recognized that no single technique can provide information on all types of aggregates, so use of orthogonal techniques is necessary for their comprehensive characterization. With high-concentration samples, direct characterization of aggregation at relevant concentrations is challenging either because of limitations in the dynamic range of available techniques or because nonideality effects at high concentrations introduce difficulties in data interpretation.
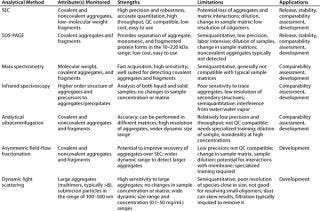
Table 1 lists the relative merits and limitations of traditional and emerging techniques for detection, quantitation, and characterization of aggregates. Three methods that have attracted a lot of interest are AUC-SV, dynamic light scattering (DLS), and asymmetric field-flow fractionation (aFFF).
Table 1: Analytical methods for detection, measurement, and/or characterization of aggregates in biopharmaceutical development

Table 1: An alytical methods for detection, measurement, and/or characterization of aggregates in biopharmaceutical development ()
Analytical ultracentrifugation relies on hydrodynamic separation of various species in a heterogeneous protein mixture under strong centrifugal force (10). It complements SEC in resolving and quantitating low levels of protein aggregates. The main advantages of AUC-SV are its ability to detect and measure higher order aggregates (which may elute in the void volume of an SEC column) and to conduct these measurements without exposing samples to a column or SEC mobile phase. This was used to trace the source of an antibody aggregation to the pH neutralization step following low-pH viral inactivation (unpublished results).
AUC-SV is considered an accurate method because it does not require standards or dissociate aggregates, so it can be used as an orthogonal method to verify the accuracy of SEC results. However, AUC-SV suffers from lower precision than SEC. The practical aspects of AUC-SV that impact precision and accuracy are beginning to be better understood, and several recent studies have demonstrated the utility of AUC-SV to detect and quantitate aggregates present at relatively low (∼1%) levels (3, 11, 12). Despite its advantages, AUC
-SV is not yet readily amenable for use as a routine release test in the biotechnology industry because of low throughput, the need for specialized equipment, nonideality at high protein concentrations, training issues, and difficulty in validating data analysis software.
Dynamic light scattering (DLS) uses the time-dependent fluctuations of a scattered-light signal for calculating the hydrodynamic diameter of aggregates and their relative fractions (13). This method is highly sensitive to large aggregates because the intensity of scattered light increases proportionally to molecular weight. As a result, very large aggregates (e.g., a 1,000-mer) present at trace levels (≤0.1%) can be detected with high sensitivity (14). Such aggregates, if present, would elute in the void volume of an SEC column or may be filtered out.
It has been proposed that very large aggregates (20–400 nm) may serve as critical nuclei for formation of visible particulates. So DLS can aid in the early detection of nucleating species and subsequent mitigation of aggregate formation. DLS measurements can be made without sample manipulation (other than filtration to remove dust), which makes it an excellent technique to monitor aggregates without changing buffer matrix or sample concentration.
Although this method is ideal for detecting very low mass fractions of large aggregates, it cannot resolve species that are similar in size. At least a three- to fivefold difference in hydrodynamic diameter is necessary for resolving different species. DLS is also not amenable to use as a control method because it is semiquantitative and very sensitive to dust or other extraneous particles. Results also depend on the algorithm used for data analysis, which is often proprietary to the manufacturer of a given instrument.
Field-Flow Fractionation: As an orthogonal technique to SEC and AUC-SV, analytical field-flow fractionation (aFFF) has gained popularity in recent years for its ability to fractionate protein aggregates without a column (12). It most commonly uses two fluid flows (“fields”) in a channel to achieve particle separation based on molecular weight and hydrodynamic size (diffusion coefficient). Injected macromolecular species are held in place by a cross flow on a semipermeable membrane while a perpendicular channel flow carries molecules forward based on their diffusion coefficient, thereby providing size-based fractionation.
Because aFFF involves no column interactions, it is considered a more gentle separation technique than SEC. However, concerns regarding the interaction of aggregates with the membrane have yet to be completely addressed. FFF can be coupled with different detectors such as light scattering, refractive index, and ultraviolet (UV). When compared with SEC, the precision and limit of detection of a FFF are inferior in the high–molecular-weight range (because of increased baseline noise). Also, experimental conditions (e.g., cross-flow rate) for reasonable separations in one size range do not work well for other size ranges, making it cumbersome to cover the entire range of interest (10). Along with other limitations such as the need for specialized equipment and training, difficulty in validating the method prevents a FFF from being applied for release and stability monitoring (9, 12).
Particulates
Protein-containing solutions tend to form particles form particles due to handling procedures or upon storage (15, 16). These particulates generate safety concerns because of their potential to obstruct blood capillaries and fine-gauge needles and/or induce immunogenicity (17). Conventional separation techniques such as SEC detect soluble aggregates of proteins in the low-nanometer size range. However, a broad size range between few tens of nanometers (soluble) and about 100 µm (visible) is difficult to explore primarily because adequate detection and characterization techniques don’t cover the whole size range. If instability of a biologics formulation is related to protein particle formation, it might involve higher-order structures and subvisible intermediates (Figure 1). Understanding the nature of submicron particles might hold important clues to deciphering the origin of visible particulate formation.

Figure 1: ()
Light obscuration (LO) and visual inspection are commonly used in estimating the number of subvisible and visible particles respectively in protein-containing solutions. Results from such analyses have been used to determine the stability and suitability of products and their use. The primary concern in applying the LO technique to estimate the number of subvisible particles in protein-containing solutions relates to its lack of sensitivity to shape characteristics (protein particles can vary from roughly spherical to string-like), the translucent nature of protein particulates, and the accuracy of results when samples contain visible particulate matter. Although the technique provides accurate results when particles are spherical and sufficiently opaque, it is not clear whether this method is accurate for analysis of protein-containing solutions.
Visual inspection is a qualitative technique used to detect visible particulate matter (typically over ∼80 µm). However, whether inspection is performed manually or with an automated system, this method relies on a well designed training program to reduce variability in particle detection and identification. Further, it is extremely difficult if not impossible to create appropriate protein-particle standards. Although visual inspection of multiple samples is possible manually, it is labor-intensive and tends to vary in results (which increases with operator fatigue). Manual microscopic techniques also suffer from similar limitations for protein-containing solutions. Some such limitations come from variations in microscope illumination set-up, errors in estimating the equivalent circular diameter (ECD), difficulty in distinguishing transparent particles relative to their background, and operator fatigue.
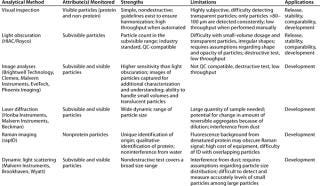
So there is a need for techniques that can provide quantitative assessment of both subvisible and visible protein particulates that is sufficiently precise, amenable to high-throughput, and QC-compatible. Although they don’t yet overcome all above-mentioned limitations, the techniques described below seem promising. Table 2 describes their strengths and limitations.
Table 2: Analytical methods for detection, measurement, and/or characterization of particulates in biopharmaceutical development

Table 2: An alytical methods for detection, measurement, and/or characterization of particulates in biopharmaceutical development ()
Emerging Techniques for Improved Particulate Detection and Characterization: Advances in imaging have been used by multiple vendors to enable dynamic imaging analysis that yields size and shape information (18). These analyses (such as microflow imaging from Brightwell Technologies, www.brightwelltech.com) capture digital images of particles suspended in a fluid as they pass through a sensing zone. Images are automatically analyzed to provide a digital archive of particle parameters such as Feret diameter, aspect ratio, circularity, intensity, and ECD.
High sensitivity, material independence, and a broad particle size ranges make this technology suitable for challenging particulates such as those found in protein-based solutions (19). Also, if particulate formation in a protein formulation is relatively slow, the dynamic nature of size distribution can be tracked over time. Such data are valuable to characterize particle formation during biologics formulation development as well as to find potential prevention strategies. Drawbacks include the inherent complexity in determining a true size distribution from imaging data for biologics particles because of their often extreme irregularity in size and shape. Also, size distribution and particle count from dynamic imaging cannot be directly compared with such information obtained from light obscuration or laser-diffraction analyses.
Laser-diffraction analyzers rely on the relationship between particle size and the direction and intensity of scattered light (20). They typically use a series of detectors to measure the intensity of light scattered by particles in a sample to yield a “diffraction pattern,” which is then used to determine size and distribution of the particles. These analyzers usually measure a size range of ∼0.5–2,000 µm. They typically rely on two assumptions: Particles are spherical and suspensions dilute (because rescattering arises if particle concentrations are high).
Polarization intensity differential scattering (PIDS) technology from Beckman Coulter (www.beckmancoulter.com) extends the detectability down to ∼40 nm. With this technique, a particle is sequentially illuminated by a vertically and horizontally polarized light source, and the differential of scattered light is measured over a range of angles with multiple wavelengths of light used to enhance information content. An outstanding benefit is the broad coverage (0.04–2,000 µm) of particle size from a single measurement (using PIDS along with traditional detectors) that allows probing of an otherwise inaccessible range of particles. Limitations of this technique include
a need for relatively large sample quantities (∼1–10 mg, depending on the sample and its submicron particle content)
concern over possible disassociation of reversible aggregates upon sample dilution in a dispersion medium, and
the influence of extraneous particles (such as dust) on PIDS measurements.
Raman spectroscopy is a valuable technique for identifying nonprotein particulates in aqueous parenteral dosage forms because water does not interfere in Raman measurements (21). Modern Raman spectrometers provide adequate sensitivity to quickly collect good-quality spectra, allowing higher throughput in assays. Automated characterization and identification of particulates (micron size and larger) by optical imaging coupled with Raman fingerprinting represents one application of this technology. A protein solution is filtered onto a gold-coated filter device to collect foreign and protein particulates, and Raman identification is conducted to understand their chemical identity and distribution.
Among the drawbacks of the Raman technique is the fact that intrinsic protein fluorescence can be problematic, especially with denatured proteins and their aggregates, which leads to higher background noise in measurements of protein formulations. This technique requires specialized instrumentation and training. Additionally, high particle content (e.g., protein precipitates) may cause inaccurate particle distribution results because of overlapping particles on the filter, so it may necessitate sample dilution before measurement can be performed.
New Separation Technologies for High-Throughput Analysis
Conventional methods for characterizing proteins are often labor intensive, and analytical testing requirements frequently become the bottleneck of a development project. This is especially true in areas such as fermentation and cell culture development (drug-substance production) and pharmaceutical development (drug-product formulation selection) that require high throughput. With the current influx of projects into the biotechnology pipeline, pharmaceutical companies have begun to address this bottleneck by exploring alternative instrumentation to realize higher throughput. Common approaches include miniaturization of a methodology to perform separations on a chip or in a microcolumn and/or performing multiple analyses in parallel rather than sequentially (22,23,24). In addition to providing higher throughput, such approaches also appear to provide sensitivity, resolution, and ruggedness comparable to existing high-performance liquid chromatography (HPLC) and electrophoresis methods. They decrease sample/solvent use, provide efficient heat transfer/dissipation, and can integrate multiple steps such as digestion, enrichment, separation, labeling, and detection.
High-Throughput Chromatography:Conventional HPLC has been a major work-horse in the pharmaceutical industry for many years and is routinely used for protein purification as well as for characterization and product-quality determinations. The main modes of HPLC applied to protein analytics include SEC, ion-exchange (IEX), reversed-phase (RP), and normal-phase (NP) chromatographies.
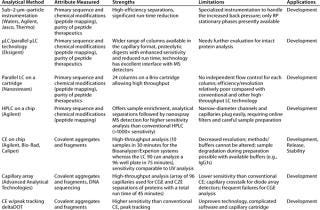
Over the past decade, many new technologies such as ultraperformance liquid chromatography (UPLC from Waters Corporation, www.waters.com) or other higher-pressure LC systems operating at up to 15,000 psi for particle sizes <2 µm), micro-LC, and microchip LC have been developed as the “next-generation” HPLC systems offering higher throughput while matching or improving on conventional LC performance. However, the stationary phases have thus far been limited to mainly RP mode, making new LC technologies primarily applicable to applications like peptide mapping and purity analyses of peptide therapeutics. For the technology to be more appropriate for intact protein analysis, additional phases in the new formats are needed to enable size and charge heterogeneity analysis. Table 3 briefly describes selected new technologies.
Table 3: Select high-throughput technologies based on chromatography and electrophoresis

Table 3: Se lect high-throughput technologies based on chromatography and electrophoresis ()
High-Throughput Electrophoresis: Capillary gel electrophoresis (CGE) a replacement for sodium-dodecyl sulfate polyacrylamide gel electrophoresis (SDS-PAGE), was developed as a higher throughput and semiautomated method with better quantitation for protein sizing applications by using online quantitative detection by UV (Coomassie Blue sensitivity) or higher sensitivity laser-induced fluorescence (LIF, silver stain sensitivity). This technique is often better than SDS-PAGE because it can separate many closely related size variants and provides enhanced precision.
Currently CGE offers limited throughput (when multiple samples need to be analyzed) because of longer run times and preconditioning requirements (30–40 minutes/sample). An additional disadvantage of this technology is that commercially available gel buffers have been designed to provide optimal resolution for disulfide-reduced MAb analysis. Presently the sizing range is 10–220 kDa (intact MAbs run closer to the upper end, around 200 kDa), with a sizing resolution of ∼10% MW, so resolution is not always optimal for large, intact proteins. CGE generally gives sufficient resolution to separate intact from aggregated proteins, although baseline instability with longer migration times restricts their accurate quantitation.
Microchip capillary electrophoresis (CE) is being examined as a replacement for conventional CE-based separations because of its potential for much higher throughput. The path length is so small that sensitive UV detection is not yet available for chip CE devices; detection instead involves fluorescent labels. DNA can be detected on chip by sensitive intercalating dyes, whereas detection of proteins is accomplished by fluorescent dyes that stain SDS micelles bound to the protein molecules (22, 25). A destaining step often is integrated after each separation but before a sample reaches the detector, which effectively dilutes free SDS micelles below the critical micellar concentration (CMC) to significantly reduce background noise. The effective separation length on a Bioanalyzer microchip from Agilent Technologies (www.chem.agilent.com) is ∼1.4 cm so its expected resolution is less than conventional CGE, which has a 20-cm effective separation length. In addition, sensitivity in this protein assay is slightly lower than has been achieved by CGE with UV detection.
Capillary-array technology has also become available, allowing size-based separations for protein samples in up to 96 capillaries simultaneously. Results generated thus far look promising, but potential drawbacks of this option include lower sensitivity than conventional CE, detector crosstalk among capillaries, and a higher than desired capillary failure rate. New detector technology allows for true sample multiplexing to achieve desired high throughputs. Briefly, sample tracking across an array of detectors allows peaks to be designated to a distinct injection, thus making it possible to inject several samples in a given run.
Our experience has been that new LC and CE technologies can be used for high-throughput biopharmaceutical analysis in bioprocess and formulation support groups. But they will require additional development of buffers and columns, improved system robustness, and a wider acceptance from both the industry and its regulating agencies before implementation in a QC environment is possible.
About the Author
Author Details
This review is based largely on presentations and discussions at the second BioProcess International Analytical and Quality Summit, which was presented in San Diego, CA, by IBC Life Sciences in June 2007.
REFERENCES
1.) Patten, PA, and H. Schellekens Brown, F and AR. 2003.The Immunogenicity of Biopharmaceuticals: Lessons Learned and Consequences for Protein Drug DevelopmentImmunogenicity of Therapeutic Biological Products, S. Karger AG, Basel:81-97.
2.) Philo, J. 2006. Is Any Measurement Method Optimal for All Aggregate Sizes and Types?. AAPS J. 8:E564-E571.
3.) Berkowitz, SA. 2006. Role of Analytical Ultracentrifugation in Assessing the Aggregation of Protein Biopharmaceuticals. AAPS J. 8:E590-E605.
4.) Shire, SJ, Z Shahrokh, and J. Liu. 2004. Challenges in the Development of High Protein Concentration Formulations. J. Pharm. Sci. 93:1390-1402.
5.) Liu, J. 2005. Reversible Self-Association Increases the Viscosity of a Concentrated Monoclonal Antibody in Aqueous Solution. J. Pharm. Sci. Erratum in J. Pharm. Sci. 95, 2006: 234–235 94:1928-1940.
6.) Brorson, K, and J. Phillips. 2005. Defining Your Product Profile and Maintaining Control Over It, Part 4: Product-Related Impurities: Tackling Aggregates. BioProcess Int. 3:50-54.
7.) Schenerman, M. 2004. CMC Strategy Forum Report: Analysis and Structure Characterization of Monoclonal Antibodies. BioProcess Int. 2:42-52.
8.) Stulik, K, V Pacakova, and M. Ticha. 2003. Some Potentialities and Drawbacks of Contemporary Size-Exclusion Chromatography. J. Biochem. Biophys. Meth. 56:1-13.
9.) Gabrielson, JP. 2007. Quantitation of Aggregate Levels in a Recombinant Humanized Monoclonal Antibody Formulation By Size-Exclusion Chromatography, Asymmetrical Flow Field Flow Fractionation, and Sedimentation Velocity. J. Pharm. Sci. 96:268-79.
10.) Labowitz, J, MS Lewis, and P. Schuck. 2002. Modern Analytical Ultracentrifugation in Protein Science: A Tutorial Review. Prot. Sci. 11:2067-2079.
11.) Pekar, A, and M. Sukumar. 2007. Quantitation of Aggregates in Therapeutic Proteins Using Sedimentation Velocity Analytical Ultracentrifugation: Practical Considerations That Impact Precision and Accuracy. Anal. Biochem. 367:225-237.
12.) Liu, J, JD Andya, and SJ. Shire. 2006. A Critical Review of Analytical Ultracentrifugation and Field Flow Fractionation Methods for Measuring Protein Aggregation. AAPS J. 8:E580-E589.
13.) Arakawa, T. 2007. Aggregation Analysis of Therapeutic Proteins, Part 2: Analytical Ultracentrifugation and Dynamic Light Scattering. BioProcess Int. 5:36-47.
14.) Ahrer, K. 2003. Analysis of Aggregates of Human Immunoglobulin G Using Size-Exclusion Chromatography, Static and Dynamic Light Scattering. J. Chromatogr. A 1009:89-96.
15.) Chi, EY. 2003. Physical Stability of Proteins in Aqueous Solution: Mechanism and Driving Forces in Nonnative Protein Aggregation. Pharm. Res. 20:1325-1336.
16.) Hsu, CC. 1995. Surface Denaturation at Solid–Void Interface: A Possible Pathway By Which Opalescent Particulates Form During the Storage of Lyophilized Tissue-Type Plasminogen Activator at High Temperatures. Pharm. Res. 12:69-77.
17.) Rosenberg, AS. 2006. Effects of Protein Aggregates: An Immunologic Perspective. AAPS J. 8:E501-507.
18.) ISO 13322-2 2006.Particle Size Analysis: Image Analysis Methods, Part 2 — Dynamic Image Analysis Methods, International Organization for Standardization, Geneva.
19.) Sharma, DK. 2007. Flow Microscopy for Particulate Analysis in Parenteral and Pharmaceutical Fluids. Eur. J. Parent. Pharm. Sci. 12:97-101.
20.) Etzler, FM. 2004. Particle Size Analysis: A Comparison of Methods. Am. Pharm. Rev. 7:104-108.
21.) Vankeirsbilck, T. 2002. Applications of Raman Spectroscopy in Pharmaceutical Analysis. Trends Anal. Chem.
21:869-877.
22.) Chow, AW. Henry, CS 2006.Protein SeparationsMicrochip Capillary Electrophoresis: Methods and Protocols, Humana Press, Totowa:145-158.
23.) Welch, C. 2007. Comparison of Multiparallel Microfluidic HPLC Instruments for High-throughput Analyses in Support of Pharmaceutical Process Research. J. Liq. Chromatogr. Rel. Tech. 29:2185-2200.
24.) Luo, S, J Feng, and H.-M Pang. 2004. High-Throughput Protein Analysis By Multiplexed Sodium Dodecyl Sulfate Gel Electrophoresis with UV Absorbance Detection. J. Chromatogr. A 1051:131-134.
25.) Yin, H, and K. Killeen. 2007. The Fundamental Aspects and Applications of Agilent HPLC-Chip. J. Sep. Sci. 30:1427-1434.
You May Also Like


