Rational Design of Liquid Protein Formulations: Application of Biophysical Stability Predictors and Descriptors to Reformulate BiotherapeuticsRational Design of Liquid Protein Formulations: Application of Biophysical Stability Predictors and Descriptors to Reformulate Biotherapeutics

ADOBE STOCK (HTTPS://STOCK.ADOBE.COM)
Successful development of liquid biopharmaceutical formulations requires careful assessment of the biophysical properties of the protein in solution, primarily focused on achieving optimal conformational and colloidal stability of the drug-substance molecule (1–11). It also involves extensive stability studies under stressed conditions. Using state-of-the-art biophysical tools for characterization of developed products, those studies are based on key biophysical descriptors and extended particulate characterization methods (subvisible particles in micro- and nano-size range) to deliver a stable product for market with a shelf life of about two years (12–15).
Because of potential immunogenic risk associated with the presence of proteinaceous particles, comprehensive particle characterization in macromolecular drug-product development has drawn greater attention from the biopharmaceutical industry and regulatory agencies around the globe (16–23). To help reduce development time and costs, biotherapeutics developers have begun integrating screening assays into the early development phase of their pipelines. The objective is to identify candidates and conditions that are most likely to present challenges in later phases of development and manufacturing: e.g., those exhibiting characteristics indicative of low developability and manufacturability (24–33).
Stability profiles often are used to define both the criteria and screening limits of acceptability for candidate macromolecules. The criteria and limits generally are company-specific (sometimes even product-specific), but a few formulation screening properties are found routinely within defined stability profile criteria: e.g., the diffusion interaction parameter (kD) as measured by dynamic light scattering (DLS), the second virial coefficient (B22) as measured by static light scattering (SLS), the effective protein charge (ZEff), and the melting and onset aggregation temperatures (TM and TOnset) (28–33).
In addition to providing stable drug products, companies often want to formulate certain biologics at high concentrations that would be suitable for patient self-administration using autoinjectors and other devices (34–36). Because of such high concentrations, viscosity limits for manufacturability and subcutaneous injection often will be found within company-defined screening criteria for formulation stability profiles (37–42). Aspects of manufacturability and processing bulk biopharmaceutical solutions using freeze–thaw processing methods also present some unique challenges.
Here we describe how reformulation of a biotherapeutic product was achieved rationally based on measured biophysical stability predictors and descriptors. Biophysical stability predictors were measured for both the initial product (referred to herein as “formulation A”) and reformulated product (referred to herein as “formulation B”). Predictors included TOnset and TM as measured by DSC and others (kD, B22 and ZEff) as measured by SLS, DLS, and electrophoretic light scattering (ELS).
Bioformulation-extended stability descriptors were characterized by
flow imaging analysis for subvisible particle count (data not shown) and morphology and nanoparticle tracking analysis (NTA) for submicron particle count — descriptors for potential immunogenic particles in the subvisible (2–100 µm) and submicron (0.1–2.0 µm) size ranges
microcapillary viscometry for relative viscosity — a key descriptor for injectability, drug delivery design space, and manufacturing or processing concentration limitations.
We focus herein exclusively on how the above-described key biophysical stability predictors and descriptors can be used for rational development and characterization of an alternate formulation with improved stability for a biotherapeutic.
Abbreviations Used |
|---|
η: viscosityB22: second virial coefficientDLS: dynamic light scatteringDm: mutual diffusion coefficientDSC: differential scanning calorimetryELS: electrophoretic light scatteringkD: diffusion interaction coefficientNTA: nanoparticle tracking analysisRH: hydrodynamic radiusSEC: size-exclusion chromatographySLS: static light scatteringTagg: aggregation temperatureTM: melting temperatureTOnset: onset temperatureZeff: effective protein charge |
Experimental
Biophysical stability predictors and descriptors were measured for both formulations (A and B). Protein solutions were prepared at different concentration levels using their respective formulation buffers (concentration range of 1–50 mg/mL). Except for the melting and aggregation temperature studies, we collected all measurements at 25 °C.

Equations
Light Scattering: For static, dynamic, and electrophoretic light scattering measurements, we used a Malvern Zetasizer Nano ZS system. It measured the intensity weighted particle-size distribution, the DLS interaction parameter (kD), the second virial coefficient (B22), the effective charge (ZEff), and the aggregation onset temperature (TOnset). To correct for restricted diffusion or viscosity effects on the DLS results, we used the sample’s viscosity (η) rather than that of the buffer in the Stokes-Einstein transform of the DLS measured mutual diffusion coefficient (Dm) to the hydrodynamic radius (RH): Equation 1, in which T is the temperature and k is the Boltzmann constant (43).
To quantify solution nonideality, we used the DLS interaction parameter and the SLS second virial coefficient, both of which are derived from the concentration dependence of the light-scattering results: Equation 2, where Do is the self-diffusion coefficient in the limit of infinite dilution and C is the sample concentration (37); and for small isotropically scattering macromolecules such as proteins, Equation 3, where K is the optical constant, Rθ is the scattered to incident light-intensity ratio, and Mw is the weight-average molecular weight (44). We calculated the effective protein charge from the ELS measured electrophoretic mobility (µE), the DLS-measured Stokes radius (RS = RH in the limit of infinite dilution), and the sample viscosity using Equation 4 (45).
DLS measurements were collected using disposable cuvettes and the instrument’s autooptimization function, which identifies the optimum laser power and measurement position to minimize multiple scattering and maximize sensitivity. Optimization is based on sampling intensity readings at different locations and power settings before starting the measurement. SLS measurements were collected using a quartz cuvette and a toluene Rayleigh ratio standard to calculate the Rayleigh ratio from the concentration-dependent scattering intensities. Before measurement, the toluene was double-filtered through 0.45-µm filters, and the buffers were filtered through 0.1-µm filters. ELS measurements were collected using the plug-injection technique to eliminate possible sample denaturation and aggregation at the electrodes during the electrophoresis measurement (46).
Viscometry: To determine the viscosity (η) of our protein samples, we used a Malvern Viscosizer instrument operating at a 280-nm wavelength and 1,500-mbar run pressure. The automated microcapillary viscometer uses a dual-pass UV detector in which a capillary passes through the detector twice to facilitate an unambiguous measurement of the time required (Δt) for a sample to travel a known distance along the capillary at a known and constant applied pressure. The relative viscosity (ηRel) of a sample is determined by comparing its Δt with that of the formulation buffer (Equation 5), where the absolute viscosity is then defined as the product of the relative sample viscosity and the buffer viscosity (ηBuffer) as in Equation 6 (47).
Nanoparticle Tracking Analysis: To measure the submicron particle count for both formulations, we used NTA with a Malvern NanoSight system. This technology tracks the time-dependent positions of scattering centers in a video format. The particle size for each scattering center then is determined from the time-dependent positional displacement using Equation 7, the two-dimensional (2D) Stokes-Einstein equation. Because the scattering centers are individually tracked, the particle-size distribution derived from an NTA measurement is a true number distribution providing both the number of particles of each size bin and the total concentration of particles within a formulation (48).
Thermal Transitions: To obtain differential scanning calorimetry (DSC) thermograms, we used a Malvern MicroCal VP-capillary DSC system. Samples were diluted to 0.5 mg/mL using matching formulation buffer as a reference and then incubated at 25 °C for 15 minutes before measurement. We subtracted a matching formulation buffer blank from each sample. The sample scan rate was 60 °C/h across a range of 25–95 °C, with the melting temperature (TM) defined as the midpoint of the heat capacity transition. The filtering period was eight seconds, and the active cell volume was 130 µL. Data were analyzed by MicroCal VP-Capillary DSC automated analysis using Origin 7.0 software.
We determined the aggregation onset temperature (TOnset) by temperature ramping using the Zetasizer Nano ZS system. First, protein samples (50 mg/mL) were incubated at 50 °C for 15 minutes. Then the temperature ramp consisted of 1 °C temperature steps with one-minute equilibrium times across a temperature range of 50–90 °C. Aggregation temperature (Tagg) was identified by the instrument software based on a multiproperty analysis algorithm, with monitored formulation properties including the rate of scattering-intensity change, the volume-distribution mean, and the intensity-distribution mean.
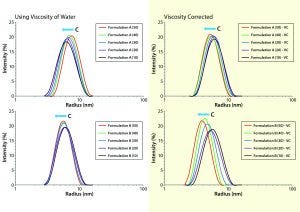
Figure 1: Comparing viscosity-corrected (VC) with uncorrected DLS size distributions for formulations A and B, with uncorrected results using the viscosity of water for all concentrations and restricted diffusion-corrected results using the actual sample viscosity measured by the Viscosizer instrument
Results and Discussion
Dynamic Light-Scattering Analysis: In DLS, scattering intensity fluctuations are correlated across microsecond time scales and used to extract the distribution of particle-diffusion coefficients within a formulation. The particle-size distribution across a practical working range of 1 nm to 1 µm is calculated from a measured distribution of diffusion coefficients using the familiar Stokes-Einstein equation. DLS is a low-resolution technique, however, requiring a 3× difference in size for baseline resolution. However, the method provides an intensity-weighted result. Given that the intensity varies with RH, DLS is extremely sensitive to subtle changes in size distribution even within the typically unresolvable oligomeric size region. Figure 1 shows DLS size trends for our two MAbs at different concentrations.
When we interpret DLS results from nondilute protein formulations, we should consider three concentration effects: restricted diffusion, electrostatic repulsion, and reversible self-association. The first is an excluded volume type of effect wherein the presence of other macromolecules under nondilute conditions restricts free diffusion through the solution. Restricted-diffusion effects are manifest as increases in the frictional drag on a macromolecule, that being quantified by the solution’s viscosity. When viscosity is constant across all concentrations, DLS results exhibiting restricted diffusion effects will demonstrate a shift in the distribution toward larger particle sizes. The peak shape will show no significant change with increasing sample concentration. Fortunately, restricted diffusion effects can be corrected easily based on the formulation viscosity (rather than that of the dispersant) in the Stokes-Einstein equation (Figure 1).
Viscosity-corrected distributions for formulations A and B show a noticeable shift toward smaller particle sizes with increasing solution concentration but no significant change in peak shape or width. Such behavior indicates the second concentration effect in the three listed above. Electrostatic-repulsion effects in DLS results are a physical manifestation of an increase in the electrostatic force between neighboring macromolecules as their average separation distance decreases at higher concentrations. When that force increases, so too does diffusion speed, which translates into an apparently smaller size on application of the Stokes-Einstein equation. Note that the increased diffusion is real, whereas the size change is apparent only based on the assumption of solution ideality in the Stokes-Einstein derivation. These DLS trends suggest a measurable degree of electrostatic repulsion in both formulations A and B, with those repulsive effects being much more significant for formulation B.

Figure 2: Concentration-dependent DLS size and polydispersity (Pd) trends, both uncorrected (left) and viscosity-corrected (right) for protein samples A (original) and B (reformulated)
The restricted-diffusion and electrostatic-repulsion effects observed in DLS-measured particle-size distributions in Figure 1 generally are better visualized using concentration-dependent size trends. Figure 2 shows those for formulation A and B samples. The left panel shows the uncorrected mean size of the unresolved oligomeric peak in the DLS particle-size distribution. Note that as concentration increases, the two samples exhibit different trends: formulation A showing an increase in size and formulation B showing a decrease in size. Note also the curvature in the concentration trend, which indicates a likely presence of multiple high-concentration effects and is a source of frustration for new DLS users.
Extrapolation to zero concentration using a polynomial fit suggests that formulation B would have the larger average size and hence a higher degree of oligomerization in the limit of infinite dilution. That prediction is inconsistent with the DLS-measured distributions at low concentration, however. The inset indicates a larger polydispersity and mean size for formulation A. Such inconsistency vanishes, however, in the right panel, which shows a linear concentration dependence in the results after viscosity correction for restricted diffusion effects. Both samples show the characteristic apparent decrease in size with increasing concentration that indicates electrostatic repulsion effects. As noted in Figure 2 (right), formulation A shows a larger Z average size for the unresolved oligomeric distribution at low concentration, suggesting that formulation B has a smaller degree of oligomerization and a higher percentage of monomeric protein.
The DLS interaction parameter (kD) is derived from the concentration dependence of a measured diffusion coefficient, providing a measure of solution nonideality. A strong correlation between kD and formulation stability descriptors such as aggregation rate and high concentration viscosity has been observed (7). So this parameter often gets integrated into stability profiles for biotherapeutic screening criteria, with large positive kD values indicating high formulation stability and negative values indicating formulation instability. The DLS interaction parameter is defined by Equation 8, where kf is the first-order concentration coefficient of the frictional coefficient and νsp is the partial specific volume (49).
As Equation 8 shows, kD has two components, one electrostatic and one hydrodynamic. Embodied within the electrostatic component are the second virial coefficient (B22) and molecular weight. So that component represents the magnitude of the electrostatic repulsive forces between charged particles in a formulation, with strong electrostatic repulsion generally translating to positive B22 values. The hydrodynamic component of kD quantifies the size-dependent attenuation of the diffusion coefficient, with νsp representing the particle volume and kf being a component of frictional drag on each particle. For formulations exhibiting strong electrostatic repulsion, Equation 8 suggests that kD would be positive. For those exhibiting reversible self-association or attractive interactions, the hydrodynamic component of kD would dominate, with Equation 8 suggesting a negative kD value.
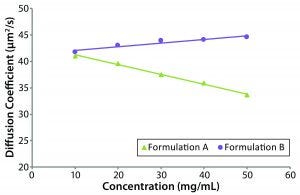
Figure 3: Dynamic Debye plots for the original formulation A and reformulated formulation B formulations with only the reformulated sample exhibiting a positive DLS interaction value
Figure 3 shows dynamic Debye plots for the two protein samples, with kD values derived from the slope and intercept of each line. Only the reformulated formulation B sample exhibits a positive kD value. With reference to the size and polydispersity trends discussed above, viscosity-corrected results for both formulations A and B suggested the presence of electrostatic repulsion effects. The negative kD value for formulation A, though, indicates that the hydrodynamic component of kD is greater than the electrostatic repulsion component. Because of the contribution and influence of the hydrodynamic component under near theta conditions (B22 ~ 0), kD can be negative, even when B22 is positive. The kD values for formulations A and B were –4.20, and +1.67 mL/g, respectively. Again, that suggests that the reformulated formulation B formulation would be more stable against aggregation and viscosity increases than the original formulation A formulation.
Static Light-Scattering Analysis: In SLS, the magnitude of sample-scattering intensity is monitored as a function of sample concentration, providing the average molecular weight and B22. The latter represents interactions or chemical potential between neighboring particles under nonideal solution conditions. Researchers have observed a strong correlation between B22 and formulation stability descriptors such as solubility, aggregation rate, and high concentration viscosity. So like kD, B22 often gets integrated into stability profiles for biotherapeutic screening criteria, with large positive B22 values predicting high formulation stability and negative values predicting instability (32, 44).

Figure 4: Debye plots for the original formulation A and reformulated formulation B samples measured at 25 °C with an estimated dn/dC of 0.175 mL/g
As suggested from the Rayleigh expression (Equation 3), B22 is extracted from the slope of a linear fit of the concentration dependence of KC/Rθ, where Rθ is proportional to the inverse of the scattering intensity. A Debye plot graphically displays the Rayleigh equation. Figure 4(left) shows Debye plots for the original formulation A and reformulated formulation B formulations. Figure 4(right) shows the concentration dependence of the residual (analyte) scattering intensity, with linearity indicating the absence of higher order virial effects (e.g., B23) B22 values derived from the Debye plots in Figure 4 were 0.244 and 0.634 × 10⁴ mol/mL/g2 for the formulation A and B samples respectively, suggesting a greater degree of solvation — and hence solubility — for the reformulated formulation.
Electrophoretic Light-Scattering Analysis: With application of an electric field, charged particles in a formulation will migrate toward the pole of opposite charge. Light scattered from those electrophoresing particles will exhibit a Doppler shift in frequency. In ELS, the Doppler shift of electrophoresing macromolecules is measured and used to calculate electrophoretic mobility, defined as the frequency shift per unit field strength. Then the effective particle charge is calculated from electrophoretic mobility and the DLS-measured Stokes radius (Equation 4).
Average electrophoretic mobility values for the original formulation A and reformulated formulation B samples were +0.145 and +0.175 µm/cm/V/s, respectively. Based on Equation 4 along with the Stokes radii and viscosity values, electrophoretic mobility values translate to effective charges of +0.95 and +1.17 for formulation A and B, respectively. As with the other stability-predicting parameters, the effective charge indicates that the formulation B should be the more stable formulation.
Although the net-effective charge is a good predictor of colloidal stability under moderate to low concentrations, attractive dipole–dipole interactions at higher concentrations can exceed repulsive net-charge interactions, leading to formulation instability even under conditions in which stability predictors suggest otherwise. With biotherapeutics, attractive dipole–dipole interactions often manifest as sharp increases in viscosity, with the dipoles leading to macromolecular alignment and loose matrix formation (50). As a consequence of dipole effects, biotherapeutic stability profiles often include a viscosity screening assay.
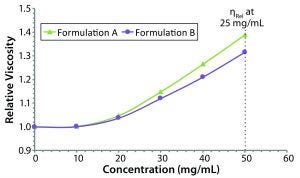
Figure 5: Concentration dependence of relative viscosity for the original formulation A and reformulated formulation B formulations; dashed line indicates the target concentration (50 mg/mL) for subcutaneous administration.
Figure 5 shows measured relative viscosities at different concentration levels for both the original and reformulated formulations. The formulation B sample shows a smaller increase in viscosity with increasing sample concentration, suggesting that it would be the best with regard to manufacturability and subcutaneous injection at high sample concentration, particularly with autoinjector delivery. From the stability profile, the concentration chosen for viscosity comparisons is 50 mg/mL, which is the intended dose for subcutaneous administration. At that concentration, the relative viscosities of the original and reformulated formulations are 1.3890 and 1.3144, respectively. Note here that the viscosities of the respective formulation buffers (placebo or blank buffer) also were measured using the same microcapillary viscometry technique as for the samples, but with pure water as a reference. The absolute viscosities measured for the formulation A and B formulation buffers were 0.9196 and 0.9632 cP, respectively.
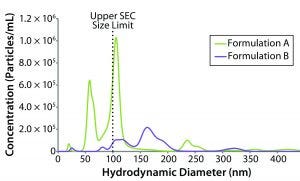
Figure 6: NTA-derived number weighted particle-size distributions for formulations A and B (dashed line represents upper size limit for SEC measurements)
Stability Test Results: NTA uses time-dependent imaging technology to measure both hydrodynamic size and particle count/concentration in bioformulations. Given the mounting evidence that submicron and subvisible particles (SµPs, SVPs) can increase immunogenic risk, the SµP count gets included often in biotherapeutic stability profiles. Figure 6 shows number-weighted NTA-derived particle-size distributions for the original formulation A and reformulated formulation B samples.
The lower sizing limit for NTA measurements of proteinaceous material is about 40-nm diameter, which excludes a significant portion of the oligomeric size range defined as 1–100 nm. That lower limit is dictated by a number of sample properties, primarily the scattering contrast between particles and the formulation background. Unfortunately, there is no absolute lower size cutoff but rather a gradual loss of sensitivity as the particle–background contrast diminishes. An arbitrary lower size limit can be defined for stability profile screening, with the screening criteria defined as the number of particles that are larger than the defined lower size limit. Given that size-exclusion chromatography (SEC) is the industry standard for quantifying the mass composition within an oligomeric size region, we defined our lower NTA size cutoff as 100 nm, which is the generally accepted upper SEC size limit.

Figure 7A: Protein-like particles found in formulation A (FlowCAM methodology captures high-resolution images and sorts particles based on observed morphology). No chemical-identity information is available to verify their protein-like appearance.
For the original and reformulated samples, the particle concentrations with sizes greater than 100-nm diameter (C > 100 nm) were 1.90 × 10⁷ and 1.27 × 10⁷ particles/mL, respectively. The total particle concentrations (C > ~40 nm), were 3.52 × 10⁷ for formulation A and 1.39 × 10⁷ for formulation B. From the perspective of submicron particle count then, the reformulated formulation appears to be more stable than the original sample with regard to aggregation, which is consistent with the light-scattering stability predictors (e.g., kD, B22, and ZEff).
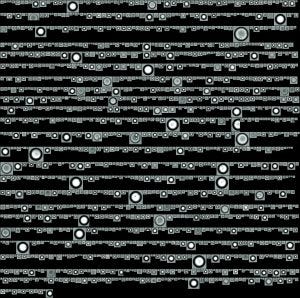
Figure 7B: Silicone oil droplet particles (spherical) sorted and found in formulations A and B; they come from the prefilled syringe used to fill the final product.
Additional studies were performed for better understanding of SVP profiles for both formulations in the range of 2–100 µm using fluid imaging methodology. Samples of both formulation A and formulation B formulations were tested with a FlowCAM instrument (Fluid Imaging Technologies, Inc.) to evaluate the SVPs present in the samples. Because the products were filled in siliconized syringes, spherical particles that appeared like silicone oil were selected and separated into data sets. Particles with ill-defined morphology that appeared protein-like were sorted as in Figures 7A and 7B. Based on those findings, the formulation A product had an inferior SVP profile, with several protein-like particles.
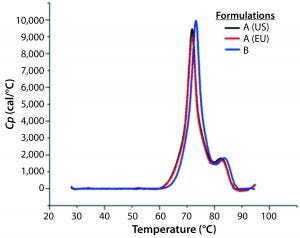
Figure 8: DSC profiles for the original formulation A (US and EU sourced) and reformulated formulation B products with a scan rate of 60 °C/h
A globular protein in solution remains in equilibrium between its native and denatured conformations. Upon heating, the protein undergoes a conformational change commonly referred to as unfolding or heat-induced denaturation. Generally the thermal-transition or melting point (TM) is measured as the midpoint of that thermal transition. Differential scanning calorimetry (DSC) monitors the enthalpy (ΔH) of unfolding and is commonly used to measure protein melting points. Figure 8 shows DSC scans for the original formulation A product from two sources (US and EU regions) as well as the reformulated formulation B sample, with the former melting at 69 °C and the latter melting at 72 °C.
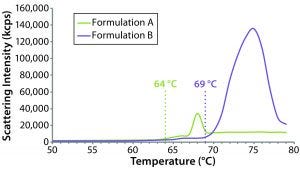
Figure 9: Thermal ramp results for the original formulation A and reformulated formulation B samples, showing aggregation onset temperatures measured using a Zetasizer Nano ZS system
The sensitivity of DLS to subtle changes in particle-size distribution makes it well suited for monitoring changes in bioformulations during temperature stress testing. Although it cannot distinguish readily between intraparticle structural/conformation changes and interparticle aggregation, DLS can be used to identify the temperature at which those changes happen. Figure 9 compares DLS temperature ramps for the original and reformulated products. For formulations A and B, the reported aggregation onset temperatures were 64 °C and 69 °C, respectively, which are consistent with the DSC results, suggesting that the reformulated product would be more resistant to temperature-induced changes.
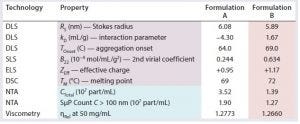
Table 1: Stability profiles for samples of formulations A and B
Table 1 lists stability profiles for formulation A and formulation B products. Blue highlighting indicates stability descriptors; purple highlighting designates common stability predictors. Pink highlights the best comparative values between the two formulations. Note that all stability predictors (RS, kD, TOnset, B22, ZEff, and TM) suggest that the reformulation would exhibit greater stability than the original formulation. Those predictions are confirmed by the stability descriptors (CTotal, SµP count, and ηRel). Correlation between the predictors and descriptors is not surprising: Numerous studies have confirmed the correlations of those predictors with aggregation rates, solubility, and viscosity increases. Although correlation between stability predictors and SµP generation has yet to be explored, our results here suggest that such a correlation does exist.
Note also the relatively low effective charge for both formulations. Typical effective charge values for therapeutic formulations at pH 6 tend to range between +5 and +10 charge units. So even considering differences in pI and variable region composition, an effective charge of +1 at pH of about 6.0 would be considered low. With that said, both formulations contained surfactant as a stabilizer. Steric stabilizers such as low–molecular-weight polyethylene glycols (PEGs) and polysaccharides and even some surfactants can add a degree of complexity to the stability profiles of bioformulations. As the steric stabilizer adsorbs (or is attached, as is common with PEGs) to the surface of a protein, appendages extend into the surrounding medium, which increases the effective volume of the protein/stabilizer complex. From the standpoint of effective charge, that effective volume expansion moves the slipping plane or hydrodynamic boundary away from the charged protein surface. Since the net-charge potential decays with 1/r2 (where r is the distance), the addition of steric stabilization would be expected to decrease the effective charge measured at the hydrodynamic boundary, which seems to be what is observed with the two protein samples we evaluated.
A Rational Solution
An alternative formulation composition (formulation B) was successfully developed using the biophysical descriptors and biophysical stability predictors as described herein. Such an approach might be necessary for some biotherapeutics in development and could be recommended depending upon several factors.
For developability assessments of novel biotherapeutics, it could generate comprehensive biophysical properties profiles for early stage candidates during discovery and early development of novel biotherapeutics. Development of a formulation composition using (or excluding) certain excipients might be made necessary by the intellectual property landscape.
Improved stability profiles (e.g., longer shelf lives, storage at room temperatures, and changing from lyophilized to liquid formulations) offer one strategy for life-cycle management of legacy biotherapeutic products. Product differentiation also can come with design of an improved delivery system, a high-concentration dose compatible with autoinjector devices, and so on. Finally, these techniques can apply to extended drug-product characterization in similarity and comparability applications for biotherapeutics.
Acknowledgments
We are thankful to Scott Gangloff (senior vice president of development and manufacturing at Oncobiologics Inc.) for careful review of and suggestions for this article.
References
1 Chi EY, et al. Roles of Conformational Stability and Colloidal Stability in the Aggregation of Recombinant Human Granulocyte Colony-Stimulating Factor. Protein Sci. 12(5) 2003: 903–913; doi:10.1110/ps.0235703.
2 Valente JJ, et al. Colloidal Behavior of Proteins: Effects of the Second Virial Coefficient on Solubility, Crystallization and Aggregation of Proteins in Aqueous Solution. Curr. Pharm. Biotechnol. 6(6) 2005: 427–436.
3 Garidel P, Blume A, Wagner M. Prediction of Colloidal Stability of High Concentration Protein Formulations. Pharm. Dev. Technol. 20(3) 2015: 367–374; doi:10.3109/10837450.2013.871032.
4 Saito S, et al. Effects of Ionic Strength and Sugars on the Aggregation Propensity of Monoclonal Antibodies: Influence of Colloidal and Conformational Stabilities. Pharm. Res. 30(5) 2013: 1263–1280; doi:10.1007/s11095-012-0965-4.
5 Chou DK, et al. Physical Stability of Albinterferon-α (2b) in Aqueous Solution: Effects of Conformational Stability and Colloidal Stability on Aggregation. J. Pharm. Sci. 101(8) 2012: 2702–2719; doi:10.1002/jps.23215.
6 Bhambhani A, et al. Formulation Design and High-Throughput Excipient Selection Based on Structural Integrity and Conformational Stability of Dilute and Highly Concentrated IgG1 Monoclonal Antibody Solutions. J. Pharm. Sci. 101(3) 2012: 1120–1135; doi:10.1002/jps.23008.
7 Goldberg DS, et al. Formulation Development of Therapeutic Monoclonal Antibodies Using High-Throughput Fluorescence and Static Light Scattering Techniques: Role of Conformational and Colloidal Stability. J. Pharm. Sci. 100(4) 2011: 1306–1315; doi:10.1002/jps.22371.
8 Fast JL, et al. Physical Instability of a Therapeutic Fc Fusion Protein: Domain Contributions to Conformational and Colloidal Stability. Biochemistry 48(49) 2009: 11724–11736; doi:10.1021/bi900853v.
9 Roque C, et al. Effect of Polyethylene Glycol Conjugation on Conformational and Colloidal Stability of a Monoclonal Antibody Antigen-Binding Fragment. Mol. Pharm. 12(2) 2015: 562–575; doi:10.1021/mp500658w.
10 Wen L, et al. Preferential Interactions Between Formulation And Arginine: Effects of Arginine on Tertiary Conformational and Colloidal Stability of Protein Solution. Int. J. Pharm. 478(2) 2015: 753–761; doi:10.1016/j.ijpharm.2014.12.038.
11 Kalonia C, et al. Effects of Protein Conformation, Apparent Solubility, and Protein–Protein Interactions on the Rates and Mechanisms of Aggregation for an IgG1 Monoclonal Antibody. J. Phys. Chem. B 120(29) 2016: 7062–7075; doi:10.1021/acs.jpcb.6b03878.
12 Neergaard MS, et al. Stability of Monoclonal Antibodies at High-Concentration: Head-to-Head Comparison of the IgG1 and IgG4 Subclass. J. Pharm. Sci. 103(1) 2014: 115–127; doi:10.1002/jps.23788.
13 He F, et al. High Throughput Thermostability Screening of Monoclonal Antibody Formulations. J. Pharm. Sci. 99(4) 2010: 1707–1720; doi:10.1002/jps.21955.
14 He F, et al. High-Throughput Assessment of Thermal and Colloidal Stability Parameters for Monoclonal Antibody Formulations. J. Pharm. Sci. 100(12) 2011: 5126–5141; doi:10.1002/jps.22712.
15 Razinkov VI, Treuheit MJ, Becker GW. Accelerated Formulation Development of Monoclonal Antibodies (MAbs) and MAb-Based Modalities: Review of Methods and Tools. J. Biomol. Screen. 20(4) 2015: 468–483.
16 CBER/CDER. Guidance for Industry: Immunogenicity Assessment for Therapeutic Protein Products. US Food and Drug Administration: Rockville, MD, August 2014.
17 Singh SK, et al. An Industry Perspective on the Monitoring of Subvisible Particles As a Quality Attribute for Protein Therapeutics. J. Pharm. Sci. 99(8) 2010: 3302– 3321; doi:10.1002/jps.22097.
18 Narhi LO, et al. Subvisible (2–100 µm) Particle Analysis During Biotherapeutic Drug Product Development: Part 1, Considerations and Strategy. J. Pharm. Sci. 104(6) 2015: 1899–1908; doi:10.1002/jps.24437.
19 Corvari V, et al. Subvisible (2–100 µm) Particle Analysis During Biotherapeutic Drug Product Development: Part 2, Experience with the Application of Subvisible Particle Analysis. Biologicals 43(6) 2015: 457–473; doi:10.1016/j.biologicals.2015.07.011.
20 Zölls S, et al. Particles in Therapeutic Protein Formulations, Part 1: Overview of Analytical Methods. J. Pharm. Sci. 101(3) 2012: 914–935; doi:10.1002/jps.23001.
21 Zhou C, et al. Characterization of Nanoparticle Tracking Analysis for Quantification and Sizing of Submicron Particles of Therapeutic Proteins. J. Pharm. Sci. 104(8) 2015: 2441–2450; doi:10.1002/jps.24510.
22 Ríos Quiroz A, et al. Factors Governing the Precision of Subvisible Particle Measurement Methods: A Case Study with a Low-Concentration Therapeutic Protein Product in a Prefilled Syringe. Pharm. Res. 33(2) 2016: 450–461; doi:10.1007/s11095-015-1801-4.
23 Ríos Quiroz A, et al. Factors Governing the Accuracy of Subvisible Particle Counting Methods. J. Pharm. Sci. 105(7) 2016: 2042–2052; doi:10.1016/j.xphs.2016.03.044.
24 Lavoisier A, Schlaeppi JM. Early Developability Screen of Therapeutic Antibody Candidates Using Taylor Dispersion Analysis and UV Area Imaging Detection. MAbs 7(1) 2015: 77–83; doi:10.4161/19420862.2014.985544.
25 Geng SB, et al. Improving Monoclonal Antibody Selection and Engineering Using Measurements of Colloidal Protein Interactions. J. Pharm. Sci. 103(11) 2014: 3356–3363; doi:10.1002/jps.24130.
26 Thiagarajan G, et al. A Comparison of Biophysical Characterization Techniques in Predicting Monoclonal Antibody Stability. MAbs 8(6) 2016:1088–1097; doi:10.1080/19420862.2016.1189048.
27 Samra HS, He F. Advancements in High Throughput Biophysical Technologies: Applications for Characterization and Screening During Early Formulation Development of Monoclonal Antibodies. Mol. Pharm. 9(4) 2012: 696–707; doi:10.1021/mp200404c.
28 He F, et al. Detection of IgG Aggregation By a High Throughput Method Based on Extrinsic Fluorescence. J. Pharm. Sci. 99(6) 2010: 2598–2608; doi:10.1002/jps.22036.
29 He F, et al. Screening of Monoclonal Antibody Formulations Based on High-Throughput Thermostability and Viscosity Measurements: Design of Experiment and Statistical Analysis. J. Pharm. Sci. 100(4) 2011: 1330–1340; doi:10.1002/jps.22384.
30 Razinkov VI, Treuheit MJ, Becker GW. Methods of High Throughput Biophysical Characterization in Biopharmaceutical Development. Curr. Drug Discov. Technol. 10(1) 2013: 59–70.
31 Saluja A, et al. Diffusion and Sedimentation Interaction Parameters for Measuring the Second Virial Coefficient and Their Utility As Predictors of formulation Aggregation. Biophys. J. 99(8) 2010: 2657–2665; doi:10.1016/j.bpj.2010.08.020.
32 Connolly BD, et al. Weak Interactions Govern the Viscosity of Concentrated Antibody Solutions: High-Throughput Analysis Using the Diffusion Interaction Parameter. Biophys. J. 103(1) 2012: 69–78; doi:10.1016/j.bpj.2012.04.047.
33 Siew A. Drug Delivery Systems for Biopharmaceuticals. BioPharm Int. 28, (8) 2015: 14–19.
34 Fry A. Injecting Highly Viscous Drugs. Pharm. Technol. 38(11) 2014.
35 Shire SJ, Shahrokh Z, Liu J. Challenges in the Development of High Protein Concentration Formulations. J. Pharm. Sci. 93(6) 2004: 1390–1402; doi:10.1002/jps.20079.
36 Yadav S, Shire SJ, Kalonia DS. Factors Affecting the Viscosity in High Concentration Solutions of Different Monoclonal Antibodies. J. Pharm. Sci. 99(12) 2010: 4812–4829; doi:10.1002/jps.22190.
37 Lilyestrom WG, et al. Monoclonal Antibody Self-Association, Cluster Formation, and Rheology at High Concentrations. J. Phys. Chem. B 117(21) 2013: 6373–6384; doi:10.1021/jp4008152.
38 Yadav S, Shire SJ, Kalonia DS. Viscosity Behavior of High-Concentration Monoclonal Antibody Solutions: Correlation with Interaction Parameter and Electroviscous Effects. J. Pharm Sci. 101(3) 2012: 998–1011; doi:10.1002/jps.22831.
39 Scherer TM, et al. Intermolecular Interactions of IgG1 Monoclonal Antibodies at High Concentrations Characterized By Light Scattering. J. Phys. Chem. B 114(40) 2010: 12948–12957; doi:10.1021/jp1028646.
40 He F, et al. High-Throughput Dynamic Light Scattering Method for Measuring Viscosity of Concentrated Protein Solutions. Anal. Biochem. 399(1) 2010: 141–143; doi:10.1016/j.ab.2009.12.003.
41 Yadav S, et al. Establishing a Link Between Amino Acid Sequences and Self-Associating and Viscoelastic Behavior of Two Closely Related Monoclonal Antibodies. Pharm. Res. 28(7) 2011: 1750–1764; doi:10.1007/s11095-011-0410-0.
42 Sun, DeLuca, Mattison. Size and Rheology Characterization of Concentrated Emulsions. Amer. Lab. 37(13) 2005: 8.
43 Guo B, et al. Correlation of Second Virial Coefficients and Solubilities Useful in Protein Crystal Growth. J. Crystal Growth 196(2–4) 1999: 424–433; doi:10.1021/bp0001314.
44 Chase SF, Laue TM. The Determination of Protein Valence By Capillary Electrophoresis. PACESetter 12(1) 2008: 1–5.
45 Corbett JC, Connah MT, Mattison K. Advances in the Measurement of Protein Mobility Using Laser Doppler Electrophoresis: The Diffusion Barrier Technique. Electrophores. 32(14) 2011: 1787–1794; doi:10.1002/elps.201100108.
46 Bergman M, Claessens HA, Cramers C. Properties of Entangled Polymer Solutions in High-Performance Capillary Electrophoresis. J. Microcol. Separat. 10(1) 1998: 19–26; doi:10.1002/(SICI)1520-667X(1998)10:1<19::AID-MCS3>3.0.CO;2-1.
47 Filipe V, Hawe A, Jiskoot W. Critical Evaluation of Nanoparticle Tracking Analysis (NTA) By NanoSight for the Measurement of Nanoparticles and Formulation Aggregates. Pharm. Res. 27(5) 2010: 796–810.
48 Harding SE, Johnson P. The Concentration Dependence of Macromolecular Parameters. Biochem. J. 231, 1985: 543–547.
Kevin Mattison, PhD, is principal scientist ([email protected]), and Jonathan Mehtala is field application scientist in the biosciences group at Malvern Panalytical Inc. in Westborough, MA. Maria Taddei is a senior scientist II (now at Adello Biologics in Piscataway, NJ); Jessica Cheung is a scientist II (now at Celgene in Summit, NJ); and corresponding author Hiten Gutka, PhD, is a principal scientist in formulation development at Oncobiologics Inc. in Cranbury, NJ; [email protected].
You May Also Like


