Analytics for Modern Bioprocess DevelopmentAnalytics for Modern Bioprocess Development
March 1, 2014
 Twelve years ago, about the same time the US Food and Drug Administration was putting the finishing touches on its quality by design (QbD) and process analytical technology (PAT) guidelines, I wrote an article about breakthrough pharmaceutical educational programs. That article included the perspectives from a few members in academia of the future essential skills for pharmaceutical students. At the time, bioinformatics and computerized industrial process modeling were relatively new disciplines, but their importance in future manufacturing was clear. Several educators agreed that problem solving, communication, and mathematics were invaluable. One of my favorite quotes came from James Pierce, PhD, then director of undergraduate studies at the University of the Sciences in Philadelphia. He said, “It doesn’t really matter what field you are studying… you’re going to have to be skilled in your ability to manipulate databases, to use computers to study problems, and to analyze data.”
Today QbD and PAT are well-known principles. Reports have established that implementating those principles can lower cost of goods through supply-chain reliability and predictability. In turn, that can lead to real cost savings (1). Advancements in bioindustry data acquisition methods, powerful computerized systems, and high-precision analytical instrumentation have indeed created the need for better process informatics. Manufacturers want real-time windows into critical operations. And ultimately, they seek connections between process knowledge and product quality.
Data Driven
Like most other industries growing within the rapidly changing information era, the bioindustry is generating more data than it ever has before. But meaningful information — that which can be linked to process knowledge and, ultimately, process control — is useful only with a robust and efficient data acquisition system. As Gernot John (director of marketing and innovation at PreSens) observes, the underlying factors supporting improved data acquisition in the industry include an increased interest in switching from offline to online measurements, scalability (miniaturization) of analytical instrumentation, and the ongoing change from analog to digital signal transmission.
“Determining the type of process data you need to evaluate — whether it’s quality data, discrete, or online measurements, and/or batch-record data — begins by asking ‘What are we trying to achieve?’” notes Justin Neway, PhD (general manager, operations intelligence and senior fellow, Accelerys Science Council, at Accelrys). He identifies at least four drivers in the need for process informatics. The first is a need to reduce process variability by improving process understanding (which is the touchstone of PAT and QbD), implementing robust design processes, and using online instrumentation. “When QbD came out, it started to sound a bit more pragmatic than PAT. Then the industry started to see the connection between it and PAT, and the industry began actually producing useful outcomes. Now, with the aim of process robustness, it becomes much more business oriented,” says Neway. He points out that a robust process reduces business risk by decreasing supply chain risk. It also can improve profitability and decrease patient safety issues and risks of 483s and FDA warning letters.
Another driver for process informatics is the need for transparency in outsourcing relationships. “That’s not just about cost. It’s about companies specializing in their core area,” says Neway. Much of the renewed emphasis on contract relationships stems from a 2013 FDA draft guidance on quality agreements (2) “The phrase I love in that document is that the FDA considers contractors ‘an extension of the manufacturer’s own facility’” says Neway. With that statement, the agency solidifies the union between sponsor company and contract organization — they are one in the same.
A third driver is the bioindustry’s need for collaboration. Certainly that applies to the partnership between a sponsor company and a contractor, but it holds true for internal collaborations as well. Those types of collaborations can be tough for two reasons, says Neway. “First: You need process development (where the process is designed and scaled up) to collaborate with quality (which takes the responsibility for minimizing risks to patients) and manufacturing (where the process is operated repeatedly at commercial scale and needs support from those who designed it). Second: You need to have those collaborations on a global scale. Email is not enough — you need an environment where people can dive in and work on the same data regardless of time zone, department, even what company logo they’re working under. That is one of the big drivers for process informatics”
The last is the bioindustry’s need for knowledge capture, transfer, and management. Experienced professionals are retiring from the industry, taking with them the process knowledge and expertise that much new hires still needs to embody. “That means knowledge needs to transfer from more-experienced people to less-experienced people as efficiently as possible,” says Neway. This last point is especially important for connecting the operations data and measurements data between, for example, quality laboratories working with laboratory information system (LIMS) and process batch-scale operations working with batch record systems and data historians. People tend to act in silos. “Their LIMS system is organized to identify and manage samples, test protocols, operators, standards, and provide reports of all the results of all the samples. It was not built with an organization that reflects the production process.”
That last point is important because it revolves around the distinction between data that are organized around instrumentation and data that are organized around a process. Neway provides an example: “Let’s say you have a highly instrumented process with many pH probes, oxygen probes, levels, pressures, temperatures, and the like. Those data come out of the instruments and control systems and are archived in a data historian. That historian is organized in a way that makes it easy for it to manage the data coming off the instruments. So it’s organized around instruments (or tags), not around the process as a whole. By contrast, a process can start with raw materials and go until filled and finished vials — going through two dozen unit operations that include not only sample data going to an LIMS system, but also instrument data feeding into historians, batch records with instructions, and records of switches and other settings. If you want to compare five batches that were ran last week from start to finish to five batches that were run the week before, you would have to get data from every one of those systems and massage it in spreadsheets with the organizing principle being the processed batch — not the instrument, not the unit operation — but the whole batch from start to finish.”
To help solve that problem, Accelrys developed the Discoverant software solution that allows operators to look at entire batches as though the whole process were occurring on their desktops. “This can be done without having to worry about which data are appropriate in the LIMS system, or the historian, or paper records. It does all of that organization in the background without the user having to worry about which process step or batch it applies to. So it’s a layer above that bridges the systems and makes a single self-service environment available to people who want to analyze the process.”
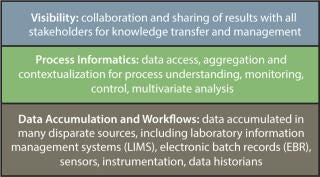
Self-service data access (that is, the ability to obtain data directly without having to go to a third party) can be considered part of an “ideal” process
informatics system. Once that is established, process informatics system should be part of a company’s ideal overall process management plan (Figure 1). Such a plan would involve data accumulation and workflows at the lowest levels, then a layer of informatics for process understanding, and a third level involving collaboration and sharing of results.

Figure 1: ()
Sensor Smarts
Increasingly, biomanufacturers are implementing real-time monitoring systems, both for single-use and reusuable bioreactors (3). John Carvell, sales and marketing director at Aber Instruments, says his company has seen an increased interest in real-time biomass monitoring. “Typically, most microbial and cell culture bioreactors already have real-time systems in place for temperature, pH, and dissolved oxygen,” he says. “So with many processes in which biomass concentration is a key parameter in the cultivation process and feed rates, and the optimal point for induction or harvesting might be based on the live-cell concentration, there’s an importance in on-line biomass measurements as well.” The majority of biomanufacturers working with single-use systems want to completely move away from taking samples at the bioreactor to doing everything either at line or online. Carvell says that in that case, companies need to have reliable single-use pH, dissolved oxygen, and biomass sensors in place.
Real-time signaling offers significant advantages over traditional methods. The first is a matter of time and convenience. Typical cell culture biomass sampling, for example, is conducted once or twice daily, but there can be significant delay between sampling and the availability of results as well as the potential risk of contamination from the sampling process. An on-line probe will also eliminate the need for sampling at night or over the weekend.
Online systems also can reduce variability. Offline cell counts are usually conducted by a number of process operators. “You do get variability between those process operators, which can add up some significant errors in the overall process. An online system will be more accurate, and you have a complete profile of what’s going on allowing a more robust manufacturing process. In some cases where the biomass method is already validated using an off-line method, the online probe can be used to pick up any process deviations or errors in the sample collection and analysis.”
An increasing number of bioprocessors are shifting to complete automation of their processes. Particularly in cell culture where, they want to control constant cell mass in a bioreactor. “It’s generally well known that if you take infrequent samples and then try and do control on the basis of the offline and often inaccurate cell count, you will end up with a lot of process deviation,” says Carvell. “So a preferred route would be to use online, live biomass measurement coupled with an algorithm to control the perfusion rate. In this process, the biomanufacturer uses the biomass probe to control live cell mass in the process.”
The type of sensor needed depends on a number of factors. For a biomass sensor, culture volume and bioreactor type are two of the most important. Aber, for example, offers three different versions of its Futura biomass sensors: for single-use bioreactors, production-scale capacities >3 L, and a “mini remote” version for bioreactors of a few hundred milliliters to about 2 L. But a Futura sensor model is in the works that can be coupled to a 6 mm probe. “Currently, on small bioreactors most of the sensors are typically about 12 mm in diameter, but if you’re actually going down to much smaller bioreactors — say down to 50 mL — then a probe with smaller electrodes and 6 mm in diameter, is a much better solution.”
“Manufacturers want sensors that not only are low cost and meet requirements for calibration and accuracy, but also are compatible with multiple processing environments such as gamma or sodium hydroxide sterilization,” says Jim Furey (general manager at Pendotech). “In addition, companies want inline sensors that can be connected to a monitoring operation that can communicate with the higher-level systems, whether it’s a local control system or a historian.” Potential future developments include reducing the number of components by having multiple sensing elements within one sensor, such as having one unit for pressure conductivity and temperature and different sensor connection options to interface to a process. PreSens, for example, focuses on online monitoring tools that can be integrated into both large and small volumes with the same precision. The company is working with chemical optical sensors that provide digital signals, which depend less on ambient electric and production noise than analog signals.
The increase in data acquisition also has created a need for greater data storage. Many companies use plant-wide systems (e.g., the DeltaV digital automation system from Emerson Process Management) that require sensors (both single use and reusable) to be integrated to process control systems. That data, in turn, can be tied to historian software. “We are definitely seeing a trend toward wanting to get data stored into centralized historian software instead of an individual laptop,” says Furey. Already offering inline sensors, the company recently added OPC (OLE for process control) servers to some of its products, which allows data to be served over a global network.
Data Monitoring and SCADA: Biomass sensor instrumentation is often coupled with data monitoring systems such as supervisory control and data acquisition (SCADA) software. Rather than taking the typical one or two frequency measurements to calculate live biomass concentration, for example, Aber SCADA allows you to look at the complete spectrum of the biomass from a very low frequency (100 kHz) to a much higher radiofrequency (20 MHz).
“It’s been shown that the profile of that spectrum significantly changes as you go through the culture, allowing the researcher to elucidate fine details of cell death that cannot be observed by other on-line technologies,” says Carvell. “So, one of the areas in which it’s being quite widely used is for studies of apoptosis. As some cell lines undergo apoptosis, the frequency scan or spectra significantly change, and you can derive a number of additional parameters via the SCADA software that can be used to detect the onset of apoptosis in real time.”
Multivariate Analytical Methods
An operation that is affected by more than one observable variable and the interaction of those variables will need to be analyzed by a statistical multivariate technique. Multivariate analysis (MVA) has had several uses in laboratories, quality assurance and control (QA/QC), and cell culture optimization and process scale up (4,5,6). An MVA system for a spectroscopy database for example, can find patterns in the data and optimize a specific spectroscopic unit operation.
As Furey observes, MVA technologies traditionally have been prevalent in upstream pr
ocessing. “Manufacturers already are familiar with the use of multivariate analysis with small-vessel bioreactors to find optimal pH and different gassing conditions. So bioreactor systems have had more built-in data acquisition where purification is perhaps lagging behind in that area. But I definitely see our customers wanting to increase their capabilities in downstream development.”
Software company Umetrics, for example, has developed three data analysis applications. The company’s MODDE desktop application software provides design of experiments (DoE) capabilties for obtaining data from a minimal number of experiments. It also allows researchers to conduct a number of simulations (e.g., Monte Carlo), risk analyses, and QbD applications. Umetrics SIMCA software can be connected to a data access and aggregation system (e.g., Discoverant) to conduct offline data analysis using multivariate analysis. Both MODDE and SIMCA are mainly for R&D application
MVA is sometimes confused with latent variable analysis, which is the evaluation of variables that are not directly observed but can be inferred through models generated from observable data. Latent variable analysis usually consists of two or more systems working to achieve such models: data access followed by mathematical operations on that data to “train” the software to build a useful model. Current studies include metabolic flux analysis (7,–10) and related alternative techniques as well as studies in multivariate statistical process control (MSPC) models with NIR spectroscopy (7).
Another MVA application to manufacturing is real-time monitoring capability. For example, Umetrics has developed systems that sit on a real-time database or data acquisition system (e.g., OSI PI, Discoverant from Accelrys). As such, data are received within specified time intervals and compared with a “golden batch” model previously built with the offline SIMCA product and based on data from at least 10 production batches. Significant deviations from the model trigger an alert (by means of a user interface or mobile device).
Process modeling is gaining interest in the bioindustry. Modeling systems take data (provided by an MVA system) and compare that data against what the system has been “trained” to see (based on previous process analysis). The system then provides some indication of how the process will behave or whether it is at risk of deviating from preset specifications. Operators can then “dig through” by clicking through the software to find out the cause of the deviation. Umetrics partnered with Accelrys to provide such process modeling capabilities. Without these automated capabilities, users are left with a manual process to extract data from data sources, place it into spreadsheets in a particular format and structure, and the spreadsheet is fed into the MVA. The Discoverant software has the ability to “access, aggregate, and contextualize the data automatically,” says Neway. So once you’ve set up a certain data set and it’s conditioned the way you want it’s pushed over into the Umetrics software.” Because the system has an open interface to the data sources, it can grab data from other systems and collect it through OPC, web services and other standard interfaces. “You no longer need to have a manual error-prone process of getting data into a multivariate system, and that makes things a lot easier for the multivariate system users.
Amos Dor (director of global sales at Umetrics) says the next step is process control. In addition to monitoring a process and pointing out a problem, control capabilities would be able to send new “set points” to an automation system to change the process in an effort to save a batch automatically.
Broadening the Knowledge Base
Work remains on improving industrial bioprocess sensors and related instrumentation. Factors supporting improved data acquisition in the industry include an increased interest in switching from offline to online measurements, scalability of analytical instrumentation, and the ongoing change from analog to digital signal transmission. Carvell points out that the industry wants real-time measurements of percent dissolved CO2 as well as some routinely measured nutrients such as glucose and glutamine. Some companies using single-use systems have other challenges to overcome. The poor performance and drift of single-use pH sensors are holding back the implementation of bags with disposable sensors.
Meanwhile, the PAT initiative has allowed many processes to have on-line systems “for information purpose only.” The application of dielectric spectroscopy for online biomass monitoring is seen by many groups as a promising tool in PAT. Multivariate tools are being applied from the frequency scan data of dielectric spectroscopy to indirectly determine parameters such as cell viability, size, and morphology. Further work needs to be done to establish how robust these algorithms or correction methods are when either different cell strains are used or when there are major perturbations in the process. “The same constraint applies to other online technologies such as NIR and Raman spectroscopy” says Carvell.
Most companies see the value in more data acquisition, a number of operators still use paper batch records, often because a company is small and lacks the infrastructure to support electronic methods. So there remains a need for information about new technologies. “We see customers having questions about single-use sensor technology, especially in terms of implementation and calibration,” says Furey.
A future process analytics implementation objective is to develop a means of connecting not only to manufacturing but also to other databases. “It’s what people are calling the big data solution,” says Dor. “For example, you would be able to see a problem in a raw material that is showing up on a different database. Or when a process is operating in a specific region and it has a very good gross margin, you would be able to connect to a finance database. It’s the ability to correlate between many different data sources inside and outside the plant and even connect to multiple sites worldwide or with your contract manufacturing organization partners.”
About the Author
Author Details
Maribel Rios is managing editor of BioProcess International; [email protected].
REFERENCES
1.).
2.).
3.) Bauer, I. 2012. Novel Single-Use Sensors for Online Measurement of Glucose. BioProcess Int. 10:14-23.
4.) Chan, C. 2003. Application of Multivariate Analysis to Optimize Function of Cultured Hepatocytes. Biotechnol. Prog. 19:580-598.
5.) Westerber, K. 2011. Model-Assisted Process Development for Preparative Chromatography Applications. BioProcess Int. 8:16-22.
6.) Yuan, H. 2009..
7.) Sandor, M. 2013. NIR Spectroscopy for Process Monitoring and Control in Mammalian Cell Cultivation. BioProcess Int. 11:40-49.
You May Also Like


