Establishing a Digital Platform for Data Science Applications in Biopharmaceutical ManufacturingEstablishing a Digital Platform for Data Science Applications in Biopharmaceutical Manufacturing

HTTPS://STOCK.ADOBE.COM
Biopharmaceutical manufacturing consists of multiple processes with complex unit operations. Those include mammalian cell culture in upstream operations and downstream chromatography steps for removing impurities from production streams and purifying the therapeutic biological molecule (1). Biomanufacturers need enhanced understanding to ensure the process control and manufacture of safe and efficacious drug products. Process understanding also enables opportunities for improving manufacturing efficiency.
Both process understanding and optimization can be facilitated by leveraging large volumes of biotechnology data — typically generated during manufacturing across an entire process — to develop data-driven models. In turn, such models can be used by process scientists and engineers as digital assistants to support their efforts toward understanding processes, monitoring for early fault detection and diagnosis, and identifying areas for efficiency improvements.
Rapid development and implementation of prototype models are required to fully realize the potential benefits of data-driven modeling. Such capabilities enable an early evaluation of a model’s capability for completing specific tasks. That is because models are developed to be easily accessible to key stakeholders (typically manufacturing experts and process scientists and engineers) for evaluation of and feedback about a model’s usefulness and provide feedback.
Development and implementation of data-driven models as integrated systems are much more complex than they are for models used by data scientists for exploratory data analyses. Thus, a digital platform must be established to facilitate rapid development and implementation of models by data scientists. The platform also must provide end-user access to modeling outcomes while hiding a model’s implementation complexity. Below, we introduce an approach toward implementing an advanced data-analytics digital platform that enables the development and deployment of prototype models and their assessment before industrialization. We also share some lessons learned during platform implementation.
Such a platform would present a unique opportunity: Modern machine learning operations (MLOps) concepts can be leveraged to create a system that supports implementation of ML solutions in the biopharmaceutical industry. Adopting such a framework can help standardize and accelerate implementation of ML solutions in biomanufacturing. That structured approach can be advantageous in a regulated environment.
Although implementation of cloud-based solutions is state of the art, building a cloud platform from scratch might not be the right approach. It takes a significant amount of time to transfer data from data systems to a cloud analytics environment and ensure that all corresponding IT security implications have been addressed. To mitigate those limitations, we chose a fast, agile approach that ultimately can pave the way for cloud-based operationalization and allows a staged deployment of applications to end users. Our approach can support rapid iteration and refinement of user requirements. The need for continuous support of legacy applications while still leveraging advantages provided by MLOps platforms is another reason to opt of a staged approach that focuses on establishing a data science platform on the premises before fully moving to the cloud.
We identified the following requirements in choosing a platform for operationalization:
• low effort required to implement data science applications
• rapid prototyping for data analytics solutions together with stakeholders
• ability to support a data science process end-to-end, from data collection to user interface (UI)
• flexibility in choice of data analytics methods.
With those guiding principles in mind, we set out to determine the best advanced data-analytics digital platform to support digital transformation.
Architecture of Advanced Data Analytics Digital Platform
In addition to meeting the above organization-level requirements for creating a data science platform, developers must meet specific technical requirements pertaining to data science implementation itself. Typically, data science applications consist of
• data collection
• model development
• deployment.
To facilitate deployment of those data analytics solutions, we put in place a software platform. That infrastructure is centered on the KNIME analytics platform (3) — specifically, the server-enabled version. The schematic in Figure 1 shows that the platform is centered on the KNIME server. It is responsible for orchestrating the entire data analytics workflow and providing data visualization and user interaction.

Figure 1: Schematic of a KNIME-based advanced data analytics platform.
In the background, KNIME Executor software is run to interact with data systems to capture process data — such as from Discoverant (Biovia) or PI historian (OSISoft) software — and to perform data mapping and preprocessing. We also used the software to perform data analytics and interact with dedicated advanced data-analytics packages such as the Simca (from Sartorius) and Python (from Python Software Foundation) systems.
The overall software platform provides advanced data analytics to a wide audience and requires that end users meet only minimal software requirements. Effectively, the complexity of advanced analytics is hidden from end users.
For analytics development, the KNIME platform allows users to build data analytics pipelines visually by connecting elemental data processing and analytics functions. Available data processing functions include data capture (e.g., from structured query language (SQL) databases), preprocessing (e.g., filtering and table joining), analytics, and visualization. In addition to performing native data processing functions, end users can use data processing functions written in scripting languages (e.g., the Python or R program languages) within the KNIME platform. That allows implementation of different data analysis functionalities.
The platform also provides the functionality to visualize analytical results, either through built-in visualization nodes or through JavaScript-based custom nodes for which visualization is rendered in an external web browser. This functionality enables uses to create interactive interfaces so that they can access the outcomes of a given data analytics pipeline.
The basic building block of a data analysis pipeline is a node. Each node implements some form of functionality. It might receive data as input and export data as output. The form of the data is not predefined; it can be a data table containing numerical information or a more complex format such as collections of images. Each node is configured according to its function within a workflow. (Editor’s note: See reference 4 for a discussion on different types of data.)
Figure 2 shows a workflow consisting of four nodes. Two source tables are joined. The output of that joined operation is visualized in a “Table View” operation. To support organization and overview, collections of nodes can be aggregated in an entity called a metanode. Akin to a script in a programming language, a metanode combines several nodes to provide a particular functionality.
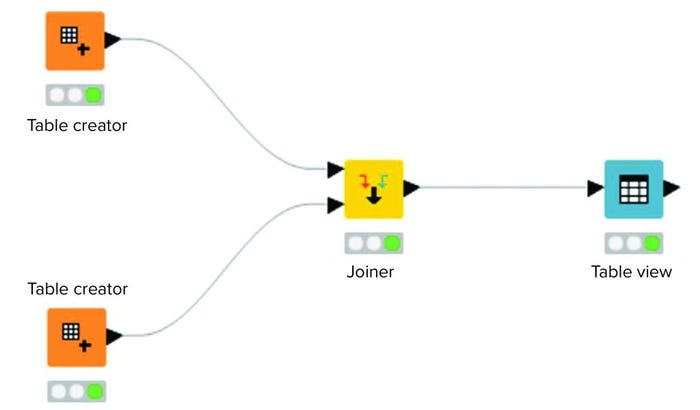
Figure 2: Example workflow in a KNIME analytics platform.
Implementation
We implemented our data science platform using an on-premises installation of the KNIME server. Figure 3 shows an overview of the data flow for that implementation. For this initial phase, the system was set up and operated as a non-GxP environment.
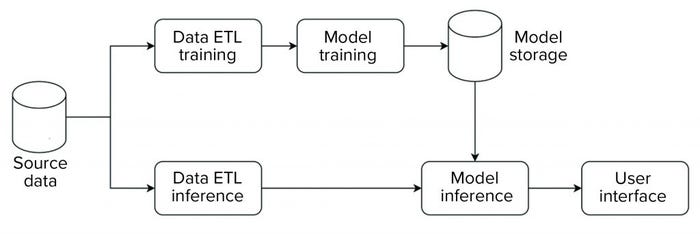
Figure 3: Block diagram of data flow for a data science platform.
The platform has an extract, transform, load (ETL) pipeline that is used to perform model training. The generated model then is stored in a database that is made available for data science applications. For model inference, a separate ETL pipeline is set up to serve data from new observations to the model. Model inference — with the model stored in a database as described above — then is executed on those data. Model metrics and outcomes are extracted and provided to a user in an interactive web-based interface.
The overall structure is standardized across all applications, so all individual steps (e.g., ETL, model training, model inference) are characterized by a standardized data model and interfaces. Thus, the same general structure can be used, independent of application. And components can be reused. For example, ETL pipelines can be shared to evaluate different ML approaches.
Platform Foundation
For the case study below, data were sourced from the Dicoverant process intelligence system using a representational state transfer (REST) interface (5). KNIME native data processing was used to connect to the source system and conduct data preprocessing and mapping such that the data were suitable for analysis.
The specific implementation went through a number of evolutions. For the proof-of-concept stage, a commercial software package was implemented for model training and inference. The resulting model was stored as a binary object in a bucket-type storage system. Model inference was orchestrated using scripts, which would access the model and extract metrics from the analysis software to display in the user interface. Because of challenges with deployment and scalability, the entire model training and inference were reimplemented in a Python environment in a subsequent evolution. That system provided a fully automated model training and inference suite. That transition could be executed without influencing functionality outside of model training and inference because of the platform’s modular design.
Although this data science platform was operated in a non-GxP environment, we took care to enable validation at a future point. Specifically, we implemented the following best practices:
• access control for the on-premises server used to host the digital platform
• version control of application-level code and procedures for deployment to platform
• traceability of models used for inference to ensure that appropriate models are leveraged for inference with the use of fingerprints (e.g., MD5 hashes of binary model files)
• exception handling to identify and efficiently resolve potential issues during application execution
• unit and integration testing as part of the initial platform commissioning and qualification activities
• Platform architecture and application implementation documented in detail in a format in line with validation documentation requirements.
Using those building blocks, we implemented the platform to deploy data analysis applications. Our next step was to implement a prototype multivariate data analysis (MVDA) model for continued process verification (CPV) of a final product manufacturing (FPM) process.
CPV Case Study
The US Food and Drug Administration (FDA) has released an industry guidance (6) indicating that CPV be implemented as the third stage of process validation. The guidance is applicable after the agency approves the licensure of commercial manufacturing. The goal of CPV is to maintain a validated state of the product, process, and system; to enable continuous process improvement; and to meet regulatory requirements for life-cycle validation.
A CPV program for a commercial biologic product entails reviewing critical process parameters (CPPs), critical quality attributes (CQAs), and other relevant data. The objective is to monitor an entire manufacturing process and the quality of its end product. All data are then statistically analyzed and evaluated to ensure that the biomanufacturing process is in a state of control and making products that meet the predetermined release specifications. Thus, CPV deals with vast amounts of data that must be efficiently collected, analyzed accurately, and inferred effectively to extract meaningful information and make intelligent business decisions.
Traditionally, in the highly regulated biopharmaceutical industry, data collection, analysis, and reporting have been performed manually, which created high demands for resources. Typically, CPV is performed at a univariate level, which means that each parameter or attribute associated with a process or unit operation is evaluated independently. That approach generates manufacturing data in the form of multiple control charts, one for each of the CPPs and CQAs. Reviewing those data is labor intensive and time consuming. Furthermore, univariate evaluation of data overlooks information that is present in the correlation of process parameter and quality attributes.
MVDA describes advanced statistical techniques and ML algorithms for analyzing large, complex, and heterogeneous data sets (7, 8). Several industrial applications (9–12) of MVDA can be used to facilitate process understanding, monitoring, and root-cause analysis. Specifically, MVDA can be implemented for a CPV program to monitor multiple CPPs and CQAs comprehensively, taking into consideration the underlying correlation among them (4).
MVDA allows for efficient pattern detection and supports the evaluation of new batches against historical batches with acceptable product quality. That facilitates early fault detection and provides holistic process understanding to identify the scope for process improvement. MVDA models also can assist in retrospective root-cause analyses. Such MVDA models can be implemented through MLOps, and model outcomes can be visualized with fewer charts, thereby making a CPV program leaner and more efficient. Thus, there is a huge scope in effectively industrializing CPV by leveraging MLOps. That strategy would provide an infrastructure that moves data collection, analysis, and reporting from low to high technology.
Case Study Implementation: We demonstrated the use of an MVDA CPV approach in biologics manufacturing. Specifically, our study focused on the FPM of a therapeutic protein. FPM is the last step in biomanufacturing following cell culture and purification in which a final product is brought to its target concentration and formulation before being packaged and distributed. We developed the MVDA model in the Python programming language. We trained the model using a subset of historical batches and tested it using the remainder batches. More details concerning model development and testing are available elsewhere (4).
MVDA facilitates the monitoring of multiple variables with only two excursion-detecting metrics to determine the state of control of a given process: Hotelling’s T2 statistic and model residuals. Hotelling’s T2 statistic (hereafter referred to as T2) represents the distance of an observation from the historical mean. Residuals refer to the part of the data set that cannot be explained by the model, usually noise in the data or an occurrence not seen by the model before. Acceptable ranges of T2 and residuals for a batch are defined by the critical level of 95%. If a batch lies outside those acceptable ranges for either or both metrics, then further investigation of contributing factors could be triggered. To that end, contribution plots are used to diagnose process excursions by providing a quantitative comparison of potential contributions for different process parameters. That comparison depicts the difference between a selected batch (or group of batches) and the mean of all batches to support root-cause analysis and further investigations. Figure 4 shows two excursion-detecting metrics (T2 and model residual) and one diagnostic metric (variable contribution) for a model.
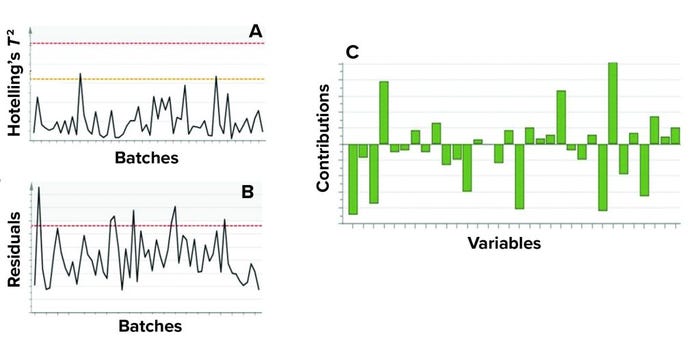
Figure 4: Example of model metrics used for process monitoring; both (a) Hotelling’s T2
statistic and (b) model residuals are used to identify excursions. (c) Contribution charts
denote the contributions of variables toward an excursion for a batch compared with the
mean of all batches. Sensitive information has been masked.
Standalone MVDA models have limited applicability because data ingestion and visualization of a model’s output require additional resources. Thus, we used the data science platform to develop and deploy a prototype operational workflow to automate data acquisition and data analysis using the multivariate model and visualize the results on a web-based interface.
A CPV expert could use the data science platform to monitor a manufacturing process and diagnose an excursion. As Figure 5 shows, the expert would initiate monitoring workflow by clicking the start button in the interactive web format. The figure shows only one workflow, but if more are implemented, the choice of process to evaluate would be made at this point. Clicking the start button triggers the acquisition of new data and inference against the stored model (Figure 3). The system then presents an overview of the excursion-detection metrics for the latest batches (Figure 6). Based on that information, the CPV expert can evaluate specific batches in greater detail.
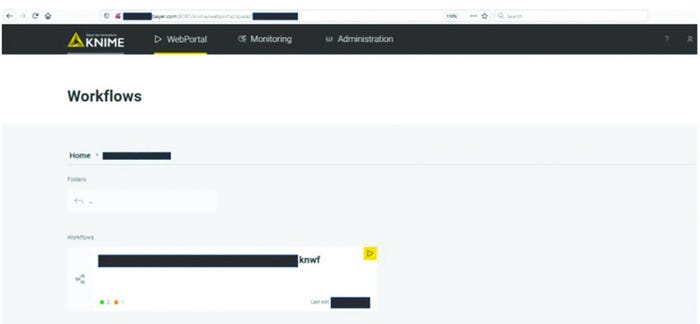
Figure 5: Application selection screen; sensitive information has been masked.
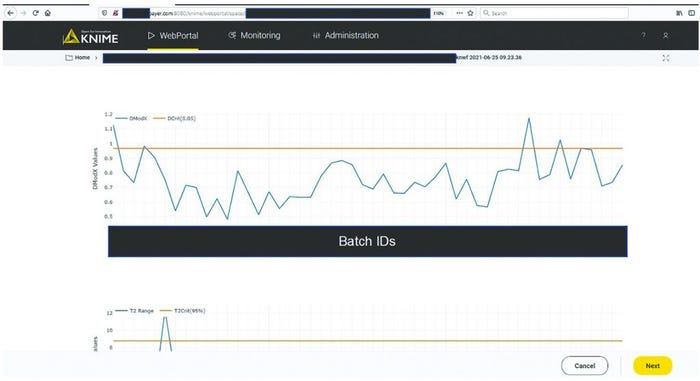
Figure 6: Batch overview of excursion-detecting metrics (e.g., model residuals, Hotelling’s T2 statistic). Sensitive information has been masked.
Figure 7 shows a contribution plot for model residuals for an excursing batch. This information facilitates understanding of the potential underlying root cause and supports communication with manufacturing experts. With the automated processes around data ingestion and visualization in the KNIME workflow, time invested in getting analysis results was reduced from about 40 hours to 10 minutes. As soon as new data are available in the databases, the models can update the results automatically and thus regularly present the most relevant information at a specified frequency.
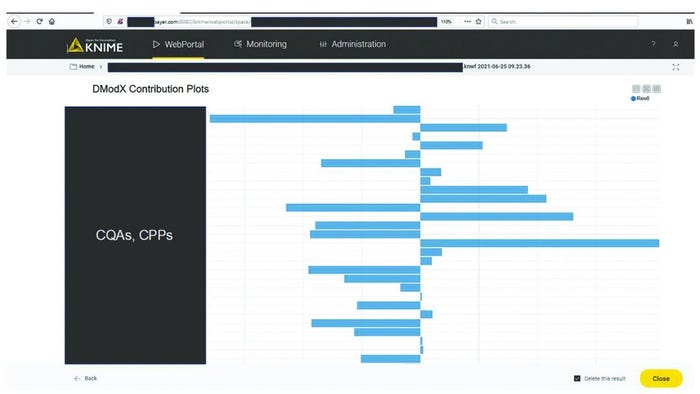
Figure 7: Diagnosis of process excursions with contribution plots; sensitive information has been masked.
Lessons Learned from Platform Development
Designing, developing, and deploying our advanced data analytics digital platform have provided us the opportunity to share what we have learned. Some of lessons follow.
Software engineering and development operations fundamentals are necessary skills in data science teams for building such platforms.
Investing time to design and establish pipelines general enough to accommodate different models comes at the benefit of limited tweaking down the road.
Implementing best practices such as exception handling can expedite troubleshooting during model deployment and faster resolution of potential issues.
Rapidly developing and testing prototype models substantially contributes to solidifying user-requirements for cloud- scalable operationalization and quickly identifying cases where limited or very noisy data do not warrant further model improvement.
Accelerate progress by making available the platform with short and rapid “model-development–end-user feedback and model enhancement” cycles.
Maintain flexibility regarding the data science tools that can be used within the platform. In our study, flexibility was provided by having the option to incorporate multiple programming languages such as Python, R, and JavaScript; open-source tools such as Plotly graphics library; and commercial software such as the MATLAB (from MathWorks) and Simca (from Sartorius) systems.
Establishing a Foundation
Data-driven models for bioprocesses can provide insights to manufacturing experts and process scientists and engineers. For example, such models can identify patterns and trends by leveraging complex and heterogenous data, thus facilitating informed decisions and actions. A key prerequisite for the rapid and iterative development of data-driven models is to establish a digital platform. The primary objective of such platform is to enable prototyping and deployment of data-driven model applications as minimum viable products (MVPs) to receive end-user feedback promptly.
That initial stage of model development is crucial because it allows cross-functional teams of subject matter experts (SMEs) and data scientists to quickly understand model capabilities. Thus, those teams subsequently can determine with relative ease whether further effort should be invested in fine-tuning those models and whether scalable deployment (typically in a cloud environment) is warranted.
We have introduced our approach toward implementing an advanced analytics platform and shared some lessons learned from such an implementation. A platform leveraging MLOps using the KNIME platform can be applied to CPV, which ensures that a manufacturing process is within control and that end products meet release specifications. Traditionally, CPV is executed at a univariate level, so all CPPs and CQAs are monitored through individual control charts, making the program labor-intensive. We adopted a multivariate approach for data analysis to make CPV leaner and more efficient than it can be using a univariate approach.
A key characteristic of the platform is its flexibility to connect to different databases, incorporating multiple open source tools and commercial data analysis software and programming languages. The advanced analytics platform also was capable of deploying model outputs in a web-based interface. We showed how the platform and multivariate data-driven model could be used to facilitate multivariate CPV in the FPM of a therapeutic protein.
Although not discussed herein, the platform can facilitate the development and deployment of models for other unit manufacturing operations. Thus, it can facilitate organizational efforts for holistic data-driven assessments of biomanufacturing processes.
References
1 Behme S. Manufacturing of Pharmaceutical Proteins: From Technology to Economy. Wiley-VCH: Hoboken, NJ, 2015.
2 Hill T, Waner A. Utilizing Machine-Learning Capabilities. Genetic Eng. Biotechnol. News 37(2): 28–29.
3 Fillbrunn A, et al. KNIME for Reproducible Cross-Domain Analysis of Life Science Data. J. Biotechnol. 261, 2017: 149–156; https://doi.org/10.1016/j.jbiotec.2017.07.028.
4 Maiti S, Mleczko M, Spetsieris K Multivariate Data-Driven Modeling for Continued Process Verification in Biologics Manufacturing. BioProcess Int. 19(10) 2021: 40–44; https://bioprocessintl.com/manufacturing/process-monitoring-and-controls/mvda-models-for-continued-process-verification.
5 Discoverant User’s Guide. Aegis Analytical Corp.: Lafayette, CO, 2001; http://pearsontechcomm.com/samples/Discoverant_Users_Guide.pdf.
6 Guidance for Industry: Process Validation — General Principles and Practices. US Food and Drug Administration: Rockville, MD, 2011; https://www.fda.gov/files/drugs/published/Process-Validation–General-Principles-and-Practices.pdf.
7 Eriksson L, et al. Multi-and Megavariate Data Analysis. Part I: Basic Principles and Applications. Umetrics Academy: Umeå, Sweden, 2006.
8 Bishop CM. Pattern Recognition and Machine Learning. Springer-Verlag: Berlin, Germany, 2006.
9 Kourti T. Multivariate Dynamic Data Modeling for Analysis and Statistical Process Control of Batch Processes, Startups and Grade Transitions. J. Chemomet. 17(1) 2003: 93–109; https://doi.org/10.1002/cem.778.
10 Rathore AS, Bhushan N, Hadpe S. Chemometrics Applications in Biotech Processes: A Review. Biotechnol. Prog. 27(2) 2011: 307–315.
11 Wold S, et al. The Chemometric Analysis of Point and Dynamic Data in Pharmaceutical and Biotech Production (PAT): Some Objectives and Approaches. Chemomet. Intell. Lab. Sys. 84(12) 2006: 159–163; https://doi.org/10.1016/j.chemolab.2006.04.024.
12 Ozlem A, et al. Application of Multivariate Analysis Toward Biotech Processes: Case Study of a Cell-Culture Unit Operation. Biotechnol. Prog. 23(1) 2007: 61–67; https://doi.org/10.1021/bp060377u.
Michal Mleczko is biotech digitalization lead, Shreya Maiti is a senior scientist, and corresponding author Konstantinos Spetsieris is head of data science and statistics, all at Bayer US LLC, 800 Dwight Way, Berkeley, CA 94710; 1-510-705-4783; [email protected]; http://www.bayer.com.
You May Also Like


