Practical Considerations for DoE Implementation in Quality By DesignPractical Considerations for DoE Implementation in Quality By Design
It is generally accepted that quality cannot be tested or inspected into a finished product, but rather that quality, safety, and effectiveness must be “designed” and built into a product and its manufacturing process. To encourage new initiatives and provide guidance to pharmaceutical process developers, the International Conference on Harmonisation of Technical Requirements for Registration of Pharmaceuticals for Human Use introduced the quality by design (QbD) concept. ICH-Q8 defines it as “a systematic approach to development that begins with predefined objectives and emphasizes product and process understanding and process control, based on sound science and quality risk management” (1).
A typical bioprocess for manufacturing an active pharmaceutical ingredient (API) is influenced by a complicated matrix of input and output parameters, including critical process parameters (CPPs) critical quality attributes (CQAs), as illustrated in Figure 1. Those input parameters may be interlinked or independent of each other. Other sources of variability are changes in raw materials, operators, facilities, and equipment, and it is difficult to understand all their possible permutations and effects on the quality of a final drug product. Consequently, statistical design of experiments (DoE) methods are extensively applied in process design to help process engineers understand the effects of possible multidimensional combinations and interactions of various parameters on final drug quality (2). Application of a DoE strategy provides scientific understanding of the effects of multiple process parameters and raw material attributes on product CQAs and leads to establishment of a “design space” and manufacturing control strategy.

PRODUCT FOCUS: ALL BIOLOGICS
PROCESS FOCUS: MANUFACTURING
WHO SHOULD READ: PROCESS DEVELOPMENT, ANALYTICAL, QUALITY, AND REGULATORY AFFAIRS
KEYWORDS: Critical quality attributes (CQAs), critical process parameters, statistical analysis, variation, process optimization, modeling
LEVEL: INTERMEDIATE
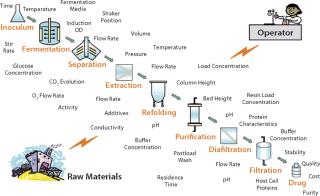
Figure 1: ()
Design of Experiments
DoE is a structured, organized method for determining the relationships among factors affecting a process and its output (1). It has been suggested that DoE can offer returns that are four to eight times greater than the cost of running the experiments in a fraction of the time that it would take to run one-factor-at-a-time experiments (3). Application of DoE in QbD helps companies
gain maximum information from a minimum number of experiments
study effects individually by varying all operating parameters simultaneously
take account of variability in experiments, operators, raw materials, or processes themselves
identify interactions among process parameters, unlike with one-factor-at-a-time experiments
characterize acceptable ranges of key and critical process parameters contributing to identification of a design space, which helps to provide an “assurance of quality.”
Proper execution of DoE within a design space is safe under QbD in bioprocess industries because work within a design space is not considered a change (1). However, some pitfalls can lead to a poorly defined design space. They can come from unexpected results, failure to take account of variability (due to assay, operator, or raw material) within a process, and the choice of parameters and their ranges considered in an experimental study, as well as errors in statistical analysis (e.g., model selection, residual analysis, transformation of response). We present here some good industrial practices based on our experience, on literature for the application of a DoE approach in bioprocess industries, and on nonbiotechnological industrial approaches (e.g., the oil and chemical industries, in which DoE and similar statistical techniques have been applied for many years).
Setting “SMART” Objectives: It is always important before beginning experimentation to determine the objective of an experiment, and this is no different with DoE. Identifying objectives helps focus a team on its specific aims (scientific understanding of the task/problem in hand) over a period of time. It also helps indicate what resources are and assists in managing expectations from a study’s outcome (4). DoE studies in support of QbD are often a delicate balance between delivering defined, high-quality products and meeting predetermined time, labor, and financial constraints (5). Consequently, it’s essential that the objectives for DoE experimentation are clearly defined.
The objectives should be “SMART”: specific, measurable, attainable, realistic, and time-based. To set them, a clear understanding of the process or unit operation under investigation is needed. This in turn requires input from a mixture of skills: statistical, analytical, and engineering. Therefore, the team responsible for a DoE study should involve members from statistical, process development, quality control, and engineering groups. At a contract manufacturing organization (CMO), customer involvement is also valuable in planning and implementation.
Selection of Input Process Parameters and the Range of Investigation: Once objectives have been defined, the next step is selecting appropriate process parameters associated with the scope of the study. The general trend in bioprocessing is to apply risk assessment methodology; for example failure mode and effect analysis (FMEA) or similar risk management tools (6). FMEA (Figure 2) systematically reveals the potential degree of impact for every operating parameter based on its score (potential degree of impact is a product of severity, probability of occurrence, and detection of the problem) on an overall process or its CQAs (7). A cause-and-effect (also known as a fishbone or Ishikawa) diagram (Figure 3) can help identify all potential parameters that can affect a particular unit operation or CQA (1).
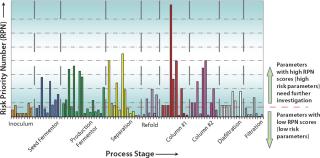
Figure 2: ()

Figure 3: ()
To further sort the potential CPPs that might provide an opportunity for better control, understanding, or improvement from the pool of parameters identified using one of those methods, researchers apply Pareto analysis to focus on the parameters of greatest potential impact (Figure 4). Pareto plots can also be useful in justifying selection or omission of process parameters for a study.
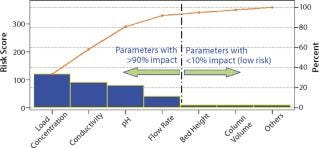
Figure 4: ()
Once a list of process parameters for experimental investigation is identified, the magnitude of their range for the experiment needs to be determined. Selecting a range that is too narrow will provide either very few or no operating parameters that show a significant main effect or interaction (Figure 5, LEFT). By contrast, too wide a range might indicate that every parameter significantly affects a process. A good practice is thus to set levels as far as possible to detect an effect without overly exceeding the manufacturing range (Figure 5, RIGHT). Depending on the type of study, the range investigated in a bioprocess is typically set ~1.5–2.0× the equipment or process capability for a robustness study (to reveal consistent performance) and three to four times the desired operating range for screening studies (to help identify influential factors or optimizing a process stage).
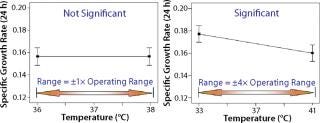
Figure 5: ()
Selection of Appropriate Responses (including CQAs) to gauge a change due to varying levels of input process parameters is crucial for success of a DoE experiment. Each chosen response must ideally be measurable quantitatively rather than qualitatively because the latter has limitations during statistical analysis (4). Repeatability and reproducibility (R&R) errors (errors in measurement due to variation in operators, assays, and their interaction) should also be taken into consideration. In the presence of substantial R&R error, the chances of identifying significant effects or interactions are masked by variation in the experiment (Figure 6, LEFT). So it is crucial to address variability associated with measuring a response variable before starting a DoE study.

Figure 6: ()
In nonbiotech process industries, R&R errors <20% are deemed acceptable (8). But in our experience, bioprocess R&R errors that are typically 5–15% (depending on the system under consideration) increase the chances of identifying significant effects or interactions. R&R are ideally measured or estimated before the onset of an experiment. If this is not possible, then depending on process knowledge, these errors can be partly compensated for by including replicates or center points in a design (Figure 6, RIGHT).
Understanding Variability (Blocking, Randomizing, Replicates and Repeats, Center Point Runs): To understand a process by applying statistical DoE techniques, deliberate changes (systematic variability) are induced. The responses can be analyzed to estimate the effects of those changes only if the systematic variability introduced is greater than the random variability (noise) inherent to a process. The entire experiment and analysis can raise serious concerns about the reliability of experimental outcomes if random variability is uncontrolled and higher than the systematic variability (Figure 6, LEFT). In such situations the three basic principles of DoE — blocking, randomizing, and replication — can be used to take random variability into account (9).
Blocking is a useful tool for taking into account known sources of variation that may affect a process but are not a cause of great concern (9). For example, the flask position in a shaker during incubation can lead to variation on the final optical density (OD), as Figure 7(LEFT) shows. Such uncontrolled variation can be attributed to the rate of heat transfer at different positions in a shaker incubator. Hence, to increase the DoE sensitivity by controlling or eliminating the known source of random variation, the Figure 7(RIGHT) experiments were blocked in two homogenous blocks (position A and position B). Blocking in this case reduced the tendency of shaker position to inflate experimental error, thus increasing the probability of revealing the true difference in identification of the main effects influencing the response.
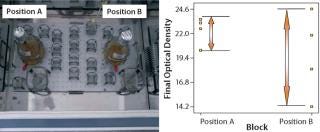
Figure 7: ()
To effectively use the available resources, blocking also can be applied to perform experiments simultaneously in different equipment by different operators and take account of variability transmitted by different operators and equipment. Most statistical packages will determine blocking generators by confounding blocks with higher-order interactions. Confounding (or alias) causes information about certain treatment effects (usually higher-order interactions) to be indistinguishable from blocks or other treatment effects (9). However, an experimenter should be careful in choosing block generators to ensure that they are not confounded with the main effects and two-factor interactions in a study (4).
The effect of uncontrolled variability (e.g., time of day or ambient temperature) in an experiment can be minimized using randomization. Randomizing experiments satisfies the statistical assumption that observations (or errors) are independently and randomly distributed. In addition, randomized experiments can prevent the effect of uncontrolled random variation (noise) over time on the response of experimental results. Statistical packages are widely used to randomize experiments. Depending on the type of experiment, however, an operator’s input should be taken into consideration when determining the degree of randomization possible or practical in a design matrix to reduce human error or time taken for setting up an experiment.
Another way to account for random variation is by applying the principle of replication, in which all or selected experiments from a DoE design matrix are completely replicated. This provides an estimate of pure error associated with the experiment, thus enabling better prediction by the model. The more an experiment is replicated, the greater is a model’s reliability (10). Because of practical limitations in availability of resources typical to biologic processes, however, the best practice is to replicate the center points at the set-point conditions of a process or unit operation.
Depending on the nature of the study (Figure 8), replication or addition of center-point experiments at set-point conditions serve the dual purpose of estimating pure error (experimental variation) and curvature (nonlinear effect). Moreover, if a DoE analysis suggests that the design is robust, then responses from those center-point runs at set-point conditions can be used further in setting specification limits for process parameters during validation (11) or to validate the scale-up/scale-down model of a process using multivariate analysis (12).

Figure 8: ()
Random variation can be inherent to biological processes, and it may affect the validity of the DoE approach if it exceeds the systematic variation induced in the process. Hence, before starting a DoE study, experiments should be performed to check repeatability. If random variation is too large, then users should address that before performing experimental design runs. Once repeatability is demonstrated, then you can begin design matrix runs containing evenly distributed center points. Including evenly distributed center-point runs will take into account unknown sources of variation due to different days, raw materials, and laboratory conditions.
Assay variation is another harsh reality typical to bioprocess development. To cope with this reality, experimental response measurements should be repeated and then averaged into a single response. That reduces errors due to variation in assay measurement. If most variation is mainly attributable to the measurement system, then the biggest “bang for the buck” comes from reducing measurement variation (13).
Choice of Experimental Design: The most important part of a DoE process, choosing an appropriate experimental design, is critical for the success of the study. The choice of experimental design depends on a number of aspects (9), including the nature of the problem and/or study (e.g., a screening, optimization, or robustness study), the factors and interactions to be studied (e.g., four, six, or nine factors, and main effects or two-way interactions), and available resources (e.g., time, labor, cost, and materials).
Using previous knowledge of a product or previous experiments to identify possible interactions among the input process parameters before performing an experiment also plays a key part in selecting an appropriate experimental design (e.g., a 2k full factorial design or a 2k–p fractional factorial design). Although most useful in terms of the information provided, full factorial designs are not usually practical for six or more factors because the number of experiments doubles sequentially with each additional factor. In such cases, the best approach is to perform a low-resolution design to identify the main effects and then perform a sequential high-resolution or full-factorial DoE with the influential factors identified in that first stage. However, if the experiments are cheap and easy to run, then play it safe by choosing a high-resolution experimental design as in Figure 9 (8).
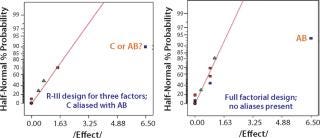
Figure 9: ()
Statistical Analysis (Model Selection, Residual Analysis, Transformation of Response): Once data have been collected according to the chosen design, the results should be analyzed using statistical methods so that objective conclusions can be drawn. Many software packages are available to assist, including those that help users choose a design to those that perform statistical analysis, report results, and generate a mathematical model. It is always a good practice to check the initial model suggested by a program to ensure it is the most appropriate choice. That is best carried out by the regressive modeling approach (Figure 10).

Figure 10: ()
In regressive modeling, parameters (main effects or interactions) are first selected to predict and/or model the behavior of a chosen response based on the contribution of their effects. Their significance is then subjected to verification using the analysis of variance (ANOVA) method. ANOVA is a statistical method based on the F-test to assess the significance of model terms under consideration for a final empirical model. It involves subdividing the total variation of a data set into variation due to main effects, interaction, and residual error (10). One or more model terms are added or removed from analysis if its effect is found to be insignificant (generally on the basis of p value >0.05 or >0.10 resulting from the F-test). The new model, with more or fewer model terms, is again forced through this cycle until all terms included in the model satisfy F-test statistics.
Once the appropriateness of those terms and the overall model satisfies an ANOVA check, the next step is to determine what cannot be modeled (errors resulting from the model). This is done using a residual analysis technique (Figure 11). Residuals (model errors) are the difference between the actual response obtained from an experiment and the value predicted by the chosen model. A model is deemed a “good fit” if its residuals are normally and independently distributed with zero mean and constant variance (9). Such distribution can be analyzed graphically, with most statistical packages using three key basic plots: the normal probability plot of residuals, residuals plotted against predicted values, and residuals plotted against experiment run order.
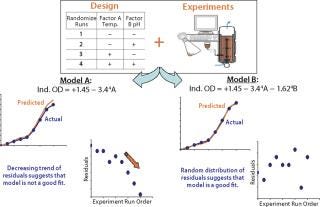
Figure 11: ()
A residuals plot that does not satisfy the normal and random distribution criteria signals discrepancy in a selected model, even if it has satisfied the ANOVA test criteria. In this scenario, depending on the spread of residuals, further treatment such as response transformation (e.g., log transformation of a cell count), removal of potential outliers, or further addition and/or removal of model terms will help produce a model that satisfies both ANOVA and residual analysis criteria. Response transformation can be tricky, and it’s best to adopt a transformation based on process knowledge rather than recommended by the statistical package. Similarly, any particular design point should be removed only on the basis of thorough scientific evidence rather than simply discarded as an outlier. Statistical methods coupled with good process knowledge will usually lead to sound conclusions.
Once a model is found that satisfies criteria mentioned in the regressive modeling approach, the next step (depending on the model output and nature of a study) is either to characterize the design space or perform the next part of DoE (sequential DoE). Statistical methods do not allow anything to be proved experimentally, but they do allow measurement of likely errors in a conclusion or attachment of a level of confidence to a given statement (9). So the best practice — especially before characterizing a design space — would be to perform confirmation runs to validate the empirical model resulting from a DoE.
Software and Statistical Awareness: Despite a great push by regulatory authorities to apply DoE techniques in drug development, they haven’t endorsed any of the DoE software packages (to our knowledge), which allows users flexibility in adopting the particular software that fits for their purposes. Chosen software should have an easy-to-use, graphical user interface; complicated programs might put off nonstatisticians and alienate new users. Consider whether a program supports all methods of experimental design (e.g., factorial, one factor at a time, mixture design, response surface design, and Taguchi) and identifies loopholes (e.g., aliases) with an adopted design.
Good DoE software helps users follow the regressive modeling approach outlined in Figure 11. It should guide them in carefully choosing model terms on the basis of graphical tools and statistics, and it should verify a model and its significance based on statistics in addition to verifying unaccounted residuals. Graphical tools play a key part in understanding and presenting statistical analysis results, so make sure that they deliver a smart way to diagnose, analyze, predict, and present the results in two and three dimensions. A support mechanism with help files, manuals, training workshops using relevant case studies, and online technical support forms the backbone of a good software package. All these points should also play a critical role in choosing your particular software.
Understanding and analyzing data is becoming more necessary in biologics. In today’s strictly regulated business environment and multidisciplinary job market, analyzing data is no longer the domain of statisticians alone. To gain competitive advantage and improve the ability to transform data into knowledge, it is necessary under the QbD initiative that all members of a team responsible for DoE studies (e.g., technical project leaders, principal scientists, engineers and quality control staff) should be trained in elementary statistical knowledge of DoE. Such training facilitates standardizing an approach throughout an organization, which helps in organizing, sharing, and reporting information.
A DOE PROTOCOL INCLUDES…
Details about the unit operation under investigation, with a list of all parameters that could affect it
Justification for including or omitting particular parameters to be investigated (presenting output from FMEA investigation or other risk assessment methodology, cause-and-effect diagram, and Pareto analysis to strengthen the selection/omission of parameters)
Ranges and levels of parameters to be investigated in line with the scale of the operation and intended manufacturing facility
Design options available for study and rationale for choosing a particular design
Details on raw materials to be used (recognizing that raw material lots may also be factors for investigation)
A sampling plan and analytical methods to be applied, along with their acceptance criteria
Discussion of the scale of experimentation with respect to the final intended scale
Review and approval from the team involved (and authorization from the customer if a CMO)
Data Reporting Requirements: Biologic processes rely on good documentation, not just for regulatory approval, but also to ensure that knowledge captured through DoE studies is made available. For CMOs, detailed technical reports outlining the results and analysis of DoE performed and authorized by reviewers (including customers) keep everyone on the same page. The best practice would be to generate reports at two stages: one at the beginning of experimentation outlying the reason for a particular DoE; the other after performing such an experiment detailing its results, analysis, and follow-up. The “Protocol” box lists points to include in a protocol before DoE experimentation.

After completion of a DoE study, a detailed report should be produced that includes its resulting responses to be analyzed along with the design matrix chosen for the study. ANOVA tables should justify the parameters and model derived. Graphical outputs should justify the selection of parameters, residual analysis plots to validate the model, and finally present model graphs (effects and interaction plots) for rapid understanding of results. The model should be verified and its design space characterized (or future steps identified based on the results, such as the need for any sequential DoE).
Coping with Inherent Variation
In bioprocess development, variation is part of day-to-day life because of live organisms and biological systems involved. Understanding this variation and designing control systems to adjust a process in response to it will improve the quality, safety, and efficacy of a drug product. This requires a depth of product and process understanding, which can be provided by a DoE method. A systematic application of DoE facilitates the identification of CPPs and their relationship to CQAs, leading to the development of a design space. In combination with quality risk management (QRM) and process analytical technologies (PAT), these help companies maintain good manufacturing control and consistency, ultimately guaranteeing the quality of their drug products.
About the Author
Author Details
Mahesh Shivhare, PhD, is a nonclinical statistician, and Graham McCreath, PhD, is head of process design at Avecia Biologics ltd., Belasis Avenue, Billingham, TS23 1YN, United Kingdom; [email protected].
REFERENCES
1.) ICH Q8 2006. Pharmaceutical Development. Fed. Reg. www.ich.org/LOB/media/MEDIA4986.pdf 71.
2.) Rathore, AS, R Branning, and D. Cecchini. 2007.Quality: Design Space for Biotech ProductsBioPharm Int..
3.) Torbeck, L, and R. Branning. 2009.QbD: Convincing the SkepticsBioPharm Int.:52-58.
4.) Antony, J, M Kaye, and A. Frangou. 1998. A Strategic Methodology to the Use of Advanced Statistical Quality Improvement Techniques. The TQM Magazine 10:169-176.
5.) Cook, S, KA Patton, and R. Bazemore. 2007.Quality By Design in the CMO EnvironmentBioPharm Int.:28-46.
6.) Rathore, AS, and H. Winkle. 2009. Quality By Design for Biopharmaceuticals. Nat. Biotechnol. 27:26-34.
7.) ICH Q9 2006. Quality Risk Management. Fed. Reg. www.ich.org/LOB/media/MEDIA1957.pdf 71:32105-32106.
8.) Kraber, S. 1998.Eight Ways to Clean an ExperimentAQC World Congress 1998, American Society for Quality, Milwaukee.
9.) Montgomery, DC. 2004.Design and Analysis of ExperimentsFifth Ed., John Wiley & Sons, Inc., New York.
10.) Anderson, MJ, and PJ. Whitcomb. 2007.DOE Simplified: Practical Tools for Effective ExperimentationSecond Ed., Productivity Press, New York.
11.) Wang, XGA, J Harms, and AS. Rathore. 2007. Using Statistical Analysis for Setting Process Validation Acceptance Criteria for Biotech Products. J. Biotechnol. Progr. 53:55-60.
12.) Kirdar, AO, J Baclaski, and AS. Rathore. 2007. Application of Multivariate Analysis Toward Biotech Processes: Case Study of a Cell Culture Unit Operation. J. Biotechnol. Progr. 23:61-67.
13.) Adams, W. 2008. Replicates vs. Repeats, Stat-Ease Inc..
You May Also Like


