Determining the Effect of Raw Materials on Manufacturing-Scale Cell-Culture PerformanceDetermining the Effect of Raw Materials on Manufacturing-Scale Cell-Culture Performance
Large-scale cell culture production processes routinely involve multicomponent cell culture media formulations including both chemically defined raw materials and complex raw materials such as hydrolysates (1). Even minor variations in the compositions of either can lead to variability in protein productivity or product quality. That often persists despite the use of a raw material lot-blending strategy at large scales to “average out” raw material trends. And a raw material lot-blending strategy can makes it more difficult to identify which single media component is responsible for a variation. Analysis of cell culture processes to identify their critical raw materials is further complicated by use of multiple raw materials that may interact with each other as well as multiple formulations that are mixed together to create a final basal or feed medium. Identification of a raw material component causing variability in cell culture performance is a critical first step toward establishing better control over cell culture processes at manufacturing-scale.

Figure 1:
COMPOSITE BY CHERYL SCOTT USING ELEMENTS FROM ANDREI TCHERNOV (WWW.ISTOCKPHOTO.COM) AND WWW.PHOTODISC.COM
PRODUCT FOCUS: PRODUCTS OF MAMMALIAN CELL CULTURE
PROCESS FOCUS: PRODUCTION
WHO SHOULD READ: QA/QC AND PROCESS DEVELOPMENT
KEYWORDS: MEDIA OPTIMIZATION, CELL CULTURE PROCESS OPTIMIZATION, RAW MATERIALS ANALYSIS, LARGE-SCALE
LEVEL: INTERMEDIATE
Statistical tools such as analysis of variance (ANOVA) and chemometrics are commonly used in analyzing cell culture performance. Chemometric tools such as principal component analysis (PCA), partial least squares (PLS), and soft independent modeling of class analogy (SIMCA) can be used to analyze a large number of variables together, so they are effective in situations that involve multistage operations, multiple raw materials, and large datasets (2,3,4). These tools have been applied for process control and variability analysis in bacterial and mammalian cell culture processes, but they lack the mechanistic details associated with complex biological systems (5). Here, we describe a multivariate mathematical tool that fits cell culture performance parameters to mathematical models that are mechanistic in nature and can thus be used to identify the most critical raw material in a cell culture process.
Theory
We used three mechanistic mathematical models for our mathematical analysis: cooperative, additive, and substitutive. These represent the generalized forms of interactions that occur in biological systems (6, 7).
The cooperative model assumes that raw materials interact with each other. Equation 1 describes their effects on protein production according to the cooperative model. The additive model assumes that raw materials participate independently and often in parallel with each other. Equation 2 describes the relationship between titers and contributions from the raw materials according to the additive model. The substitutive mechanism assumes that raw materials participate in the same pathway, so their effects can be added together as shown in Equation 3.
Algorithm of the Mathematical Analysis: Figure 1 shows the algorithm we developed to correlate titers with raw material use. It comprises three steps: parameter estimation, calculation of individual raw material contributions, and determination of correlation coefficients.
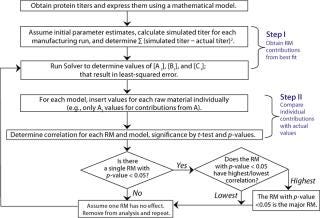
Figure 1: ()
Using the Solver function in Microsoft Excel, parameters Ai, Bi, and Ci were estimated for the least-squared error between simulated and actual titers in individual mathematical models. Those parameters were inserted into their corresponding models, one raw material at a time (e.g., only Ai parameters inserted for contribution from raw material A, and so on), to determine relative contributions from each. We determined correlation coefficients between the individual raw material contributions and titers at manufacturing scale for each of our three mathematical models. Then we tested those correlation coefficients against the hypothesis of no correlation using t-test at a 0.05 significance level.
Equations 1–3: Tmax = maximum titer achievable during protein production; K = half-maximum contribution from raw materials; Ai, Bi, Ci … = contribution from individual lots of raw materials A, B, C …


For each mathematical model, we compared significant correlation coefficients with each other and determined p-values (8). The critical raw material was identified in each case based on associated statistical significance (p < 0.05).
For results reported here, we applied the cooperative model to determine the effect of raw materials on cell culture performance at commercial manufacturing site 1. Similar analysis was conducted at commercial manufacturing site 2, which involves raw material blending (data not shown). The mathematical tool was successfully applied to situations involving such lot blending. Parameters Ai, Bi, and Ci were weighted for estimation according to raw material use. Results obtained from additive and substitutive models at both sites were identical to those from the cooperative model.
Results and Discussion
During production of a recombinant protein at two commercial manufacturing
sites, an upward drift in protein titers was simultaneously observed (Figure 2). It happened simultaneously at two independent commercial manufacturing sites with no process or equipment modifications made, so raw materials were suspected to be the cause. Analysis of cell culture media at both sites revealed the use of three multicomponent raw material formulations (A, B, and C). Because of their complexity, they were identified as likely root causes for the protein titer variations. Below we discuss methods for identifying which formulation is responsible. A raw material lot-blending strategy was used at site 2, whereas single lots of each raw material were used during each manufacturing run at site 1. The blending done at site 2 made it difficult to conduct a simple statistical analysis, and ANOVA applied at site 1 gave inconclusive results (data not shown).
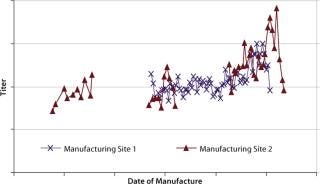
Figure 2: ()
Mathematical Analysis of Cell Culture Performance: Protein titers at commercial manufacturing site 1 were fitted to the cooperative mathematical model, and parameters Ai, Bi, and Ci were obtained based on least-squared error using the Solver function in Microsoft Excel. For parameter estimation, we used KA = KB = KC = 0.1, and Tmax was chosen as a value close to the historical maximum titer. Analytical results remained unchanged when the K and Tmax values were changed. Initial parameter estimates were taken as 0.01; the results did not change for estimates between 0.001 and 0.1. Figure 3 shows protein titers and simulated titers obtained from the best fit for the cooperative model.
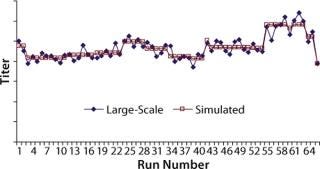
Figure 3: ()
We obtained the contributions of each raw material by inserting the parameters estimated during the least-squared error fit into Equation 1 for each raw material individually. Figure 4 overlays raw material contributions and titers at manufacturing scale. And Figure 5 shows correlation coefficients determined between raw material contributions for each raw material and titers at manufacturing-scale.
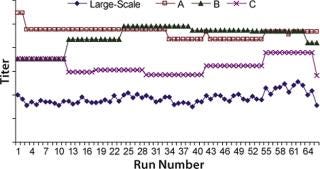
Figure 4: ()
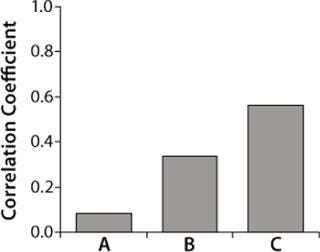
Figure 5: ()
Correlation coefficients for the three raw materials resulted in t-values of 0.7, 2.9, and 5.5 respectively. Because the t-value of raw material A is less than 2.0 (p-value of 0.05, degree of freedom 64), and the t-values for raw materials B and C are greater than 2.0, only raw materials B and C were considered to have significant correlations to titers. Raw material C had the highest correlation coefficient (Figure 5) but was not significantly higher statistically when compared with raw material B (p-value = 0.2).
Because raw material A had no significant correlation with titers based on the t-test, we repeated our analysis without it. Figure 6 shows correlation coefficients for this second analysis. Raw materials B and C had t-values of 1.5 and 7.4, respectively. So we determined that only raw material C is positively correlated to titers at commercial manufacturing scale (t-value > 2.0). Thus, raw material C has more effect on protein productivity than materials A and B. Analysis conducted at commercial manufacturing site 2 also showed C as the most critical raw material in the cell culture process.
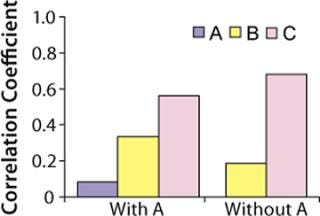
Figure 6: ()
Applicability of this Multivariate Analysis for Process Control and Optimization: The ability of the mathematical tool to correlate performance parameters to raw material use suggests a wide range of applications in the analysis of mammalian cell culture. It may be applied to analyze the effect of raw materials on a number of performance parameters such as product quality, cell growth profiles, and metabolite formation. Identification of critical raw materials can lead to process improvement efforts for more consistent cell culture performance. This mathematical tool also can provide better insight into how raw materials affect performance at commercial scale and help us understand how raw materials can interact.
REFERENCES
1.) Heidemann, R. 2000. The Use of Peptones As Medium Additives for the Production of a Recombinant Therapeutic Protein in High-Density Perfusion Cultures of Mammalian Cells. Cytotechnol. 32:157-167.
2.) DiFeo, TJ. 2003. Drug Product Development: A Technical Review of
Chemistry, Manufacturing, and Controls Information for the Support of Pharmaceutical Compound Licensing Activities. Drug Dev. Ind. Pharm. 29:939-958.
3.) Kourti, T. 2006. The Process Analytical Technology Initiative and Multivariate Process Analysis, Monitoring, and Control. Anal. Bioanal. Chem. 384:1043-1048.
4.) Schonkopf, S. 1999. Chemometrics as a Competitive Strategy for R&D. Am. Laboratory April:32-34.
5.) Mandenius, CF. 2004. Recent Developments in the Monitoring, Modeling, and Control of Biological Production Systems. Bioprocess. Biosyst. Eng. 26:347-351.
6.) Dutt, P, JF Wang, and JE. Groopman. 1998. Stromal Cell-Derived Factor-1 Alpha and Stem Cell Factor/Kit Ligand Share Signaling Pathways in Hemopoietic Progenitors: A Potential Mechanism for Cooperative Induction of Chemotaxis. J. Immunol. 161:3652-3658.
7.) Waygood, EB, JS Mort, and BD. Sanwal. 1976. The Control of Pyruvate Kinase of Escherichia coli: Binding of Substrate and Allosteric Effectors to the Enzyme Activated By Fructose 1,6-Bisphosphate. Biochemistry 15:277-282.
8.) Papoulis, A. 1990.Probability and Statistics, Prentice-Hall International Editions.
You May Also Like


