Production and Purification of a PER.C6-Expressed IgM Antibody TherapeuticProduction and Purification of a PER.C6-Expressed IgM Antibody Therapeutic
Immunoglobulin G (IgG) antibodies have been used to treat cancer for many years (1). Another class of antibodies—immunoglobulin M (IgM)—has been overlooked in spite of offering unique advantages that make them highly desirable as cancer therapeutics. Serving a valuable function in our innate immune system, IgM antibodies are the first to be secreted when an abnormal cell is present (2). These antibodies play a critical role in recognition and elimination of infectious particles (3,4), in removal of intracellular components, and in immunosurveillance mechanisms against malignant cells (5,6). IgMs also can bind to multiple copies of a target on a cancer cell surface. Such high avidity leads to cross-linking and more effective cell killing (7).
PRODUCT FOCUS: ANTIBODIES (IGM)
PROCESS FOCUS: MANUFACTURING
WHO SHOULD READ: PROCESS ENGINEERS, PRODUCT DEVELOPMENT, AND MANUFACTURING
KEYWORDS: PER.C6 CELLS, SCALE-UP, OPTIMIZATION, MONOLITHS, FED BATCH
LEVEL: INTERMEDIATE
In spite of all those desirable biological activities, IgM antibodies have not been widely developed as biopharmaceuticals. A number of misconceptions about IgMs have prevented their more widespread adoption. For example, some people believe that these antibodies are too large to be effective, that their expression levels in bioproduction systems are too low to be economically feasible, and that they are unstable and too difficult to purify (8,9).
IgMs’ large size and complexity have slowed the creation of high-expressing cell lines. These antibodies contain five or six units, each of those containing an IgG-like structure of two heavy chains and two light chains, which are all assembled into a pentamer or hexamer. A J-chain also might be present, binding to the tail piece at the heavy-chain C terminus. Each IgM subunit can have five or six potential sites for N-linked glycosylation (10). Nevertheless, several nonlymphoid cell lines—such as C6 glioma, Chinese hamster ovary (CHO), and HeLa cells—have been used to successfully produce polymeric IgMs, albeit with low reported yields (10 ng/mL for CHO cells) (11). Using rat hybridoma cell lines has improved productivity, with final yields reported at ∼100–200 mg/L in batch cultures and 700 mg/L in a medium-exchange process (12).
On the downstream side, IgMs’ large size (>900 kDa), narrower solubility range of conditions than IgGs have, and susceptibility to denaturation have presented difficulties in purification. Those challenges have been overcome with available technologies to develop effective capture and purification procedures (9). Ion-exchange, hydrophobic-interaction, and hydroxyapatite chromatography can bind IgMs under proper conditions. And technologies such as membranes and monoliths that rely on convection rather than diffusion are especially well suited for IgM purification (13,14).

Figure 1:
Alternative expression systems have become available to express protein therapeutics. For example, the PER. C6 human cell line—developed by Percivia LLC (a joint venture between Crucell NV and DSM Biologics) as a generic modified human primary embryonic retinoblast line—has a well-documented history with evidence of safety testing. It has been extensively developed for producing recombinant proteins. Using that cell line, we have successfully expressed
IgMs at higher titers that are functional and stable. We used a straightforward and rapid stable cell-line generation method (10).
Here we describe the technology transfer and scale-up of a process for a PER.C6 line expressing the PAT-SM6 (SM6) IgM antibody. The SM6 protein is proprietary to Patrys Ltd. and is currently under evaluation in a phase 1 melanoma study. We outline the production, scalability, and purification processes for that antibody.
Bench-Scale Cell-Culture Studies: Following procedures recommended by Percivia for PER.C6 cell lines, we ran batch and fed-batch studies with shake flasks using HyClone CDM4PERMAb media from Thermo Scientific and a Percivia-developed custom feed. Then we transferred our shake-flask process to 12-L bioreactors and evaluated suitable Wave Bioreactor operating parameters for scale-up of inocula.
Process Evaluation in Shake Flasks: To initiate these studies, a vial from the SM6 master cell bank (MCB) was recovered using CDM4PERMAb media supplemented with l-glutamine and Pluronic F-68 solution. After serial passaging, we set up batch cultures in duplicate using EM 250-mL shake flasks at a seeding density of 5 × 10⁵ vc/mL. We set up fed-batch cultures in duplicate using EM 250-mL shake flasks comparing seeding densities of 5 × 10⁵ and 7.5 × 10⁵ vc/mL. SM6-expressing cells in batch cultures attained maximum viable densities of 8.7 and 9.7 × 10⁶ vc/mL in shaker flasks A and B, respectively (Figure 1). Fed-batch cultures with 5 × 10⁵ vc/mL seeding density reached densities of 35 and 36 × 106 vc/mL in shaker flasks A and B, respectively. Fed-batch culture at the higher seeding density (7.5 ×10⁵ vc/mL) gave similar results, reaching 37.2 × 10⁶ vc/mL (Figure 2).
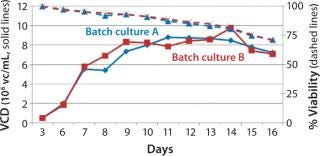
Figure 1: ()
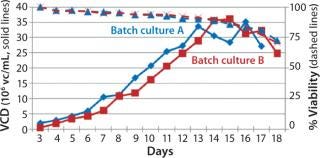
Figure 2: ()
The viable cell density (VCD) for SM6-expressing cells in both fed-batch cultures was triple that attained with batch cultures. The productivity in batch cultures was negligible (0.002 g/L), whereas fed-batch IgM expression titers reached 0.849 g/L (Figure 3). That increased growth rate and productivity may be attributed to the concentration of glucose in fed-batch cell culture. When glucose levels were n
ot replenished (in batch cultures), SM6-expressing cells entered the stationary phase of their growth cycle more rapidly, reducing productivity. However, daily addition of feed medium (in fed-batch culture) containing 50 g/L of glucose prolonged the exponential phase of the growth curve and enabled cells to reach high cell densities. Nutrient components in feed are key factors to triggering the production of our SM6 monoclonal antibodies.
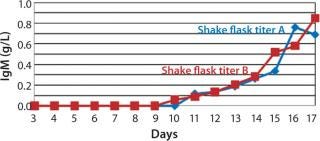
Figure 3: ()
Cell Culture Scale-Up in WAVE Bioreactor Systems: Scalability of cell culture expansion is very important for manufacturing process development. Our SM6 cell scale-up process began with recovery of a vial of SM6 MCB in CDM4PERMAb media supplemented by l-glutamine and Pluronic F-68 solution in a T25 flask at a seeding density of 5.0 × 10⁵ vc/mL. This initial culture was then subcultured sequentially in shake flasks and then Wave Bioreactor systems at the same seeding density every three to four days for seven passages. At passage 7, to generate enough cells for inoculating the bioreactor at a higher seeding density (6.5 ± 0.5 × 10⁵ vc/mL), we seeded the Wave bag at 6.5 ± 0.5 ×10⁵ vc/mL. After the second passage, growth rate and viability of SM6-expressing cells in both shaker-flask and Wave system remained comparable, with VCDs reaching 1.9 × 10⁶ vc/mL in shake flasks and 1.8 × 10⁶ vc/mL in the Wave bag after 72 hours.
Process Evaluation in 12-L Bioreactors: To evaluate the performance of our SM6-producing cell line in fed-batch culture at Laureate—and in an effort to achieve higher titers in a bioreactor—we inoculated a 12-L Applikon glass bioreactor based on previously developed 10-L bioreactor parameters with a modified pH control. Instead of using constant 5% CO2 to the headspace, CO2 was cascaded to pH control and sparged to the culture based on demand.
Our cell culture inoculum expansion process was the same as described above. Data were consistent with the previous Wave study, indicating that during scale-up, four-day splits (rather than three-day) should be performed when culturing in bags.
Before inoculation, the bioreactor was charged with 5.93 L of CDM4PERMAb medium supplemented by l-glutamine and Pluronic F-68 solution and held overnight at 36.0 °C. At the seventh passage (n – 1), we used a total of 1.67 L of cell suspension from the WAVE bag to inoculate the bioreactor, which gave a postinoculation reactor volume of 7.60 L. We ran this bioreactor for 14 days, during which the VCD reached a maximum of 29.7 ×10⁶ cells/mL, with the viability dropping to 70% at harvest (Figure 4).
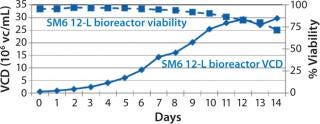
Figure 4: ()
We used a continuous-feed strategy for fed-batch production. The feed consisted of two feed streams: custom feed media and a high-pH amino-acid supplement. Those were initiated when glucose levels dropped
After day 10, when cell densities reached 25 × 106 vc/mL, cell culture growth leveled off. Despite the addition of glucose-containing feed medium and amino-acid supplement at increasing rates, glucose levels could not be maintained at our targeted amount under the high-density conditions that these cultures reached. By day 11, daily glucose reading was 0 g/L before each daily feed, indicating that the cells were consuming all that was fed to them each day (Figure 5). However, even with the steady decline of glucose levels in the culture, cells continued to proliferate and maintain high viability, with lactate levels remaining ∼1 g/L during the final days.
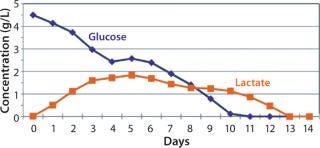
Figure 5: ()
We harvested this bioreactor on day 14 at a viability of 72% (Figure 6). The overall titer for this first 12-L bioreactor was 0.585 g/L (Figure 7), 30% higher than that of the transferred process (0.450 g/L) run at a comparable scale (10 L). The total amount of product recovered from the bioreactor after filtration through two BioCap Cuno depth filters and one 0.2-µm Meissner filter was 60%.
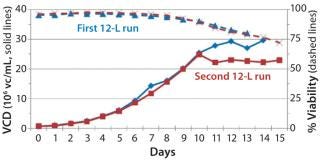
Figure 6: ()
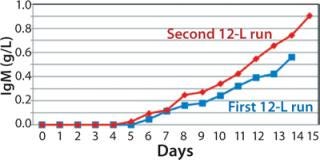
Figure 7: ()
Bioreactor Process Modification: To further improve productivity and make the process more suitable for large-scale
production, we implemented a second 12-L bioreactor with a few modifications to its operating parameters. We increased the feed rate, removed one of two scoping impellers to match the design of our production bioreactor, and extended the run time. Results indicate that those modifications retained cell growth and viability similar to the first 12-L run. Cells reached a maximum VCD of 22.9 ×10⁶ cells/mL with a slightly longer average population doubling time of 48.2 hours from days 1–10 (Figure 6). This culture extended one additional day, with an increase in titer from 0.741 mg/mL on day 14 to 0.904 mg/mL on day 15 (Figure 7).
Despite the increased feed rate, glucose levels could not be maintained at targeted levels from days 9–15; they fell to 1.0 –1.4 g/L from day 9 to day 13 and dropped to 0 g/L by day 15 (Figure 8). However, even with the steady decline in glucose levels, cells continued to proliferate and maintain relatively high viabilities (Figure 7), which dropped to 72% at harvest on day 15. To test scalability, we transferred the process from the second 12-L bioreactor to the 250-L scale.
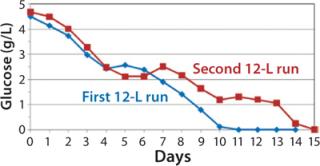
Figure 8: ()
250-L Single-Use Bioreactor (SUB) Production: Our modified fed-batch process for a 250-L Thermo Scientific HyClone SUB system was based on expansion and production procedures used for the second 12-L run. Figure 9 and 10 compare cell growth and productivity of the two runs. The 250-L run ended on day 14 when the cell viability target level of 70% was approached. In this modified process, both cell growth and productivity were better than those in original process. Modifications made to that original process showed no adverse effect on either growth rate or productivity. So this bioreactor process is scalable.
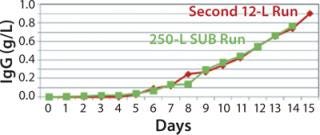
Figure 9: ()
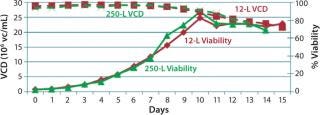
Figure 10: ()
Challenging Clarification
Low Recovery of Primary Clarification with Cell Settling Followed By Depth Filtration: Primary clarification of these PER.C6 cultures presents a challenge based on the high cell densities obtained. Depth filtration can be very challenging even with four hours of cell settling by gravity to preclarify the culture. Recovery after settling was 85% at the 12-L bench-scale and 83% at the 250-L production scale. To process partially clarified harvest collected after settling through two-stage depth filtration, turbidity needed to be <2,500 NTU—nephelometric turbidity units (Table 1). The overall recovery of depth filtration followed by 0.2-µm sterile filtration was 60% at the 250-L production scale, which is in a similar recovery range to the 12-L bioreactor. Greater recoveries probably would be achieved with additional development and introduction of centrifugation to preclarify the harvest before filtration.
Table 1: Recovery of primary clarification at 250-L scale

Table 1: Recovery of primary clarification at 250-L scale ()
Purification
Below we describe the technical transfer of our downstream process, including several process-development initiatives to adapt the process to even larger scale and make further performance improvements. We scaled up our process to the 250-L scale for clinical production. This downstream process (Figure 11) is based on one developed by Gagnon et al (9).
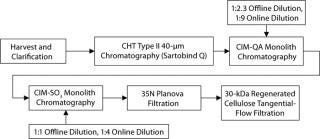
Figure 11: ()
The primary capture step involves a ceramic hydroxyapatite (CHT) column chromatography tied in line with a strong anion-exchange membrane used in flow-through mode. After product loading, we use a static on-column detergent wash with Triton X-100 as a viral-inactivation step. Subsequent washes are executed in a phosphate buffer step gradient based on polyethylene glycol (PEG). At the conclusion of the last wash step, the column outlet is connected to a Sartobind Q membrane, which is equilibrated in that buffer and serves to reduce DNA levels (15).
CHT/Q elution occurs with a 350-mM phosphate wash generally providing high recovery rates. Both urea and PEG are used in the process to stabilize the SM6 protein structure (15). Similarly, two-step dilutions (first offline and then online) minimize the time spent at low-conductivity conditions, which cause aggregation of SM6.
Successive ion-exchange steps involve convective interaction media (CIM) monoliths from BIA Separations (–QA and –SO3 forms) relying on convective flow for mass transfer in the course of their bind-and-elute prot
ocols. That feature is ideal for the IgM class of antibodies, with their large molecular size and slow diffusion constant of ∼2.6 ×10⁻⁷ cm2/s (9). The monoliths’ large channel diameters, lack of void volume, and homogenous polymeric stationary support permit high flow rates for processing (3 CV/min in our studies). Cycling then becomes a viable option to offset hardware costs in manufacturing. Additionally, such flow rates become critical to compensating for the large load volumes created by the on- and offline dilution.
Final formulation of our IgM product is conducted according to standard industry practices. Viral filtration on a 35N Planova nanopore filter followed by final ultrafiltration and diafiltration with a Millipore 30-kDa regenerated cellulose filter. Bulk drug substance target concentrations are currently 5–10 mg/mL.
Process Evaluation at 12-L Bench Scale: We processed two 12-L scale runs as part of our technology transfer and process-development activities. These processes offered an opportunity to evaluate and establish scalable and reproducible processing controls before good-manufacturing practice (GMP)-compliant downstream manufacturing. The most critical parameters revolved around load specification and in-line buffer mixing. Because the CHT–Sartobind Q, Planova, and final tangential-flow filtration (TFF) steps produced predictable and reliable yields, we focused our experimentation on the monolith steps.
First 12-L Run: Large dilution factors we used during the monolith load function serve to reduce the conductivity of the SM6 IgM load solution. Initial load conductivities would have been 20–25 mS/cm. Offline dilution brought that close to the limit of solubility and stability, ∼12 mS/cm. Additional rapid on-line dilution during load permitted binding to the column without allowing the IgM to spend more than a momentary period in a low-conductivity condition.
The first 12-L CIM-QA process scouted a dilution buffer concentration of 20 mM sodium phosphate. The majority of the load did not bind and was retained in the flow-through fraction (Figure 12). Dilution of the flow-through to 10 mM phosphate induced binding, and reprocessing was successful. Subsequent cycles and future processes would proceed with this diluted buffer concentration under strict conductivity parameters. Eluted material was pooled and prepared for the next step.
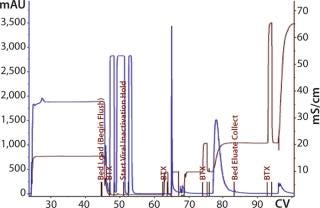
Figure 12: ()
As transferred, the CIM-SO3 step presented no processing issues. Cycle performance at this step was consistent (Figure 13). We noted the load parameters for setting future specifications but did not attempt optimization at this stage. Table 2 summarizes the first 12-L downstream yield data.
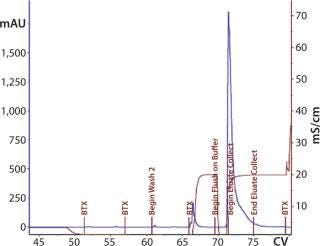
Figure 13: ()
Table 2: SM6 first 12-L downstream yield information
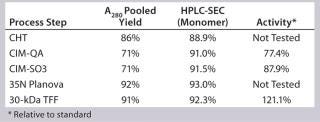
Table 2: SM6 first 12-L downstream yield information ()
Second 12-L Run: During the second 12-L run, we evaluated buffer washes and elution mechanisms for the monolith steps. After loading the CIM-QA step, the column was washed with the equilibration buffer. After evaluating several conditions and mixture ratios, we removed the secondary wash from this process (Figure 14).
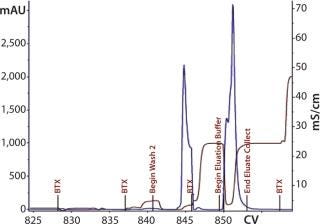
Figure 14: ()
Elution mixture ratios determined through a gradient run would eventually lead to proper buffer mixtures for an isocratic elution scheme. Refining the mixture provided a ratio with appropriate ionic strength to cause target elution while reducing the salt content that could negatively affect load conditions for the subsequent step. With Cycle 3 (Figure 15), we evaluated an elution condition using gradient elution, which indicated that a different mixture was necessary. We actually needed less strip buffer than expected, leading to another processing change for this step.
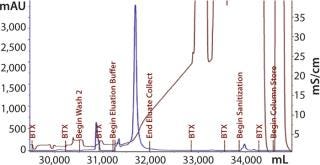
Figure 15: ()
We loaded SO3 Cycle 2 at 62% capacity based on A280 measurement. There were no signs of break-through. Dynamic binding capacity (DBC) of the CIM-SO3 is assumed to be 8 mg/mL.
Our subsequent CIM-SO3 column confirmed results seen in the first run (compare Figure 13 and 16), indicating no adverse effects of the changes made to the preceding CIM-QA step. The process ended with viral filtration and TFF, which were unremarkable. Table 3 lists the step yields. Losses in the CIM-QA step resulted from our attempts to develop a second wash step. During the final 0.22-µm filtration st
ep, some filter clogging led to a lower recovery. Product analyses with reducing SDS-PAGE (Figure 17) indicated that the protein was largely pure by this criterion after the CIM-QA step.
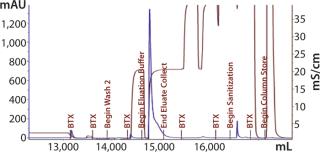
Figure 16: ()
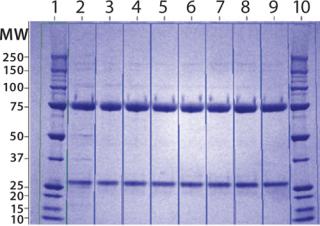
Figure 17: ()
Table 3: SM6 second 12-L downstream yield information
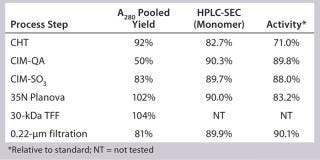
Table 3: SM6 second 12-L downstream yield information ()
Process Evaluation at 250-L Scale: The process format and specifications we determined during our bench-scale runs were successfully scaled up to a 250-L clinical production process. Tables 4 and 5 and Figures 181920 present data from this run. Results indicate that a highly purified IgM can be produced at large scale with >50% overall yield. The quality of the product is equivalent to or better than what was made in development, showing low levels of DNA, host-cell proteins (HCPs), and good potency (Table 4).
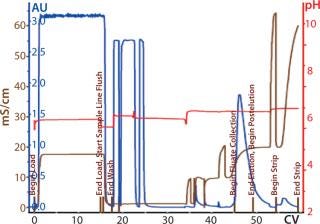
Figure 18: ()
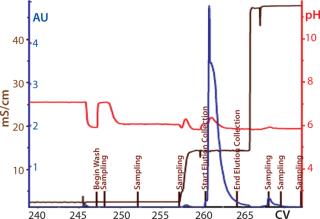
Figure 19: ()
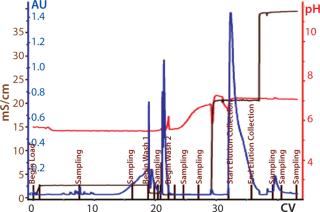
Figure 20: ()
Table 4: 250-L GMP run yields summary
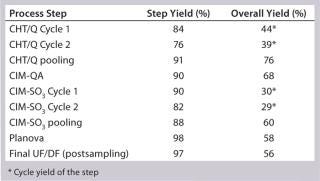
Table 4: 250-L GMP run yields summary ()
Table 6: 250-L GMP run analytics of final drug product
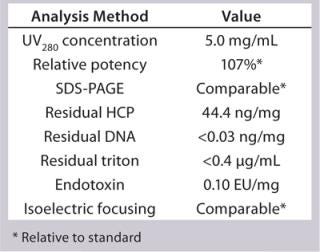
Table 6: 250-L GMP run analytics of final drug product ()
Additional Downstream Process Improvements: Large-volume loads on the monolith columns could be addressed by concentrating the load with TFF. Despite some concerns regarding possible deleterious effects to an IgM from a TFF process, preliminary small-scale data indicate that ultrafiltration ≤4× does not adversely affect the protein. One-step diafiltration is also possible. These early studies are continuing, and larger-scale results will need to be demonstrated.
Laureate transferred column capacities from Patrys without challenging them. A DBC study under run conditions would be insightful to ensuring that this platform process is making the most out of its chromatography steps. Although expeditious cycling is advantageous to the monoliths, it would also be good to reduce processing cycle numbers.
So It Can Be Done
Our production and purification processes for the SM6 IgM antibody were successfully transferred, adapted, and scaled up to a 250-L scale. The PER.C6 cell line grew to high densities, requiring additional settling and filtration steps to clarify the culture harvest. For significantly larger scales, we recommend a continuous centrifuge for clarifica
tion. Our downstream process effectively uses the selectivity of hydroxyapatite supports and high-flow properties of convective monolith media. IgM antibodies thus can be produced and purified for biopharmaceutical application, but they require different strategies than do more conventional and widely used IgG antibodies. The unique advantages of IgM antibodies as therapeutics can be evaluated through application of such manufacturing processes to produce clinical materials.
About the Author
Author Details
Christopher Valasek, MS, is a downstream process development scientist; Joshua Cole is an upstream process development scientist; Pei Ye, MS, is manager of upstream process development; and corresponding author Michiel E. Ultee, PhD, is chief scientific officer at Laureate Biopharmaceutical Services, Inc., 201 College Road East, Princeton, NJ 08540; 1-609-919-3300; [email protected]. Frank Hensel, PhD, is vice president of research and development; and corresponding author Michael A. Conner is vice president of manufacturing at Patrys, Ltd., 343 Little Collins Street, Suite 614, Melbourne VIC 3000, Australia; 1-215-915-4820; [email protected].
REFERENCES
1.) Reichert, JM, and VE. Valge-Archer. 2007. Development Trends for Monoclonal Antibody Cancer Therapeutics. Nat. Rev. 6:349-356.
2.) Vollmers, HP, and S. Brandlein. 2009. Natural Human Immunoglobulins in Cancer Immunotherapy. Immunother. 1:241-248.
3.) Janeway, C. 1989.Approaching the Asymptote? Evolution and Revolution in ImmunologyCold Spring Harbor Symposium of Quantitative Biology 1989, 54:Part 1, Cold Spring Harbor Laboratory, Cold Spring Harbor:1-13.
4.) Medzhitov, R. 2001. Toll-Like Receptors and Innate Immunity. Nat. Rev. Immunol. 1:135-145.
5.) Vollmers, HP, and S. Brandlein. 2002. Nature’s Best Weapons to Fight Cancer: Revival of Human Monoclonal Antibodies. Human Antibodies 11:131-142.
6.) Vollmers, HP, and S. Brandlein. 2004. Natural IgM Antibodies, the Ignored Weapons in Tumor Immunity. Histol. Histopathol. 19:897-905.
7.) Vollmers, HP, and S. Brandlein. 2005. Death By Stress: Natural IgM-Induced Apoptosis. Meth. Findings Experimental Clinical Pharmacol. 27:185-191.
8.) Hensel, F, and P GagnonAn Effective Platform for Purification of IgM Monoclonal Antibodies5th International Conference on Hydroxyapatite and Related Products (Rottach-Egern, Germany, 11–14 October 2009), Frankfurt Am Main, Germany, Dechema.
9.) Gagnon, P, F Hensel, and R. Richieri. 2008. Purification of IgM Monoclonal Antibodies. BioPharm Int.:S26-S36.
10.) Tchoudakova, A. 2009. High-Level Expression of Functional Human IgMs in Human PER.C6 Cells. M Abs 1:163-171.
11.) Cattaneo, A, and MS. Neuberger. 1987. Polymeric Immunoglobulin M Is Secreted By Transfectants of Non Lymphoid Cells in the Absence of Immunoglobulin J Chain. EMBO J. 6:2753-2758.
12.) Cacciuttolo, MA. 1998. Large-Scale Production of a Monoclonal IgM in a Hybridoma Suspension Culture. BioPharm 20.
13.) Lee, J. 2009. Adaptation of Hybridomas to Protein-Free Media Results in a Simplified Two-Step Immunoglobulin M Purification Process. J. Chromatogr. A 1216:2683-2688.
14.) Gagnon, P, F Hensel, and R RichieriIgM Purification, the Next Generation 13th Annual Waterside Conference (Miami, FL, 4–6 February 2008), Williamsburg Bioprocessing Foundation.
15.) Gagnon, P, and F HenselAn Effective Platform for Purification of IgM Monoclonal Antibodies Using Hydroxyapatite5th International Conference on Hydroxyapatite and Related Products (Rottach-Egern, Germany, 11–14 October 2009), Frankfurt Am Main, Germany, Dechema.
You May Also Like


