Cost Analysis of Cell Therapy Manufacture: Autologous Cell Therapies, Part 2Cost Analysis of Cell Therapy Manufacture: Autologous Cell Therapies, Part 2
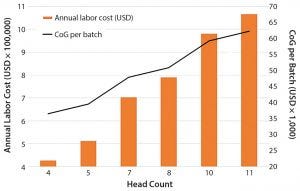
Figure 1: Impact of team head count and labor annual costs for operations and quality personnel on the overall cost of goods (CoG) per batch
In part 2, we continue to analyze manufacturing costs of an autologous cell therapy. A typical process involves the expansion and activation of cells derived from a single patient, which is currently very labor-intensive. To date, there is little published information on overall production costs (1). In part 1, we used a software modeling platform to identify opportunities for potential cost savings. We developed a baseline model of a cell therapy manufacturing process using the production of autologous dendritic cells for immunotherapy. Here we discuss opportunities for cost reduction and costs associated with implementing automation. We also explore strategies for increasing throughput to meet rising demand through the analysis of net present cost (NPC).
Calculations of NPC |
|---|
Assumptions for calculation: Project life = 15 years Real discount rate = 10% Inflation rate = 3% (from year one) |
Opportunities for Cost Reduction
Labor: Based on our cost of goods (CoG) analysis, an area that appears to offer the greatest opportunity to reduce costs is labor. Labor costs included the annual expenditure on an operations team composed of operators and supervisors as well as a quality team with quality assurance and quality control personnel. We assumed that for good manufacturing practice (GMP) operations, two operators would be required for all processing operations, and only one team would be required to work within an eight-hour shift. We conducted a sensitivity analysis to understand the effect of head count on the resulting process CoG (Figure 1).
Given that labor makes up 50% of the overall CoG, it is not surprising that an increase in the head count number resulted in an increase in labor annual costs and a rise in the cost of dendritic cells (DCs) per batch. An increased head count to meet demands of a cleanroom running at full capacity (of 10 personnel, discussed below) would result in a 24% increase in CoG. Decreasing head count below the baseline (total of seven personnel) and to a minimum level — whereby two operators would be in a cleanroom undertaking processing operations, and a supervisor would cover breaks — would reduce cost of DC treatment (per batch) to 36,482 US dollars (USD), which is a 24% reduction of overall CoGs. A reduction of head count to levels below that could be introduced in parallel with the phasing in of automated systems (discussed below).
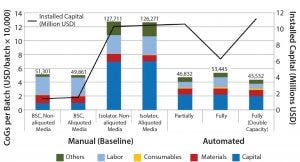
Figure 2: CoG broken down into different categories and installed capital of variations of manual (baseline) and automated process scenarios; manual process (baseline) with aliquoting of media, and using isolators instead of biosafety cabinets; partially and fully automated systems, and fully automated systems with a double throughput capacity, increasing batch numbers from 50 to 100
The second area where cost savings could be attained is in the materials category. Even if relatively small quantities of solutions and components (e.g., media and buffers) are used during a process (microliter to milliliter level), their high cost invariably will increase greatly in parallel with scale. Subaliquoting media and components to meet process requirements (e.g., preparation of media kits by subaliquoting into smaller containers) showed savings of about USD 1,450 per batch (Figure 2) and a reduction in noncontaminated waste by 13 L per batch (data not shown). Additional equipment was added to the model to provide a qualified area to conduct media subaliquoting, but the extra labor associated with such activity was assumed to be negligible.
Closed Processing: Capital Investment and Floor-Space Requirement
For autologous therapy manufacture, each patient’s own cells constitute one batch. Thus manufacturing requires dedicated equipment and separate cleanroom processing suites to separate each patient-specific product. That assumes that a process is not closed, so each batch must be segregated to prevent cross contamination that may result from open manipulations.
Because of the nature of open manipulations (typically undertaken in a biological safety cabinet under a grade A environment), a high-grade cleanroom is required, typically grade B. Implementing isolators dedicated to one product or patient and/or using automated closed systems alongside single-use fluid paths would allow processes to be fully enclosed. That approach reduces surrounding cleanroom classification to grade C. But it requires standard disposable manipulation methods for connection and disconnection of single-use assemblies (e.g., tube welding and sealing).
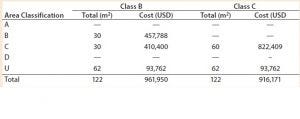
Table 1: Facility area estimates by area classification and associated costs for the baseline process; use of closed systems (e.g., isolators, automated systems) and the effect of processing cleanroom grade reduction from B to C
We evaluated the effect of replacing biosafety cabinets by isolators to reduce area classification requirements from B to C for the baseline process (Table 1). Assuming no changes on process areas footprint derived from addition of alternative (bigger) equipment, this change equates to a total savings of 45,779 USD in the costs of the facility building alone. When the effective isolator equipment footprint and the higher cost of these types of equipment are taken into consideration, however, there is a significant increase by 8.9 million USD in upfront total capital investment required to move from a grade B environment to grade C processing suites. The high capital cost associated with such types of equipment and associated maintenance is reflected in an increase in CoGs by 76,410 USD (Figure 2).
Partial or Full Automation?
Because labor represents the main component of cost, automated systems were introduced into our process to address challenges such as elevated headcount, operator error, product inconsistency, and risks of contamination. Automation covered in this study is achieved with the implementation of dedicated equipment that mimicked more efficiently and reproducibly one or a combination of manual steps within a closed environment.
Several vendors provide fully automated and closed systems suitable for cell therapy applications. A few examples are the Sepax (BioSafe SA), PureCell Selectl (Pall Corp.), COBE 2991 Cell Processor (Terumo BCT), and the RoboSep (StemCell Technologies) systems that all can be used for clinical-scale selective cell isolation and automated washing. Others include the Quantum Cell Expansion System (Terumo BCT), Cocoon (Octane Biotech), DynaMag CTS (Life Technologies), and the CliniMACS (Miltenyi Biotec) that all can be used as a programmable automated cell separation, washing, expansion, and concentration platform. Suitable automated closed systems can replace manual operations to achieve partial or fully automated processes (Table 2, green boxes).
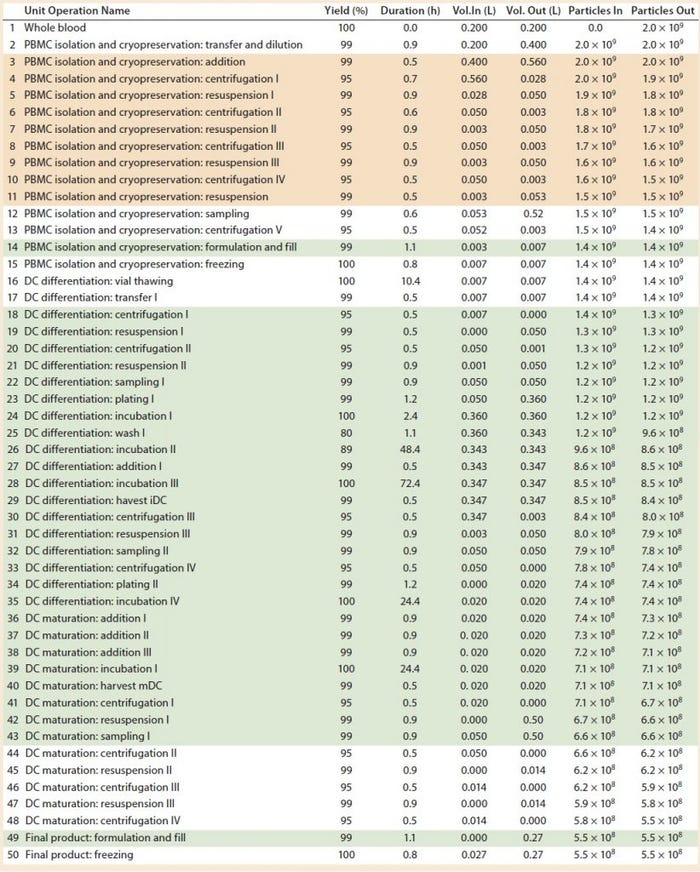
Table 2: Baseline process details and areas where varying levels of automation were implemented. (Tan boxes = partially automated process, green boxes = fully automated process, particles = cell count, DC = dendritic cell)
However, several devices are needed to undertake different stages of such a process, including those for cell isolation, expansion and incubation, and concentration and wash. In our study, we assumed that to achieve a partially automated process, the PBMC isolation (steps 3–11) and DC differentiation (steps 44–48) manual steps from the baseline process should be replaced by automated systems. The fully automated process consisted of the previously automated PBMCs isolation (steps 3–11) and combined DC differentiation and maturation steps (steps 18–48) using a culture expansion platform. For a fully automated process, we replaced manual filling operations (step 14 and 49) with a filling pump.
We assumed both partial and fully automated processes to have a similar failure rate (see “Assumptions” box) to that of current biologics manufacturing processes of 3% (2). That assumption is based on the fact that introducing automation reduces by 3.3 times the number of manual interventions of a baseline process and associated increased risk of failure for autologous cell therapy manufacturing. Implementation of closed systems also contributes to reduced failure rate.
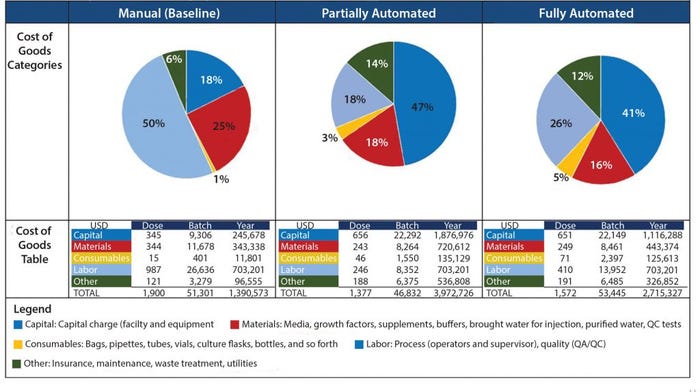
Figure 3: Summary of COG breakdown per process
When evaluating CoG resulting from the application of different automation levels to the baseline process, fixed costs become more dominating in the CoG breakdown (Figure 3), with the main cost drivers becoming capital (41–47%) followed by labor (18–26%). The scenario that was the most favorable was the partly automated process achieving a cost per patient of 46,832 USD. Even though that process required a higher initial capital to install the manufacturing facility (10.6 million USD) than both baseline and fully automated scenarios, the flexibility it provided resulted in a higher throughput of 84 batches per year (Table 3).
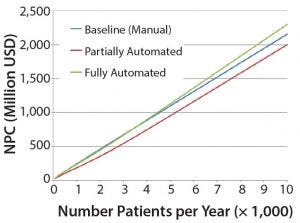
Figure 4: Net present cost (NPC) of manual (baseline), partially automated, and fully automated processes with or without increased (double) capacity
The higher cost of labor per batch for the fully automated process was driven by the smaller number of batches attained (50 batches per year), which resulted in higher cost per batch/patient. Being fixed costs, capital and labor requirements depended heavily on the number of batches generated per year. For a fully automated process to become competitive, a greater number of automated systems would be required to enable parallel processing and to remove bottlenecks. In that scenario, doubled capacity (e.g., 100 batches per year) would increase initial capital investment to 11.3 million USD and lower the cost per patient (per batch) further to 43,532 USD (Figure 4). In that instance, the fully automated process would become the most competitive scenario.
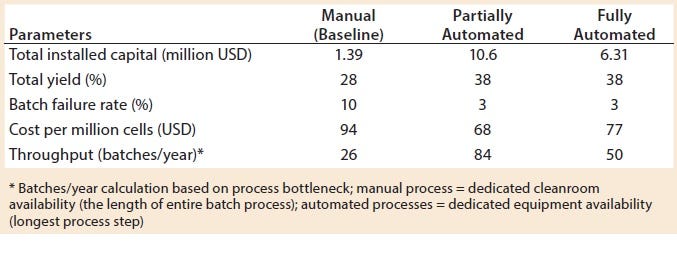
Table 3: Key process metrics
Increasing Throughput to Meet Rising Demand
Besides CoG analysis, potential commercial value of a cell therapeutic opportunity can be evaluated further to understand the interplay among initial capital investment, operating costs, and amount of product generated annually across a product’s lifecycle. The effect of these factors can be taken into account by calculating NPC, which has been used to provide a quantitative understanding of financial benefits. NPC evaluation also aids in selection of technologies for evaluation and/or further development toward implementation in monoclonal antibody manufacturing (3).
The most favorable financial option will correspond to the manufacturing process, option, or technology that achieves the lowest NPC value. In our study, we calculated NPC (see “Calculations” box) for the three manufacturing processing options (baseline, partial, and fully automated processes) and used those calculations in making investment decisions as a product moves through clinical phase changes and as additional capacity is built.
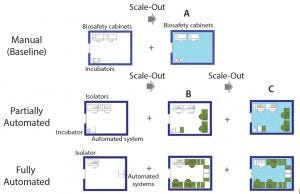
Figure 5: Scale-out approach of manual (baseline) and partially and fully automated processes; (A) additional processing suite containing required equipment; (B) increase in the number of equipment within the same processing suite (green) until maximum amount is reached; (C) additional processing suite (light blue) and associated equipment to achieve maximum throughput
The cell therapy process must be developed with scalability at the outset. The setup used to manufacture the phase 3 material is the one that is used for commercial manufacture. With that in mind, our study included alternative scale-up/scale-out approaches, depending on manufacturing model (manual or automated) (Figure 4).
We assumed the same processing suite area for each manufacturing model. We increased production capacity by increasing the number of equipment up to a maximum quantity (Figure 5B) as well as adding new processing suites (Figures 5A and 5C). A processing suite operating with the maximum number of equipment would have an increase in personnel by two operators and one QC analyst (see “Assumptions” box).
Assumptions |
|---|
All ProcessesStarting material: whole blood 1 × 10¹⁰ cells/mL (7)Dose: 2 × 10⁷ cells (7)Team: three operators, one supervisor, one quality assurance (QA), two quality control (QC)Media preparation: “per step” basis |
Manual Process (Baseline)10% batch failure rateOpen manipulation undertaken in biological safety cabinet (background B cleanroom)Equipmenta comprises two biosafety cabinets (BSC) and two incubatorsMedia prepration not subaliquoted |
Automated Processes3% batch failure rateNo open manipulations, closed system used throughout; all operations undertaken in isolator or automated system (background C cleanroom)Equipment partially automateda: two isolators, one automated system, one incubatorEquipment fully automatedb: one isolator, two automated systems, one incubatorMedia preparation subaliquoted |
ª Other equipment comprises benchtop centrifuge, water bath, controlled-rate freezer, pipettes, laminar-flow hood (QC), nucleocounter, refrigerator, liquid nitrogen storage, balance, freezer, autoclave.b Equipment used exclusively for automated processes includes tube welder, tube sealer, and buffer/media preparation station. |
For example, scaling up the manual process (baseline) could be done only by scaling out additional processing areas. Because of the use of open manipulations, dedicated processing rooms are required for each batch. And because one processing suite is dedicated to a single patient (batch) at a time, the number of batches that can be achieved is based on availability of processing rooms. In this case, the personnel required within a team was kept the same throughout scale-out.
For automated processes, scale-up can be achieved by first increasing the number of dedicated equipment (e.g., isolators and automated systems). At maximum equipment capacity, we assumed that additional personnel (as specified above) would be required. When the maximum capacity of a processing room is reached, then scale-up is achieved by acquiring a new processing suite. In this case, one piece of equipment rather than the processing suite is dedicated to the product of one patient at the time, which provides more flexibility. For example, for 80 patients in a phase 1 clinical trial, you would require three cleanroom facilities based on a manual (baseline) process to separate each patient batch. For automated systems, only one cleanroom suite would be required, with an increased number of equipment (for fully automated process only).
We applied this scale-up/scale-out approach to build additional capacity as each process moved through clinical phases 1–3 until product launch and manufacture as well as to calculate NPC as a function of the number of patients per year (Figure 4).
Figure 4 shows that the partially automated system configuration allows for greater flexibility to increase capacity within a manufacturing facility and thus resulted in more favorable economic analysis (through CoG analysis and NPC evaluation). Although more capital was needed up front, operating cost savings and the flexibility to manufacture many products within the same processing suite both reduced NPC.
The manual process was the most expensive option mainly because of its dependence on scale-out of processing rooms to meet increasing capacity demand. That approach increased costs proportionally with increased capacity requirements. It also showed the limitations of GMP facilities with many separated processing suites, particularly when moving toward commercial manufacture. For example, in a 1,000-m2 baseline facility containing five clean rooms, about 130 cell therapy products can be generated per year. By contrast, the same facility with two to eight automated systems in each processing room could process from 250 to 1,680 different cell therapy batches (depending on automation level), with similar personnel, lower cleanroom requirements, and reduced costs.
To supply a cell therapy product to 3,000 patients per year, using any level of automation provides 1–19% savings when compared with the baseline (manual) model. Because processes are scaled up to meet a higher demand of 10,000 patients per year, the fully automated scenario became a less attractive proposal with an increased NPC compared with the baseline. But the partially automated scenario presented cost savings total of 7% when compared with the baseline, making the partial automation option the most attractive investment proposal to meet projected patient demands throughout a product’s lifecycle, under current assumptions.
Importance of Effective Cost Models
Autologous cell therapy is at an early stage of development in terms of manufacturing technologies. To secure a sustainable commercial future, the economics of cell therapy processes must be evaluated taking process scalability into account.
Here we highlighted the value of building cost models as dynamic tools for cost estimation of platform processes. Using the Biosolve Process cost model, sensitivity to key process parameters as well as savings associated with the implementation of alternative technologies such as automated systems can be quantified.
Introduction of automated systems is an attractive option within cell therapy manufacturing. Manipulation and operational platforms that were fully closed systems allowed for increased capacity through parallel manufacture of multiple patient batches in the same process suite, lowering the needs in terms of cleanroom environment and facilitating patient scheduling and availability. Such approaches greatly reduced fixed costs as the product moved toward commercial production.
Having a cost model enabled identification of a suitable automation strategy for a cell therapy product. This approach can be undertaken for a number of existing cell therapy processes, each with different requirements (e.g., cell types, process stages, equipment requirements, and media costs). Tailored models can be built to estimate process costs accurately.
Unlike traditional drugs, cell therapies might need to be produced on demand. Using a dynamic cost model will enable manufacturers to evaluate the implementation of suitable alternative technologies, estimate costs associated with increased demand for product and future capacity requirements, and achieve the process flexibility required for scale-up/scale-out.
Other factors should be considered when developing novel cell-based therapeutics, especially those that are patient dependent: number of cells of a starting process, titers reached during expansion process, and course of treatment for patients. Cost modeling the process allows an impartial evaluation of those factors, which in turn enables manufacturers to conduct feasibility assessments on the viability of alternative technical and process options. Sensitivity analysis can be used to assess risks associated with those options. By conducting such assessments early on in development, companies can better manage cost and risk, driving out expenses and focusing development efforts.
References
1 Lopes AG, Sinclair A, Frohlich B. Cost Analysis of Cell Therapy Manufacture: Autologous Cell Therapies, Part 1. BioProcess Int. 16(3) 2018: S3–S8.
2 Langer ES. Biotech Facilities Average a Batch Failure Every 40.6 Weeks. BioProcess Int. 6(8) 2008: 28–30.
Adriana G. Lopes is principal consultant engineer at Biopharm Services. Corresponding author Andrew Sinclair is managing director at Biopharm Services Ltd. Unit 1, Chess Business Park, Moor Road, Chesham Bucks HP5 1SD, UK; +44-1494-578-011; [email protected]. Bert Frohlich is principal consultant and owner at Biopharm Designs (Boston, MA).
You May Also Like


