Worldwide Biopharmaceutical CMO Capacity AnalysisWorldwide Biopharmaceutical CMO Capacity Analysis

HTTPS://STOCK.ADOBE.COM
Contract manufacturing organizations (CMOs) are a core part of the biopharmaceutical industry, with commercial manufacturing making up about a third of marketed products. Here we examine worldwide CMO biopharmaceutical manufacturing (bioprocessing) capacity, concentrating on “mainstream” CMOs — defined as those providing primarily mammalian cell culture or microbial fermentation services for manufacture at any scale of proteins and antibodies. This analysis follows our recent article examining worldwide bioprocessing capacity status and trends (1).
Survey Methodology |
|---|
The 2018 15th Annual Report and Survey of Biopharmaceutical Manufacturing Capacity and Production yields a composite view and trend analysis from 222 responsible individuals at biopharmaceutical manufacturers and contract manufacturing organizations (CMOs) in 22 countries. The methodology also included more than 130 direct suppliers of materials, services, and equipment to this industry. This year’s study covers such issues as new product needs, facility budget changes, current capacity, future capacity constraints, expansions, use of disposables, trends and budgets in disposables, trends in downstream purification, quality management and control, hiring issues, and employment. The quantitative trend analysis provides details and comparisons of production by biotherapeutic developers and CMOs. It also evaluates trends over time and assesses differences in major markets in the United States and Europe. |
We highlight CMO-related results from BioPlan Associates’ 15th annual Report and Survey of Biopharmaceutical Manufacturing, which includes responses from 222 biopharmaceutical developers/ manufacturers and 130 bioprocessing suppliers or vendors. In our 2018 survey, more than half (56%) of bioprocessing professionals surveyed reported that their facilities outsource at least some bioprocessing, with 19% outsourcing more than half of their manufacturing operations (2).

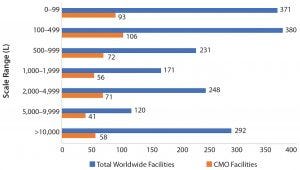
Figure 1: Number of total facilities and CMO facilities per bioprocessing capacity scales
Mainstream bioprocessing CMOs do not include specialists such as primarily fill–finish or cellular and gene therapy CMOs or those that are mainly expression system developers offering some CMO services. Capacity data are derived primarily from BioPlan data included in our online Top 1,000 Biopharmaceuticals Facilities Index, which worldwide now includes >1,550 bioprocessing facilities (3).

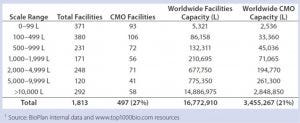
Table 1: Total and CMO facilities and capacity by bioprocessing capacity scales
Capacity Distribution Among CMOs
Figure 1 and Table 1 show bioprocessing facilities and capacity worldwide and the CMO subset by facility capacity ranges. As expected, in numerical terms, most facilities tend to have lower capacity, with a large portion — 751 (41%) of the total, and 178 (36%) of CMO facilities — having <500-L capacity. These facilities support primarily R&D and early trials manufacturing. Facilities with ≥2,000 L capacity, those more likely to be performing some good manufacturing practice (GMP) commercial products manufacturing, include 660 (36%) total facilities and 169 (34%) CMOs. In general, about a third of all facilities and CMO facilities are probably involved in some commercial-scale manufacturing.

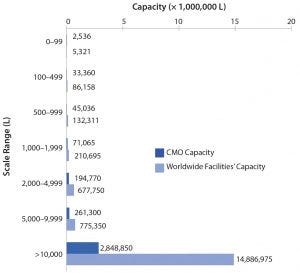
Figure 2: Distribution of total and CMO facilities by facility capacity ranges
Figure 2 shows that few CMOs are performing primarily commercial manufacturing, but they hold very disproportionate capacity (and revenue, and often many other parameters). About 20% of CMO facilities at ≥5,000 L capacity hold 90% of CMO capacity. The 58 (12%) largest CMO facilities with capacities ≥10,000 L (each) have an average capacity of ~ 50,000 L, and they collectively hold 82.5% of CMO capacity. With most larger CMO facilities owned by a few large CMOs or parent companies, the concentration of CMO capacity in terms of ownership is even greater than for capacity overall. Nearly all CMO capacity at ≥2,000 L involves fixed stainless-steel equipment.
Nearly two-thirds of CMO facilities at ≤2,000 L generally do not support the full development lifecycle, particularly late-stage or commercial products manufacturing. Rather, these small CMOs mostly handle only earlier development phases. Their services typically end before the usual scale-up and finalization of commercial manufacturing that starts at GMP production of supplies for phase 3 testing. Thus, many mid- and small-scale CMOs currently support early to middle phases of product development.
CMOs with capacities in the 1,000–2,000 L range generally find these volumes insufficient to handle most late-phase and commercial-product manufacturing needs. Having 5,000 L ± 3,000 L (or more) capacity at GMP now is the entry level for commercial manufacturing. Such scales are the minimum required capacities generally needed to support a small or mid-sized CMO graduating into the CMO major leagues (those providing commercial manufacturing services).
The split between mammalian and microbial capacity (both overall and among CMOs) is estimated at ≥66% mammalian, primarily CHO, and ≤33% microbial, primarily classic Escherichia coli.

Table 2: Regional distribution of bioprocessing and CMO facilities, total and average capacity
Regional Distribution of CMOs
Table 2 lists the regional distribution and average capacity of all facilities and CMO bioprocessing facilities. The United States/North America, Europe, and Asia/rest of world comprise 35%, 37%, and 17% of global CMO capacity, respectively.
Although the United States/North America has the most facilities, the average CMO capacity in this region is lower than that in Europe and Asia/rest of world. The United States has a much larger number of small-capacity CMOs supporting R&D and early trials, with the United States the overall leader in biopharmaceutical R&D. CMOs in Europe and Asia tend to be more involved in commercial manufacturing; fewer are supporting R&D. Eventually, we expect Chinese CMOs to grow in size and sophistication. And we expect them to begin offering commercial GMP manufacturing services to Western clients (4–6). The Chinese CMO sector, in particular, is likely to grow rapidly to meet more of China’s domestic market needs for biopharmaceuticals. In Asia, CMO commercial manufacturing primarily involves biogenerics for domestic distribution and/or sales in lesser- and nonregulated international commerce.
Growth Is Constant, But with Few New CMOs
Growth is common and constant for bioprocessing CMOs. It is generally required in terms of staffing, technical and regulatory expertise, infrastructure, and so on. Besides needing to expand as client projects advance in manufacturing scale (and presumably, as more clients and projects come in), CMOs invest in expansions, whether internally and/or by mergers and acquisitions (M&As). One characteristic of leading CMOs (in terms of capacity, revenue, and profits) is use of their large size and investments to dominate the field — particularly commercial manufacturing — including acquiring complementary (competing) CMOs.
Bioprocessing CMO growth by M&A has long been common, but it has accelerated in recent years such that now relatively few small and mid-sized CMOs remain and fewer, hardly any, present realistic M&A targets. Many CMOs of all sizes have been M&A targets already, with essentially every current large-capacity CMO having performed at least some major M&As. With so many CMOs acquired, the bioindustry has a shortage of further M&A targets. Only a few good-sized (e.g., ≥1,000 L capacity) CMOs are not part of much larger companies such that they conceivably could be M&A targets.
Contributing to the shortage of new and small- to mid-sized mainstream CMO facilities, very few new ≥1,000-L mainstream CMOs have come online over the past five years in the United States and Europe. M&As have been preferred over internal expansions by CMOs seeking significant expansion. No new mid-sized mainstream CMOs have come online. Many CMOs have started up in recent years, but they are nearly all smaller specialist companies, exemplified by the emergence of more than 100 cellular and gene therapy CMOs.
The entry of biosimilars into world markets is increasing projects for CMOs. Many CMOs have reported a nearly 15% increase in business because of biosimilars. More than 1,000 biosimilars are in development, and more than 250 companies are involved with those products (7). With their inherently smaller markets (because multiple biosimilar manufacturers are competing against each other as well as with reference products), biosimilars typically have smaller capacity needs. As scale decreases, their costs of manufacturing must also be minimized. That makes these products good prospects for outsourcing (8, 9).
CMO Revenue
Historically, biopharmaceutical CMO sector revenue has tracked closely with the revenue of the biopharmaceutical industry, growing at a ≥12% rate (10). CMOs are a core part of the industry, so this tracking of parent industry growth is fully expected. Current worldwide bioprocessing CMO revenue is about US$3.5 billion. Total pharmaceutical CMO revenue is $40 billion, 8.8% of which is bioprocessing CMO revenue. CMOs serving the pharmaceutical industry (chemical or biotechology active pharmaceutical ingredients manufacturing) constitute a much larger business than bioprocessing CMOs.
Commercial manufacturing is more profitable than precommercial CMO services. Markups or profit margins for CMOs generally are in the 20–40% range, with smaller companies generally in the lower range and larger ones (particularly commercial manufacturing) in the higher range. Increased margins are with commercial manufacturing, so the concentration of revenue at the top is even somewhat higher than with capacity.
CMOs Classed by Size
Bioprocessing CMOs have been classified as either small, mid-sized, or large, based on revenue, which closely correlates with capacity. The concentration of revenue at the top is even greater than that of capacity. CMO profit margins generally are higher for commercial manufacturing than for earlier phase manufacturing. Commercial processing is conducted at much larger scales and generally goes on for a decade or more. It provides opportunities for economies of scale and optimization, further increasing CMO profits.
Large CMOs: The very largest CMOs now include mostly old and established companies and a few totally new ones (e.g., Celltrion and Samsung). These companies generally have bioprocessing revenues ≥$150 million/year and capacities >25–50,000 L, often much more. Most of their capacity comes in the form of multiple ≥10,000-L bioreactor-based stainless steel process lines.
Mid-Sized CMOs: A second tier of just over a dozen mainstream US and European CMOs each operate primarily in the ~$30–$150 million/year revenue range. Most have total capacity in the 2,000–12,000-L range. However, mid-sized CMOs have been M&A targets, and relatively few are still independent instead of being part of a much bigger CMO or company.
Small CMOs: The third tier comprises a relatively large number of smaller mainstream (rather than specialist) US and European CMOs, with annual revenues generally ≤$25–$30 million/year. Most of them lack large-scale GMP manufacturing capacity and expertise. And many of them are small, with ≤$10 million/year revenue, including most of the >150 CMO facilities estimated to have ≤100-L total capacity. Small CMOs can provide some GMP early trial supplies manufacturing, but many of them do not seek to attain GMP status. Such companies concentrate on providing small amounts of drug substance for discovery, screening, R&D, and/or preclinical testing.

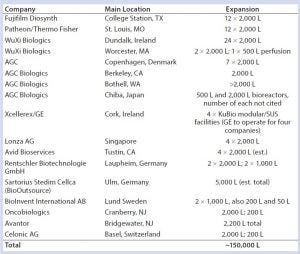
Table 3: Some recently announced US/EU CMO SUS-based commercial-scale expansions and new facilities
CMOs Adding SUS Commercial Manufacturing
A growing number of established mainstream bioprocessing CMOs are adding commercial manufacturing capacity involving single-use system (SUS) bioreactors in the ≥1,000– 2000-L range, with generally one or more 2,000-L bioreactor-based process lines (Table 3). This is in addition to a large number of specialized (nonmainstream) CMOs coming online, most of them cellular and gene therapy facilities. Despite that, we report a significant and worsening “capacity crunch” in the cellular and gene therapy sectors (9).
There is currently or soon will be increased demand for access to SUS CMO facilities, with available GMP manufacturing capacity minimally in the 5,000-L ± 3,000-L range. Much of that SUS capacity is to replace fixed stainless steel — often ≥10,000 L bioreactor-grounded manufacturing facilities. Different biopharmaceutical industry trends are supporting that: Bioprocessing productivity (titers and yields) is projected to increase steadily (10). And new SUS continuous bioprocessing (including perfusion and chromatography) soon will further increase bioprocessing productivity and allow more CMOs to become commercial-products manufacturers.
References
1 Rader RA, Langer ES. Worldwide Biopharmaceutical Manufacturing Capacity Analysis: Growth Continues Across the Board. BioProcess Int. 6(9) 2018: 20–25.
2 Langer ES. Report and Survey of Biopharmaceutical Manufacturing and Production. BioPlan Associates: Rockville, MD, April 2018.
3 Rader RA, Langer ES. Top 1,000 Biopharmaceutical Facilities Index. BioPlan Associates: Rockville, MD; www.top1000bio.com.
4 Xia VQ, Yang LC. Demand for Capacity Drives China’s Biomanufacturing Expansion. BioProcess Int. 16(6) 2018: 36–40.
5 Langer ES, et al. Advances in Biopharmaceutical Technology in China, 2nd ed. BioPlan Associates: Rockville, MD, October 2018.
6 Xia VQ, et al. Directory of Top 60 Biomanufacturers in China. BioPlan Associates, February 2017.
7 Rader RA. Biosimilars/Biobetters Pipeline Directory. BioPlan Associates: Rockville, MD; www.biosimilarspipeline.com.
8 Rader RA. Biosimilars and Biobetters: Impact on Biopharmaceutical Manufacturing and CMOs. Biosimilars of Monoclonal Antibodies: A Practical Guide to Manufacturing, Preclinical, and Clinical Development. Liu C, Morrow J. John Wiley and Sons: Hoboken, NJ, 2016.
9 Rader RA. Biosimilars Paving The Way for Cost-Effective Bioprocessing. Biosimilar Development, 23 August 2017.
10 Rader RA, Langer ES. Thirty Years of Upstream Productivity Improvements. BioProcess Int. 14(2) 2015: 10–14.
Ronald A. Rader is senior director of technical research at BioPlan Associates. Eric S. Langer is president and managing partner of BioPlan Associates, Inc., Rockville, MD; 1-301-921-5979; [email protected]; 1-301-921-5979. www.bioplanassociates.com.
You May Also Like


