Comparing H1N1 Virus Quantification with a Unique Flow Cytometer and Quantitative PCRComparing H1N1 Virus Quantification with a Unique Flow Cytometer and Quantitative PCR
September 1, 2011
A novel influenza A (H1N1) virus was discovered in Mexico in early 2009 (1). Infections from this strain led to declaration of a pandemic midyear, with about 61 million patients and 13,000 deaths reported by the US Centers for Disease Control (2). Although the pandemic officially ended in August 2010 (3), vaccines are still in demand to protect people against the H1N1 strain that is now expected to circulate seasonally for years to come. To best respond to pandemic outbreaks and annual composition changes, the vaccine industry must be able to produce large quantities of product in a short amount of time (4). New methods for culturing, clone screening, scale-up, and production require analytical methods that can rapidly quantify virus to ensure enhanced productivity. Ideal new virus quantification methods would be fast, precise, robust relative to a wide range of viruses, and would correlate well with established methods (5).
Established methods for influenza virus quantification include viral plaque titer assays, tissue culture infective dose (TCID50) assays, fluorescence focus assays (FFAs), transmission electron microscopy (TEM), and quantitative real-time polymerase chain reaction (qPCR) technology (6). Plaque assays, TCID50, and FFA measure infectious counts, TEM provides total viral particle counts, and qPCR measures total genome copy numbers. Relative errors associated with the plaque assay have been shown to be 10–100%, whereas TCID50 has about a 35% error (7,8). The immunofluorescence FFA assay is useful for cell lines that do not exhibit detectable cytopathic effects, but it requires target-specific antibodies (9). Infectivity assays provide invaluable results, but they are time consuming as well as reagent and personnel-intensive.
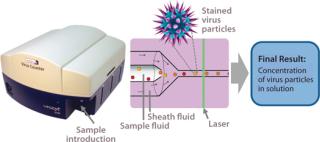
Two primary “physical” methods are used to quantify viruses: TEM and qPCR. Transmission electron microscopy has been used for a number of years and is conceptually straightforward, with results determined from the number, shape, and size of imaged virus particles on a flat surface. But TEM is expensive, its sample preparation is tedious, and the technique requires a skilled operator (10). Quantitative PCR has emerged relatively recently as a useful tool for use with some viruses. Once a well-characterized primer set has been developed, it can be used to quantify the viral nucleic acid concentration of a sample within a matter of hours (11). In addition, qPCR can analyze low virus concentrations due to nucleic acid amplification, and it has been shown to successfully quantify numerous viruses: influenza A and B (12), baculovirus (13,14), hepatitis B virus (15), human immunodeficiency virus (16), and dengue fever virus (17). However, qPCR also requires a skilled operator, and it suffers from myriad potential causes of failure and contamination (18). Given influenza’s susceptibility to mutation, PCR primer design is potentially a problem. Genetic change in the priming region could necessitate primer redesign for accurate results over time (19).
Efforts continue toward improving existing assays (20,22), and new analytical methods for virus quantification are being developed to supplement those methods and overcome their limitations. Emerging methods must be evaluated relative to the standard techniques to compare precision, linear dynamic range, and time savings. One new possibility is flow cytometry, which offers the benefit of rapid sample analysis (23). Although this technology traditionally has been used for quantifying surface and intracellular antigens or nucleic acids (24), it has been used in virus quantification by detecting influenza A virus infection of Madin Darby canine kidney (MDCK) cells (25). But the researchers — and nearly all current flow cytometry applications for virus quantification — used indirect detection and quantification of infected cells rather than virus particles. InDevR’s Virus Counter (VC) flow cytometer was designed specifically to directly quantify virus particles.
The specialized VC system capitalizes on the benefits of flow cytometry while providing a sensitive detection system that directly quantifies virus particles following a universal staining preparation step (26,27). Other flow-cytometry–based virus quantification protocols require expensive antibodies and a virus-specific, multistep staining protocol that takes hours to perform (23). By contrast, the one-step VC staining process requires only a 30-minute incubation period using inexpensive, commercially available dyes that are nearly universal for all viruses. Once instrument settings have been determined, analysis time is
This instrument quantifies the total number of virus particles per unit volume, which is similar to TEM results. In a VC assay, intact virus particles are quantified in suspension using fluorescence to detect particles with colocalized proteins and nucleic acids. A Combo Dye reagent — consisting of one dye specific for proteins and one specific for nucleic acids — is used to stain samples regardless of virus type. The instrument quantifies virus particles per milliliter (vp/mL) based on the number of events occurring simultaneously in two distinct fluorescence channels and a measured sample flow rate (27,28). Figure 1 is a partial screen capture from InDevR’s Virus Counter software, which shows an example of the raw data obtained during VC sample analysis. The software displays photomultiplier tube (PMT) fluorescence signals for protein (red) and nucleic acid (blue) channels in the top and bottom panels, respectively displaying 3 ms and 75 ms segments of data. Threshold values (shown as overlapping horizontal lines in the top panel), are used to discriminate virus events from background noise and signal.
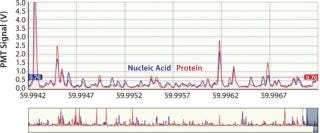
Figure 1: ()
Here we
compare the VC system with qPCR using influenza A/H1N1 samples to evaluate the new instrument and assay’s suitability as a rapid alternative for influenza virus quantification.
Materials and Methods
Sample Preparation: We purchased frozen, purified, swine-origin influenza A/California/4/2009 (H1N1, 10-280-500, lot #9K0019) from Advanced Biotechnologies, Inc. of Columbia, MD. The virus stock came as a suspension in Dulbecco’s phosphate buffered saline (DPBS) at pH 7.2 with a manufacturer-reported concentration of 3.16×10⁶ TCID50/mL and 1.6×10¹⁰ vp/mL (as determined by TCID50 assay and TEM, respectively).
We prepared H1N1 dilutions for both the Virus Counter and qPCR methods using InDevR’s Sample Dilution Buffer (SDB) matrix: from 50-fold to 2.5×10¹¹-fold from the stock. For each dilution, we prepared 300-µL samples for VC analysis and 600-µL samples for qPCR analysis. Each dilution was analyzed in triplicate (n = 3), with VC analysis performed on a single day by one operator with a single instrument and qPCR analysis performed by one operator on a single instrument over a three-day period (replicate analyses on three consecutive days). We ran both negative and positive controls in addition to the prepared samples for both assays.
Virus Quantification By qPCR: Each 600-µL sample was divided into three 200-µL aliquots to allow for triplicate analysis (Table 1). For nucleic acid extraction of all specimens, we used a MinElute virus spin kit on the QIAcube automated nucleic acid extraction system (both from Qiagen in Valencia, CA) using 200 µL of starting material and a 60-µL elution volume. All other steps were performed according to the manufacturer’s recommended protocol, and we subsequently stored the extracted nucleic acid at –80°C until use. Our experiments used InfA primers and probes from Biosearch Technologies (Novato, CA) as described in the CDC protocol covering real-time RTPCR for Influenza A (H1N1) (29). We used a Stratagene Mx3005p real-time PCR thermal cycler from Agilent Technologies (Santa Clara, CA). Briefly, reactions are prepared using a SuperScript III Platinum One-Step qPCR kit with ROX from Invitrogen (Carlsbad, CA) according to the recommended protocol in a template-free area with 5 µL of extracted nucleic acid used as a template.
Table 1: Summary results for Virus Counter (VC) and qPCR methods
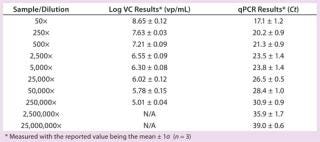
Table 1: Summary results for Virus Counter (VC) and qPCR methods ()
We collected fluorescence data on both the FAM and ROX channels, with the ROX channel measuring fluorescence of the ROX reference dye provided premixed in the reagent kit. We included a positive control specimen and a no-template negative control to assess for PCR failure/inhibition and monitor potential contamination in each batch of specimens. Because the starting specimen was not human clinical material, we did not use the recommended internal control reaction (targeting human RNase P). Each batch of specimens was considered valid only if the positive control amplified with a threshold cycle (Ct) Ct value >40.
Virus Quantification By Flow Cytometry: We used the manufacturer’s recommended protocols to conduct our VC assay. Briefly, the Virus Counter instrument is validated at the beginning of each analysis session with a nonbiological positive control to ensure proper instrument function and performance. Samples are stained with a working Combo Dye solution (1:2 ratio of dye to sample) and incubated for 30 minutes at room temperature before analysis. We used a 3×10⁸ vp/mL dilution of H1N1 (based on TEM) to develop sample and matrix-specific settings. Each analysis was completed in ~10 minutes, including intersample washes.
Samples in a complex matrix require empirical determination of their sample quantification limit (SQL) using a negative control (matrix material without virus present). This is determined by replicate analysis of a negative control sample and calculated using the following equation:

where Xneg is the mean value for n measurements of a negative control, t99% is the statistical t value for N – 1 degrees of freedom at 99% confidence, and σneg is the measured standard deviation for the negative controls. Our negative control consisted of a stained aliquot of SDB.
Statistical Analysis: We performed Pearson-correlation analysis to determine the linear correlation between the log-scale results of each assay after determining correlation coefficients (r) and p-values using Prism 5 software from GraphPad Software (La Jolla, CA). Statistical significance was confirmed with p-values
Results and Discussion
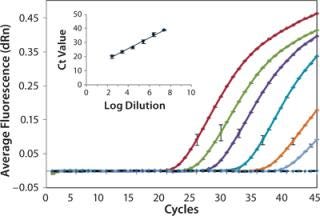
We analyzed serially diluted samples to determine the working range for each assay. Figure 2 shows representative amplification curves from a series of tenfold diluted samples analyzed by the H1N1 qPCR assay. We measured the diluted samples in triplicate, and a representative error bar is shown for each sample. As expected, each sample shows the exponential, linear, and plateau phases of amplification as a function of cycle number. The no-template negative control (represented by the dotted black line) had no detectable fluorescence above background, which demonstrates no sample—sample carryover or contamination present. The inset graph compares average Ct values against the log dilution factor, with a linear-regression fit to the data. As expected, the Ct values exhibit excellent linearity with the log of dilution (based on dilution from original stock concentration). We obtained a 0.99 coefficient of determination, indicating successful amplification with minimal variation among repeated measurements and accurate dilution preparation. The lowest copy number quantified by qPCR corresponded to a 25,000,000× dilution of the stock.
style=”text-decoration:none;background-color: #f7f7f7;color:#000000;” >Figure 2: ()
We determined the Virus Counter instrument’s sample quantification limit to be 9.8×10⁴ vp/mL (log = 4.99, n = 5) using the negative control and Equation 1. All VC results greater than the SQL value were considered statistically distinguishable from the negative control (“background”) and therefore reported. The lowest concentration the flow cytometer quantified corresponded to a 250,000× dilution of the stock. Table 1 summarizes both the VC and qPCR results obtained for all samples.
Figure 3 shows the relationship between the measured VC and qPCR Ct values. As expected, the qPCR Ct values exhibit an inverse correlation with the log of the VC results because decreasing Ct values indicate an increase in virus concentration (20). We observed a statistically significant Pearson correlation (r = –0.98, p < 0.001) along with a linear regression fit (R2=0.96) between qPCR and VC analysis. Also of note is that the flow cytometer’s measured precision (1.3±0.6% RSD) was less than that for qPCR (4±2% RSD).
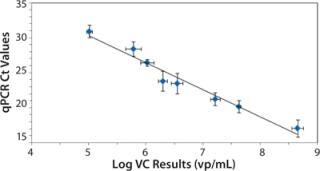
Figure 3: ()
In published studies, both techniques correlated well with the traditional plaque titer assay (20,27). Our study verifies that these virus quantification assays also correlated significantly with each other. Both assays quantify total viral concentration (infectious and noninfectious viruses) much faster than do traditional infectious assays. However, qPCR assays have are significant drawbacks. For example, not all viruses have commercial kits available, and designing primers and probes for a virus requires substantial expertise. The few commercially available kits are relatively expensive, with a higher cost per sample than VC analysis. Contamination is another common issue in both set-up and sample handling for qPCR assays. Furthermore, results are often five orders of magnitude higher than plaque titer assay results — often even higher than TEM results — because qPCR amplifies all target nucleic acid, whether it comes from a virion or is free in solution.
We compared VC results obtained in our study with provided manufacturer values (TEM and TCID50) to provide additional points of reference. Table 2 summarizes H1N1 concentrations of the stock sample determined by TCID50, TEM, and VC methods. However, qPCR concentration could not be calculated because a control template of known concentration had not been used to develop a standard curve. The VC concentration (1.6×10¹⁰ vp/mL) is higher in magnitude than that obtained from TCID50 (3.16×10⁶ TCID50/mL), which is reasonable given that TCID50 quantifies only infectious virus particles. The VC concentration measured for the H1N1 sample was identical in magnitude to that reported by TEM (1.6×10¹⁰ vp/mL), which is not surprising because both assays quantify total virus counts. The flow cytometer, however, simultaneously detects protein and nucleic acid in solution to obtain its results rather than basing its detection on molecular size and shape (8). That imparts more biological relevance to results from the Virus Counter instrument.
Table 2: Influenza A/H1N1 concentrations from different assays

Table 2: Influenza A/H1N1 concentrations from different assays ()
Virus concentrations are commonly determined using multiple assays. The specific assays used by each laboratory vary depending on user preference and specific needs, as do the preferred “standard” assays. The VC assay can rapidly quantify intact virus particles from a small sample volume and could prove useful in various steps during vaccine production, such as clone screening and culture-harvest time determination. The technique requires no virus-specific reagents, offers a more affordable per-sample assay cost than qPCR or TEM, uses a combination dyes specific for nucleic acids and proteins to ensure accurate virus particle counts, and has demonstrated precision better than or equivalent to existing assays.
Our study demonstrates the reliability of virus quantification results from the flow cytometry–based VC assay compared with those from qPCR, TCID50, and TEM. Along with observed precision, correlation of results indicates that the new assay presents an excellent option for rapid influenza virus quantification. Both qPCR and VC assays are valid for virus quantification, but the Virus Counter method offers advantages in robustness and universal applicability. Comparison with calculated TEM and TCID50 results further corroborate that the flow cytometer meets the criteria of speed, robustness, and precision needed with a new virus quantification method. The Virus Counter instrument is applicable to many laboratory environments, wherever rapid virus quantification is needed.
About the Author
Author Details
Kirk A. Ranno, corresponding author Erica D. Dawson, and Kathy L. Rowlen are current employees at InDevR, Inc., 2100 Central Avenue, Suite 106, Boulder, CO 80301; 1-303-402-9100; [email protected] Patricia C. Stepp was an applications scientist with InDevR when this work was performed and is now a research associate at the University of Pittsburgh. Matthew M. Ferris was lead scientist in instrument development at InDevR when this work was performed and is now a project manager at Thermo Fisher Scientific in Lafayette, CO.
REFERENCES
1.) Garten, RJ. 2009. Antigenic and Genetic Characteristics of Swine-Origin 2009 A(H1N1) Influenza Viruses Circulating in Humans. Science 325:197-201.
2.) CDC Estimates of 2009 H1N1 Cases and Related Hospitalizations and Deaths from April 2009 through April 10, 2010, By Age Group 2010., US Centers for Disease Control, Atlanta.
3.) H1N1 in Post-Pandemic Period: Director-General’s Opening Statement at Virtual Press Conference 2011., World Health Organization, Geneva.
4.) Garcia-Canas, V. 2007. Selective and Quantitative Detection of Influenza Virus Proteins in Commercial Vaccines Using Two-Dimensional High-Performance Liquid Chromatography and Fluorescence Detection. Anal. Chem 79:3164-3172.
iv id=”CIT0005″>5.) Kalbfuss, B. 2008. Monitoring Influenza Virus Content in Vaccine Production: Precise Assays for the Quantitation of Hemagglutination and Neuraminidase Activity. Biologicals 36:145-161.
6.) Chan, KH. 2009. Analytical Sensitivity of Rapid Influenza Antigen Detection Tests for Swine-Origin Influenza Virus (H1N1). J. Clin. Virol 45:205-207.
7.) Roldão, A. 2009. Error Assessment in Recombinant Baculovirus Titration: Evaluation of Different Methods. J. Virol. Meth 159:69-80.
8.) Condit, RC Knipe, DM and PM 2006.Principles of VirologyFields Virology, Lippincott, Williams and Wilkins, Philadelphia:25-58.
9.) Payne, AF. 2006. Quantitation of Flaviviruses By Fluorescent Focus Assay. J. Virol. Meth 134:183-189.
10.) Borsheim, KY, G Bratbak, and M Heldal. 1990. Enumeration and Biomass Estimation of Planktonic Bacteria and Viruses By Transmission Electron Microscopy. Appl. Environ. Microbiol 56:352-356.
11.) VanGuilder, HD, KE Vrana, and WM Freeman. 2008. Twenty-Five Years of Quantitative PCR for Gene Expression Analysis. BioTechniques 44:619-626.
12.) Ward, CL. 2004. Design and Performance Testing of Quantitative Real Time PCR Assays for Influenza A and B Viral Load Measurement. J. Clin. Virol 29:179-188.
13.) Hitchman, RB. 2007. Quantitative Real-Time PCR for Rapid and Accurate Titration of Recombinant Baculovirus Particles. Biotech. Bioeng 96:810-814.
14.) Lo, HR, and YC Chao. 2004. Rapid Titer Determination of Baculovirus By Quantitative Real-Time Polymerase Chain Reaction. Biotechnol. Prog 20:354-360.
15.) Kessler, HH. 2000. Identification of Different States of Hepatitis B Virus Infection with a Quantitative PCR Assay. Clin. Diagn. Lab. Immunol 7:298-300.
16.) Mulder, J. 1994. Rapid and Simple PCR Assay for Quantitation of Human Immunodeficiency Virus Type 1 RNA in Plasma: Application to Acute Retroviral Infection. J. Clin. Microbiol 32:292-300.
17.) Sadon, N. 2008. A New Quantitative RT-PCR Method for Sensitive Detection of Dengue Virus in Serum Samples. J. Virol. Meth. 153:1-6.
18.) Mackay, IM, KE Arden, and A Nitsche. 2002. Real-Time PCR in Virology. Nucleic Acids Res 30:1292-1305.
19.) Drosten, C. 2002. Rapid Detection and Quantification of RNA of Ebola and Marburg Viruses, Lassa Virus, Crimean-Congo Hemorrhagic Fever Virus, Rift Valley Fever Virus, Dengue Virus, and Yellow Fever Virus By Real-Time Reverse Transcription-PCR. J. Clin. Microbiol 40:2323-2330.
20.) Bae, H. 2003. Detection of Yellow Fever Virus: A Comparison of Quantitative Real-Time PCR and Plaque Assay. J. Virol. Meth 110:185-191.
21.) Forcic, D. 2010. Comparisons of Mumps Virus Potency Estimates Obtained By 50% Cell Culture Infective Dose Assay and Plaque Assay. Vaccine 29:1887-1892.
22.) Paraskevis, D. 2010. Development of a New Ultra Sensitive Real-Time PCR Assay (Ultra Sensitive RTQ-PCR) for the Quantification of HBV-DNA. Virology J 7:57.
23.) Kuzushima, K. 1999. Rapid Determination of Epstein-Barr Virus-Specific CD8+ T-Cell Frequencies By Flow Cytometry. Blood 94:3094-3100.
24.) Shapiro, HM 2003.Practical Flow Cytometry, John Wiley & Sons, Inc, Hoboken.
25.) Schulze-Horsel, J, Y Genzel, and U Reichl. 2008. Flow Cytometric Monitoring of Influenza A Virus Infection in MDCK Cells During Vaccine Production. BMC Biotechnol 8:45.
26.) Stoffel, CL, and KL Rowlen. 2005a. Design and Characterization of a Compact Dual Channel Virus Counter. Cytometry A 65:140-147.
27.) Ferris, MM. 2011. Evaluation of the Virus Counter® for Rapid Baculovirus Quantitation. J. Virol. Meth 171:111-116.
28.) Stoffel, CL. 2005b. Rapid Determination of Baculovirus Titer By a Dual Channel Virus Counter. American Biotech. Lab 37:24-25.
29.) 2009. CDC Protocol of Realtime RTPCR for Influenza A(H1N1), World Health Organization, Geneva.
You May Also Like


