Proteomics Technology Applied to Upstream and Downstream Process Development of a Protein VaccineProteomics Technology Applied to Upstream and Downstream Process Development of a Protein Vaccine
Development and manufacturing of recombinant-protein–based vaccines has in the past few years become very similar to that of other well-documented and well-characterized biological drugs. For investigational vaccines, chemistry, manufacturing, and controls (CMC) information is critical for a successful regulatory filing. The process development and CGMP manufacturing of a recombinant protein drug is on the critical path toward clinical phase 1 dosing and safety studies as well as proof-of-concept clinical studies (1, 2). However, resources invested in this process may be wasted if the methods and results are not sufficiently documented.
PRODUCT FOCUS: Vaccines and recombinant proteins
PROCESS FOCUS: Upstream and downstream process development
WHO SHOULD READ: Manufacturing and process development, project managers and analytical personnel
KEYWORDS: CELL LINE DEVELOPMENT, HOST-CELL PROTEIN ASSAY, PROCESS-RELATED IMPURITIES, PRODUCT-RELATED IMPURITIES, STABILITY, PAT
LEVEL: INTERMEDIATE
Here we describe how proteomics technology has enabled a scientific, risk-based framework for implementing process analytical technology (PAT) in the development of a well-characterized protein vaccine. Our aim is to identify the scientific tools that support innovation in process development and to exemplify the strategy for regulatory implementation. The result of our strategy was a fast and successful process development phase to generate CGMP material for clinical phase 1 and 2 trials. We applied proteomics technology in all stages of the development of ACE393 (a recombinant protein vaccine against diarrhea caused by Campylobacter) including selection of the expression cell line, development of the fermentation and purification processes, host-cell protein contaminant assessment, and stability measurements.
Development of a Production Cell Line
In upstream development, proteomics technology was applied directly on whole cell lysates for fast screening of development cell clones and selection of suitable cell lines for master cell banking (MCB). In the discovery phase of our project, a commercially available cell line and expression system was used to express the protein with a histidine tag at high yields. Such a tagged protein can be purified easily in large amounts on a nickel column and is suitable for research purposes and early animal efficacy studies. But that early cell line and expression system were for a number of reasons not selected for master cell banking and CGMP manufacturing:
To induce an optimal immune response against the natural form of a protein, the vaccine immunogen should contain no additional epitopes (e.g., polyhistidine tracts).
Metal affinity column chromatography was found unsuitable for a large-scale manufacturing process because of higher manufacturing costs and the potential risk of nickel leakage into a final product.
Use of the His-tag expression system for manufacturing of a final vaccine would have required future payment of license fees to the owner of that expression system.

Figure 1:
ALPHALYSE (WWW.ALPHALYSE.COM) AND ACE BIOSCIENCES
To establish a cell line suitable for master cell banking, the gene encoding ACE393 was recloned without the histidine tag into two alternative expression vectors and inserted into a microbial strain suitable for manufacture of clinical products. To select Escherichia coli clones that express the protein, several colonies from each expression system were analyzed by proteomics technology. The E. coli clones were grown in shake-flask cultures, and whole cell lysates were analyzed by one-dimensional sodium-dodecyl sulfate polyacrylamide gel electrophoresis (SDS-PAGE).
Figure 1A shows the Coomassie stained gel, and Figure 1B shows the Western blot stained with a polyclonal antibody raised against a His-tagged reference protein. The antibody recognizes several protein bands in the gel, including two major forms of the Campylobacter protein with apparent molecular weights around 23 kDa (indicated by arrows) and several E. coli proteins throughout the blot. Those E. coli proteins are considered to have copurified along with the His-tagged protein and therefore were also used in the mouse immunization studies.
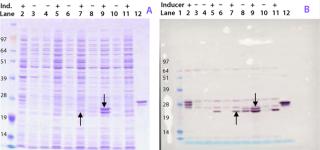
Figure 1: ()
The highest-yielding clone expressed the ACE393 protein constitutively without sufficient regulation by the inducible promoter (Figure 1B, lanes 8 and 9). Protein bands presumably containing the ACE393 were picked from the Coomassie stained gel for protein identification by mass-spectrometric (MS) peptide mapping. Those gel bands were cut out and the proteins digested with trypsin. The resulting peptides were extracted from the gel plug and analyzed by matrix-assisted laser desorption/ionization (MALDI) mass spectrometry (3, 4).
Figure 2 shows the resulting mass spectrum and peptide map obtained from the gel band indicated by an arrow in lane 7 of Figure 1A. Several peptide masses could be correlated to the Campylobacter protein, even though the gel band contains many other E. coli proteins from the whole cell lysate, and their peptides also are observed in the mass spectrum. The peptide map covers 82% of the amino acid sequence; the missing parts are small peptides (with two to six residues) below 700 Da. Both the C- and N-terminal ends were found, confirming that the full-length protein is expressed and correctly cloned. Some analyzed clones expressed the protein in large amounts, but not correctly processed at the N-terminus (the upper ACE393 band indicated by the arrow in Figure 1B lane 9).
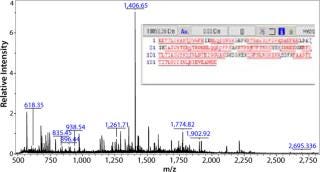
Figure 2: ()
By combining antibody staining and MS peptide mapping, we found an E. coli clone that expressed the correct form of the protein under regulation by the inducible promoter. Both analyses can be done o
n whole-cell lysates directly from shake flask cultures or those propagated in a bioreactor, so this method could be applied immediately without downstream process development. In our project, it was possible to perform the SDS-PAGE, Western blot, and MS analyses within a few days to screen and select the best clone for cell banking. We found these tools to be ideal for fast clone screening in upstream cell line development.
Fermentation and Purification Process Development
Analytical characterization of a drug substance performed from the beginning of downstream process development can reduce expensive work and the risk of sidetracking a project. Following initial selection of the cell line grown in shake flasks, the growth of the selected strain was further analyzed in a bioreactor. Some initially important questions when a recombinant protein is expressed for the first time in a bioreactor include
How do the cells behave at high densities?
Is the protein expressed, and at what level?
Is the protein forming multimers or aggregating at high concentrations?
Is the protein expressed in inclusion bodies, or is it in a soluble form?
Is the protein expressed correctly, or are product-related variants introduced during fermentation and downstream processing?
To address those questions, we applied the same PAT strategy as described for strain selection, using a combination of 1D SDS-PAGE of whole cell lysates from fermentation samples, Western blots with polyclonal antibodies, and MS peptide mapping. Figure 3A shows a Coomassie-stained 1D SDS-PAGE gel with crude protein extracts taken at different time points from the first fermentation.
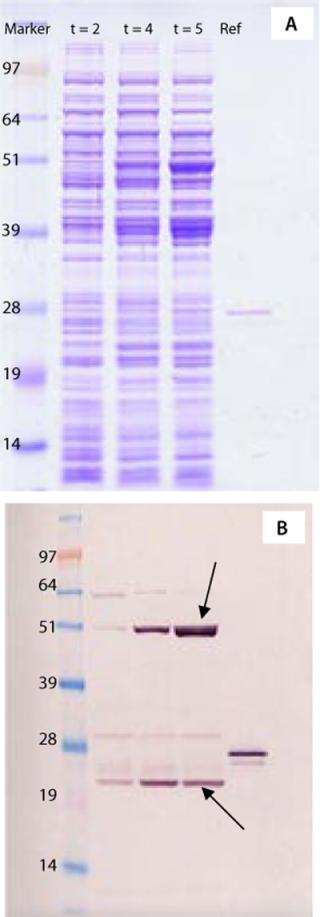
Figure 3: ()
A Western blot (Figure 3B) revealed the vaccine protein band with the correct apparent molecular weight (23 kDa) and another inducible strong immunoreactive molecule at 48 kDa, about twice its molecular weight. Indicated with an arrow in Figure 3B, that second band might represent a protein dimer. The presence of such a protein dimer would be important to purification strategy and protein stability as well as for immunogenicity of the vaccine. Application of the MS techniques, however, rapidly identified the protein in the 48-kDa band as alkaline phosphatase from E. coli, which has no similarity with the recombinant ACE393 protein. So performing this analysis before any downstream processing saved a significant amount of valuable development time by unraveling the nature of an immunoreactive bacterial protein.
During fermentation and downstream processing, there is a potential risk that product-related variants can occur. Such variants are often C- or N-terminal truncations at labile amino-acid bonds, or they can be formed by proteases that are released during cell lysis. Other variants include the products of oxidation, deamidation, formation of N-terminal pyroglutamic acid, and other posttranslational modifications that affect specific amino acid residues. Such modifications can be detected by MS peptide mapping and molecular weight determination of the intact protein. In this project, mass spectrometry was applied throughout process development for molecular weight determination of the intact vaccine protein as well as MS peptide mapping. Electrospray-ionization mass spectrometry (ESI-MS) showed a mass of 18,849 Da (data not shown), which is in agreement with the theoretical intact mass of 18,850.4 Da. MS analyses confirmed the protein identity and that the protein is not modified or truncated to any detectable level during fermentation and purification.
Stability Assay
After protein purification, an important issue is the stability of a protein drug substance and formulated drug product. Stability assays of protein vaccines formulated with alum adjuvants are not straightforward to perform because most standard analytical methods for protein characterization cannot be easily applied to proteins immobilized on alum. For the ACE393 protein, a stability assay was developed to monitor potential protein degradation when it was formulated with alum hydroxide.
In this stability assay, vaccine vials were incubated at the normal storage temperature at 4 °C and at 37 °C in an accelerated stability study. Samples were taken at different storage intervals for stability measurements. For analysis of protein degradation products, the ACE393 protein was eluted from the alum hydroxide by treatment with SDS-PAGE sample buffer. The samples were analyzed by electrophoresis, and the gels were stained with a sensitive silver staining method compatible with MS analysis (5).
Figure 4 shows a silver-stained gel of the drug product stored for nine months at 37 °C in the accelerated stability study. Degradation protein fragment bands were cut out from the silver-stained gel and analyzed by in-gel trypsin digestion and MS peptide mapping. The protein sequence coverage map in Figure 4 shows peptide maps obtained for the individual protein fragments. Those peptide maps confirm that the proteins are drug substance degradation products. The sequence coverage maps show that bands 1 and 2 are protein fragments missing the C-terminal region, band 3 and 4 are also missing the N-terminal region, and band 5 and 6 found around 6 kDa in the gel contain only the middle part of the sequence. Thus, the combination of SDS-PAGE and MS peptide mapping again provided very valuable information (about protein degradation patterns, in this case) that is not easily obtained by other analytical techniques.
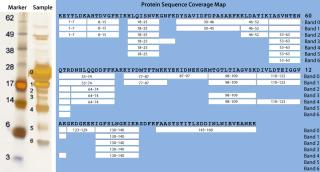
Figure 4: ()
Host Cell Proteins
Host cell protein (HCP) assays are important tools for monitoring product purity and demonstrating consistency of a manufacturing process. HCPs are typically measured using enzyme-linked immunosorbent assays (ELISAs) with polyclonal antibodies (6, 7). ELISAs come as off-the-shelf kits or can be process-specific assays developed for particular products. An important criterion for these assays is that the antibodies they use must be able to recognize a broad range of HCPs that might be expressed and purified during a manufacturing process. But that is often difficult. Usually several rounds of animal immunizations are necessary to secure broad antigen recognition.
An alternative and attractive way for monitoring HCPs is one- or two-dimensional SDS-PAGE combined with sensitive protein silver staining followed by protein identification using mass spectrometry and/or Western blotting. The MS method can also detect nonimmun
oreactive proteins and provides the identity of any contaminating HCPs, although the method is not as sensitive as an ELISA. Another advantage of the alternative method is the speed of analytical development. It often takes 12 months or more to develop a sufficient ELISA, whereas 1D SDS-PAGE, Western blots, and mass spectrometry can be applied immediately to give results within a week.
In our project, we used a 1D SDS gel followed by silver staining and MS analysis to identify contaminating host cell proteins in the final drug substance. That substance was used to formulate three drug product batches for our phase 1 study. Figure 5 shows a 1D SDS-PAGE gel from different CGMP batches of purified drug substance. The E. coli host cell proteins identified by MS are marked “HCP.” The purity of this drug substance was determined with HPLC to be above 98% (data not shown), but several HCPs are detected by silver staining of the gel. MS methods optimized for high sensitivity can provide the identity of such faint silver-stained gel bands.
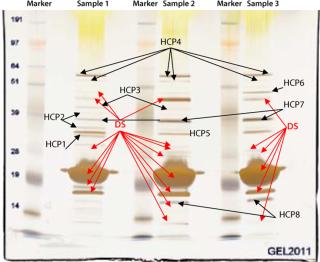
Figure 5: ()
PAT Can Help
We have established a catalog of well-characterized contaminants of a vaccine drug substance manufactured for early clinical trials. Further process development calls for increased purity and further improvements in our manufacturing process. Such improvements will be measured against this initial contaminant profile, and the results will be used in evaluating method improvements for manufacturing phase 3 material. This approach allows us to speed up implementation of improvements for later-stage process development as well as lower our risk of regulatory action.
REFERENCES
1.) Boerner, R, and K. Clouse. 2005. Defining Your Product Profile and Maintaining Control Over It, Part 3: Product-Related Impurities. BioProcess Int. 3:50-56.
2.) Scott, C. 2006. Formulation Development: Making the Medicine. BioProcess Int. 4:S42-S56.
3.) Gygi, SP, and R. Aebersold. 2000. Mass Spectrometry and Proteomics. Curr. Opinion Chem. Biol. 4:489-494.
4.) Lahm, HW, and H. Langen. 2000. Mass Spectrometry: A Tool for the Identification of Proteins Separated By Gels. Electrophoresis 21:2105-2114.
5.) Mørtz, E. 2001. Improved Silver Staining Protocols for High-Sensitivity Protein Identification Using Matrix-Assisted Laser Desorption/Ionization Time of Flight Analysis. Proteomics 1:1359-1363.
6.) Hoffman, K. 2000. Strategies for Host Cell Protein Analysis. BioPharm 13:38-45.
7.) Champion, K. 2005. Defining Your Product Profile and Maintaining Control Over It, Part 2: Challenges of Monitoring Host Cell Protein Impurities. BioProcess Int. 3:52-57.
You May Also Like


