Rapid Assessment of Vaccine PotencyRapid Assessment of Vaccine Potency
November 1, 2009
The global vaccine market is growing annually by 16% and is expected to reach $21 billion by 2010 (1). Much of the predicted growth of this market is expected to come from the introduction of new vaccines, either against diseases for which no vaccine currently exists or as second-generation products to replace existing ones.
Much research is still centered on developing vaccines to prevent infectious diseases caused by microbial and viral pathogens. This segment is being fueled by a number of factors including
the threat of world terrorism, which has resulted in a supply of smallpox vaccines manufactured by companies such as Acambis (www.acambis.com)
the risk of a global influenza pandemic leading to biotech companies including Novavax (www.novavax.com) developing new flu vaccines
increased funding in emerging markets for pediatric and adult vaccines creating more interest in production of, for example, pneumococcal vaccines to rival Wyeth’s Prevnar product.
PRODUCT FOCUS: VACCINES
PROCESS FOCUS: R&D, TESTING
WHO SHOULD READ: PROCESS AND PRODUCT DEVELOPMENT, QA/QC, AND ANALYTICAL PERSONNEL
KEYWORDS: OPK ASSAY, VIRAL PLAQUE ASSAY, AUTOMATION, CLINICAL TRIALS
LEVEL: BASIC
Because many vaccines have a limited lifespan (a short period of clinical usefulness because of the changeability of antigens), pharmaceutical and biotech companies are increasingly under pressure to get their products to market quickly. This translates to a need for speed in manufacturing and quality assurance.
Bacterial Vaccines
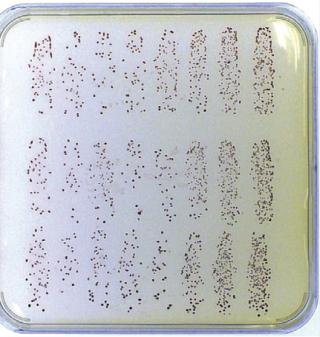
In testing antimicrobial vaccines (e.g., pneumococcal vaccines), an effective method of evaluating vaccine efficacy is by counting red bacterial colonies that survive the in vitro opsonophagocytic-killing assay (OPKA) when plated on Todd-Hewitt agar plates with a TTC (2,3,5-triphenyl tetrazolium chloride) agar overlay (2,3). However, in a typical clinical trial for a new such vaccine, ≤11,000 colonies can be generated from every patient at each bleed, so samples can take days to process manually. Because colony enumeration provides the data on which vaccine potency is based in these cases, it is essential to obtain the most precise colony counts possible. Manual methods of enumerating the number of colonies after the OPKA require microbiologists to use a light-box and a pen, then key the results into a computer. This is time consuming, and it can lead to reading and transcription errors, especially when counting large numbers of Staphylococcus pneumoniae colonies, which can be <1 mm in diameter (Photo 1). And because this method produces no digital images of the plate to back up the colony counts, independent audits — which are compulsory for approval of new vaccines — cannot be carried out by regulatory authorities (Photo 1).
Photo 1:

Photo 1: ()
Automation Is the Way Forward
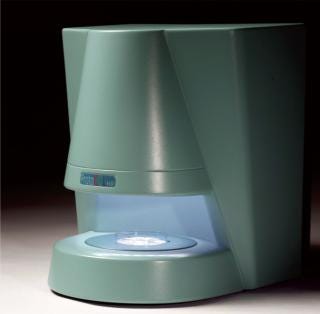
To overcome the difficulties associated with manually counting colonies on large OPKA plates, an automated colony counter such as the ProtoCOL instrument from Synbiosis (www.synbiosis.com) can be used. Automated colony counting with this system, consisting of a CCD camera integrated with a computer (Photo 2), involves imaging an entire media plate. The image captured is analyzed to distinguish true colonies from mere artifacts in the medium, such as bubbles or debris that can occur during overlaying. Software then marks the colonies, compensating for those of different sizes and those that touch or overlap, then counts the marked colonies to automatically provide a result. Counting colored colonies (e.g., red S. pneumoniae) demands a high degree of imaging sophistication. A color CCD camera with correct background lighting is necessary to accurately capture an image of the colony and distinguish it from the background medium’s color.
Some automated colony counters — including the ProtoCOL system — can produce post-OPKA results that comply with good clinical practice (GCP) guidelines and thus can be presented to the US Food and Drug Administration (FDA) and other regulatory authorities. To comply with GCP, colony-count results must be automatically transferred into a table for storage in a secure file format. The data must be password protected to ensure that batches of results cannot be deleted. Additionally, count editing must be recorded next to each revised result (the ProtoCOL system uses a coded flag). Every detail of each sample must be recorded: OPKA plate images, system configuration, date and time, and the staff member who read the plate.
Photo 2:

Photo 2: ()
Case Study 1
Automated Colony Counting in Clinical Trials of Pneumococcal Vaccines: The ProtoCOL system is being successfully used for assessing surviving colony results after OPK assays at a number of UK and US research institutes. These include the Institute of Child Health (ICH) in the United Kingdom and the University of Alabama at Birmingham in the United States.
At the immunobiology unit of the ICH, scientists are running clinical trials in which subjects are vaccinated with new pneumococcal vaccines. (These children do not receive S. pneumoniae, which are not contained in the vaccine; the bacteria are added to serum only for the OPK assay.) Since 2006, ICH scientists have used the ProtoCOL instrument to count 20 plates per day from the OPKA assay (~45,000 S. pneumoniae colonies). They have found that the system can distinguish between close colonies and visualize even very small ones with a diameter of <0.2 mm. This is enabling the scientists to generate results accurately the same day that colonies appear, whereas processing and noting the results of counting 45,000 colonies manually would easily take two to three days.
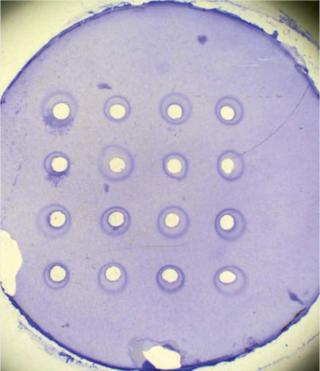
Viral Vaccines: To test the potency of some viral vaccines, researchers analyze the size of the area where viruses inhibit bacterial growth (viral plaque) on agar media (4). In the case of flu vaccines, a single radial immunodiffusion (SRD) assay measures the zone of inhibition provoked by the serological response to a vaccine, as Photo 3 shows (5,6).
To measure SRD reaction zones, many scientists use a calibrated viewer or ruler to estimate zone size manually. Using this method, reading a standard SRD plate with 16 reaction zones (the equivalent of information on just one serotype of vaccine) takes ~1.5 hours. Results are rekeyed into another software program for statistical analysis, which makes it difficult to maintain a secure audit trail. This method is time consuming for companies that assess hundreds of different serotypes weekly. With the data rekeying, it can lead to transcription errors and therefore inaccurate results.
Automated Inhibition Zone Measurement: Automating measurement of an inhibition zone can speed up productivity by analyzing an SRD plate on average in <10 minutes (~10× faster than performing this task manually). Automated measurement using, for example, the ProtoCOL system involves imaging an entire SRD plate and showing it on a personal-computer screen. The system's software has a template of circles that are placed over the on-screen image, and the templates around each reaction zone can be adjusted to fit using simple mouse clicks. With a single click, the software automatically measures the diameter of each zone and flags areas of dispute so that scientists can measure manually using an on-screen ruler, if necessary. The software then calculates the diameter of the marked zones and transfers the results into a Microsoft Excel spreadsheet, which saves many hours of highly repetitive work.
Photo 3:

Photo 3: ()
Case Study 2
Automated Inhibition Zone Measurement in Flu Vaccine Quality Assurance: One major European quality assurance institute is responsible for controlling the quality of viral influenza vaccines used to immunize the population of the United Kingdom. This organization decided to automate the analysis of its SRD assays using a ProtoCOL system. Changing part of a quality control process can have far reaching implications when testing flu vaccines, however. So the institute had to ensure that its automated method was as accurate as its existing manual method. Therefore, a study was undertaken in which two scientists compared the potency of three vaccines over six weeks on SRD assay plates read manually with a calibrated viewer alongside automated measurements from a ProtoCOL system. They found that the automated method could analyze and produce data on a 16-well SRD plate in 10 minutes compared with ~1.5 hours using the manual method. Results generated by the two methods were consistent, with percent typical errors of ~1% for both potency and precision measurements, which is well within the acceptable limits set by the UKAS (UK Accreditation Service).
For Speed and Quality
One bottleneck in vaccine production is measuring the potency of some types of vaccines. Manually counting colonies and measuring inhibition zones can be time consuming and inaccurate. Automating these activities can significantly increase productivity in bacterial and viral vaccine production, as has been shown by the use of the ProtoCOL system at the ICH, where it has reduced analysis time of novel pneumococcal vaccines, and at a European QC institute where the system allowed scientists to increase by tenfold their speed in analyzing flu vaccines without compromising the accuracy of results.
Because data generated by ProtoCOL software can be integrated into a 21 CFR Part 11 environment, the system facilitates GLP and GMP compliance for pharmaceutical and biopharmaceutical companies. Combining increased productivity with secure data storage makes using automated colony-counting and zone-sizing systems such as this an excellent tool in evaluating new vaccines for bacterial and viral diseases. Such automation could contribute to these products reaching the market more rapidly in the future.
REFERENCES
1.).
2.) Kim, KH, J Yu, and M. Nahm. 2003. Efficiency of a Pneumococcal Opsonophagocytic Killing Assay Improved By Multiplexing and By Coloring Colonies. Clin. Diagn. Lab. Immunol. 10:616-621.
3.) Nahm, MH, DE Briles, and X. Yu. 2000. Development of a Multi-Specificity Opsonophagocytic Killing Assay. Vaccine 18:2768-2771.
4.) Barban, V. 2007. High Stability of Yellow Fever 17D-204 Vaccine: A 12-Year Retrospective Analysis of Large-Scale Production. Vaccine 25:2941-2950.
5.) Wood, JM. 1986. Single-Radial- Immunodiffusion Potency Tests of Inactivated Influenza Vaccines for Use in Man and Animals. Dev. Biol. Stand. 64:169-177.
6.) Wood, JM. 1999. The Influence of the Host Cell on Standardisation of Influenza Vaccine Potency. Dev. Biol. Stand. 98:183-188.
You May Also Like


