Raman Spectrometric PAT Models: Successful Transfer from Minibioreactors to Larger-Scale, Stirred-Tank BioreactorsRaman Spectrometric PAT Models: Successful Transfer from Minibioreactors to Larger-Scale, Stirred-Tank Bioreactors

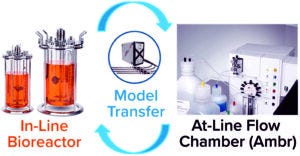
Figure 1: Model transfer from Ambr 250 high-throughput systems (Sartorius Stedim Biotech) to and from larger-scale, stirred-tank bioreactors.
Spectroscopic sensors are powerful tools for bioprocess monitoring within the process analytical technology (PAT) initiative of the US Food and Drug Administration (FDA). The PAT framework includes process understanding based on scientific background with the aim of monitoring and controlling critical process parameters (CPPs) that influence critical quality attributes (CQAs) of final biological products. The driving force for PAT implementation is a need to realize consistent product quality, process intensification, and real-time manufacturing control (1, 2).
Using real-time spectroscopic measurements of bioprocesses allows for monitoring of CPPs such as biological, chemical, and physical variables throughout biotechnological production. Raman spectroscopy has become a first-choice PAT for monitoring and controlling upstream production processes (3). The technology offers a number of advantages: sufficient resolution and a high signal-to-noise ratio, limited interference from water molecules in the aqueous process environment, and instrumentation that provides stable signals (4). Raman-based process monitoring and control are increasing in popularity for pilot- and manufacturing-scale bioreactor applications. Using similar analytical technologies and measurements across scales and bioreactor formats is key — and a challenge for cost-efficient model building and transfer.
Model building at manufacturing scale is expensive in terms of facility use, raw materials, and staff time because robust models need data from multiple bioreactor runs with induced variation of process conditions (5). At Bayer, we have discovered a more efficient option: building models during process development using high-throughput (HTP), small-scale minibioreactors — e.g., Ambr 250 minibioreactors from Sartorius Stedim Biotech. Such systems enable cost-effective experimental design with induced variations for efficient model building.
Small-scale bioreactor systems are applied increasingly for cell-line development and process optimization/characterization. The Ambr 250 system is optimized for design of experiment (DoE) studies that are well suited to Raman model building. One run can generate data from 24–48 different bioreactor conditions or process trajectories. Thus, the DoE design space can be much larger than one provided by running hundreds of separate batches with different variations.
Processes and associated PAT developed using an Ambr 250 platform require significant scale-up into commonly used production-scale bioreactor formats — e.g., large-scale stainless-steel or single-use vessels that are several thousand liters in volume. That makes transfer of spectral-based models between scales a highly important criterion for efficient model building and transfer of ever-increasing data generation from development to manufacturing. A 2015 study demonstrated the scalability and transferability of Raman models across numerous scales when using a similar style of immersion Raman probe at each scale (9). Due to the miniature scale and the automated, parallel installation of Ambr vessels, however, such a strategy is not possible with Ambr-based processes.
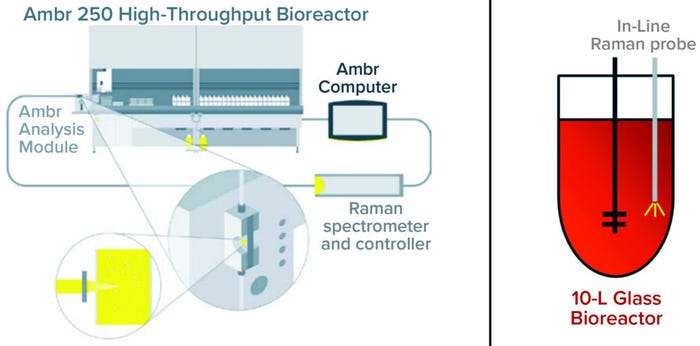
Recently, Sartorius introduced a new analysis module for Ambr systems that has an integrated spectroscopy flow cell and allows for connection of dedicated Raman instruments such as the Rxn-46 probe from Endress+Hauser. The probe interface is not identical at smaller and larger scales, which complicates scale-up to larger process volumes. Noncontact measurements made using a flow cell that is in close proximity to minibioreactors — with extracted samples from the process being transported to an analysis module (on-line) — are very different from in-line measurements of larger-scale bioreactors. Here, we evaluate models generated with such a minibioreactor system for seamless transfer to larger-scale bioreactors that have true in-line Raman detection.

Figure 2: Analysis module schematic shows a BioPAT Spectro platform connected to an Ambr 250 minibioreactor and an in-line Raman probe connected to a 10-L bioreactor.
Material and Methods
We cultured a Chinese hamster ovary (CHO) cell line producing a monoclonal antibody (MAb) in a 10-L Biostat STR stirred-tank bioreactor and in an Ambr 250 HTP system connected to a BioPAT Spectro spectroscopy platform (all from Sartorius Stedim Biotech). The culture medium, cell line, product, process condition, and feeding strategy all were similar at both scales.
Spectra and off-line measurements were collected from two 10-L bioreactors and 12 Ambr vessels. In both setups, off-line reference samples were analyzed using a Cedex BioHT metabolite analyzer from Roche Diagnostics. During the 10-L cultivations, we collected Raman spectra with an installed in-line Rxn-10 probe with bIO-Optic immersion options (Endress+Hauser). Samples were taken automatically from the Ambr 250 system with integrated automation and supplied to the analysis module’s flow cell equipped with an Endress+Hauser Rxn-46 probe for a BioPAT Spectro instrument (Sartorius).
For both setups, we used a Raman Rxn2 spectrometer (Endress+Hauser) with a 785-nm diode laser. A single-channel analyzer was used for the Ambr integration, and a four-channel analyzer was used for the 10-L bioreactors. Raman data were acquired between 100 and 3,425 cm–1. For the BioPAT Spectro system, we used an acquisition time of 10 seconds and 12 counts (for 2 minutes total exposure), and for the in-line probe, an acquisition time of 10 seconds and 75 counts (12.5 minutes total exposure). We analyzed and preprocessed all spectral data using SIMCA 17 software (Sartorius Stedim Data Analytics). Spectra were pretreated with different preprocessing steps, and we used analyte-specific wavelength regions for each model.
To identify spectral outliers and extract relevant information, we applied principal component analysis (PCA) as a qualitative approach and partial least square (PLS) regression as a quantitative method to correlate reference data with spectral data. We evaluated the performance of each model based on R2 and Q2, as applicable, as well as the root mean square error of calibration (RMSEC) from cross-validation (RMSECV) and prediction (RMSEP). Raman models were built from both Ambr and 10-L data sets and compared across both scales.
Results and Discussion
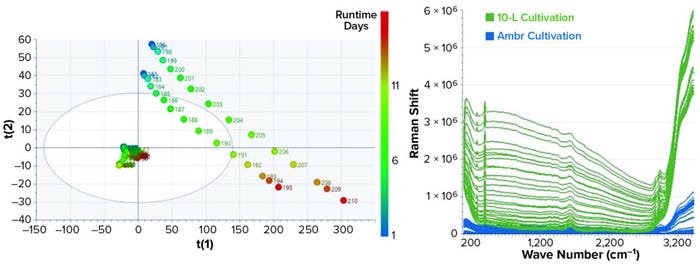
The first step of multivariate data analysis is a qualitative PCA to reduce the initially large data set to a smaller number of uncorrelated variables based on the principal components (PCs) scores. PCA is used to accomplish an overview of the raw spectral data from 10-L bioreactor and Ambr cultivations that can be visualized in a score plot. The PCA score plot in Figure 3 shows a large difference in the score values for both cultivations. The score-value trends for the two 10-L runs are very comparable; the values and trend for the Ambr data look completely different.

Figure 3: PCA score plot with different trends for the Ambr and 10-L bioreactors (LEFT) and raw spectra from 10-L and Ambr cultivations (RIGHT)
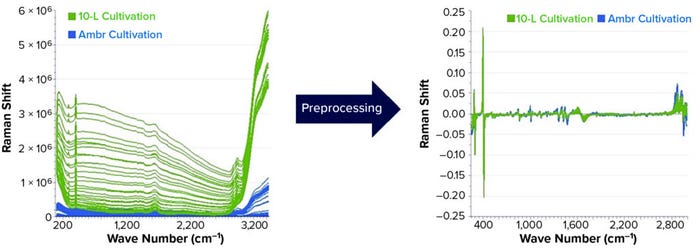
Examining the raw spectra reveals that the difference in acquisition time varies the intensity of the spectral data. Spectral preprocessing must be used for joint analysis and scale-up. The derivative filter is effective at removing offset variations and slowly varying spectral features such as different baselines and instrument backgrounds. We applied standard normal variate (SNV) scaling to each spectrum, thus accounting for variations in spectral intensity from different acquisition settings, laser power, instrument throughput, and sample scattering. Figure 4 shows the results of these preprocessing methods making both data sets more comparable and usable for further qualitative and quantitative evaluations.

Figure 4: Raw spectral data from the Ambr and 10-L cultivations (LEFT) and spectral data after preprocessing (RIGHT).
We developed PLS regressions for quantitative analysis by correlating Raman spectra with off-line reference values. Two fed-batch cultivations in 10-L vessels and 12 fed-batch cultivations in Ambr vessels provided the data sets for calibration and validation. Data preprocessing made a PLS model for glucose prediction possible based on a combination of both data sets. When plotted, the observed and predicted data showed excellent correlation, with R2 = 0.95 (data not shown), RMSEE = 0.2 g/L, and RMSECV = 0.26 g/L.
To evaluate the transferability of our model to a larger scale, we used data from 12 Ambr cultivations as the calibration set and two 10-L cultivations for validation. The RMSEE was 0.17 g/L, and the RMSECV was 0.27 g/L. The glucose prediction for the two 10-L cultivation based on the Ambr calibration model was well realized, with R2 = 0.84 and RMSEP = 0.29 g/L. Thus we demonstrated that PLS models can be transferred successfully from Ambr 250 HTP systems to larger-scale stirred tank bioreactors. Transferability also works in the other direction, with scale-down of 10-L models to Ambr (data not shown).
Lactate concentration is another important parameter for process monitoring in biopharmaceutical development and production. Lactate production is a notable metabolite to monitor for cultured CHO cells. It usually is produced during the exponential growth phase of a culture, after which comes a metabolic shift to lactate consumption. Monitoring the concentration is crucial because accumulation of lactate has a toxic effect on cell growth and productivity (1, 5).
We used the same data set as for glucose for both calibration and validation. The PLS model we developed for lactate indicates a good model fit, with R2 of 0.96 and RMSECV of 0.18 g/L. Based on the Ambr 250 data set, our PLS model can predict lactate concentration in two 10-L bioreactor cultivations with RMSEP of 0.38 g/L. These promising results demonstrate the potential of transferring and using a Raman model built on small-scale data.

Figure 5: Comparing observed and predicted plots for the partial least squares (PLS) model developed to predict glucose concentration using spectral data from the Ambr 250 cultivation (LEFT); glucose prediction for two 10-L cultivations (RIGHT).

Figure 6: Comparing observed and predicted plots for the PLS model developed to predict lactate concentration using spectral data from the Ambr 250 cultivation (LEFT); lactate prediction for two 10-L cultivations (RIGHT).
A Step in the Right Direction
With these experiments, we successfully transferred a Raman spectrometric model in both directions between in-line measurements in 10-L stirred-tank bioreactors and measurements in the flow cell connected to the Ambr 250 (scale-up and scale-down). These findings will help to ensure that Raman spectroscopy can be used efficiently throughout product and process development. The technique offers an opportunity for efficient model transfer from development to production.
Herein, we present data for two different parameters: glucose and lactate. Extension of the modeling approach to include other process parameters seems possible, enabling model transfer from the Ambr system to true in-line measurements. To realize this scale-up success, we needed a specially designed single-use bioreactor bag with a fully integrated spectral window for Raman measurements (7). The BioPAT Spectro spectroscopy platform allows for integration of spiking experiments, in which artificial variations enable efficient and robust model building.
This model transfer is an efficient approach for the different stages in development and production of monoclonal antibodies (MAbs) and shows promise for cell/gene therapies (CGTs), a new biopharmaceutical modality that offers the potential for completely curing some diseases. The Raman model transfer should provide a great advantage in CGT development, long periods of which are carried out at small scale. Minimizing the time between research and development and patient treatment is critical for CGTs. In such cases, in-line measurement and process monitoring speed knowledge build-up, improve product-quality consistency, and help companies get production right the first time (8). We believe that our results represent a step forward in the implementation of real-time bioprocess monitoring and the realization of PAT for laboratory-to-process scalability.
Acknowledgments
We are grateful to both Sartorius Stedim Biotech and Endress+Hauser for technical support, instrumentation, and cooperation.
References
1 Classen J, et al. Spectroscopic Sensors for In-Line Bioprocess Monitoring in Research and Pharmaceutical Industrial Application. Anal. Bioanal. Chem. 409(3) 2017: 651–666; https://doi.org/10.1007/s00216-016-0068-x.
2 Rathore AS, Bhambure R, Ghare V. Process Analytical Technology (PAT) for Biopharmaceutical Products. Anal. Bioanal. Chem. 398(1) 2010: 137–154; https://doi.org/10.1007/s00216-010-3781-x.
3 Esmonde-White KA, Cuellar M, Lewis IR. The Role of Raman Spectroscopy in Biopharmaceuticals from Development to Manufacturing. Anal. Bioanal. Chem. 414(2) 2021: 969–991; https://doi.org/10.1007/s00216-021-03727-4.
4 Abu-Absi NR, et al. Real Time Monitoring of Multiple Parameters in Mammalian Cell Culture Bioreactors Using an In-Line Raman Spectroscopy Probe. Biotechnol. Bioeng. 108(5) 2011: 1215–1221; https://doi.org/10.1002/bit.23023.
5 Sibley M, et al. Novel Integrated Raman Spectroscopy Technology for Minibioreactors: Accelerating Raman Model Building for Cell Culture Monitoring and Control. BioProcess Int. 18(9) 2020: https://bioprocessintl.com/sponsored-content/biopat-spectro-integrated-raman-spectroscopy-technology-for-minibioreactors-accelerating-raman-model-building-for-cell-culture-monitoring-and-control.
6 Lao M, Toth D. Effects of Ammonium and Lactate on Growth and Metabolism of a Recombinant Chinese Hamster Ovary Cell Culture. Biotechnol. Prog. 13, 1997: 688–691; https://doi.org/10.1021/bp9602360.
7 Rowland-Jones RC, et al. Spectroscopy Integration to Miniature Bioreactors and Large Scale Production Bioreactors: Increasing Current Capabilities and Model Transfer. Biotechnol. Prog. 37(1) 2020: 3074; https://doi.org/10.1002/btpr.3074.
8 Baradez M-O, et al. Application of Raman Spectroscopy and Univariate Modelling as a Process Analytical Technology for Cell Therapy Bioprocessing. Front. Med. March 2018: 47; https://doi.org/10.3389/fmed.2018.00047.
9 Berry B, et al. Cross-Scale Predictive Modeling of CHO Cell Culture Growth and Metabolites Using Raman Spectroscopy and Multivariate Data Analysis. Biotechnol. Prog. 31(2) 2015: 566–577; https://doi.org/10.1002/btpr.2035.
Corresponding author Jens Classen is a biotechnology expert for cell culture and CGT at Bayer AG, Building E41, 51368 Leverkusen, Germany; [email protected]; https://www.bayer.com. Alexander Jockwer is senior director and head of upstream process development for therapeutic proteins, cell and gene therapies; Jens Traenkle is global head of PAT and automation; and Matthaeus Langer is a technical assistant in upstream processing, all at Bayer AG in Wuppertal, Germany.
Ambr, BioPAT, and SIMCA are registered trademarks of Sartorius AG. Cedex Bio HT is a registered trademark of Roche Diagnostics.
You May Also Like


