Real-Time, Data-Driven, and Predictive Modeling: Accelerating Digital Transformation in Drug Substance Commercial ManufacturingReal-Time, Data-Driven, and Predictive Modeling: Accelerating Digital Transformation in Drug Substance Commercial Manufacturing

HTTPS://STOCK.ADOBE.COM
Biopharmaceutical drug-substance (DS) manufacturing consists of several unit operations. Upstream production includes multiple steps in growing bacterial or mammalian cells in culture. Upstream activities are followed by a series of downstream processing units including chromatography and filtration steps for removing impurities and purifying a therapeutic molecule (1). All these operations are inherently complex because of the natural variability associated with growing living cells and the intricacy of purification techniques used for collecting biological products.
The US Food and Drug Administration (FDA) put forth its current good manufacturing practice (CGMP) initiative in the 1970s to minimize risks associated with pharmaceutical manufacturing and ensure product quality (2). That paradigm has evolved in more recent years to become the Pharmaceutical Quality for the 21st Century initiative (3). Both initiatives enforce pharmaceutical quality standards, ensure product consistency and safety, and promote effective manufacturing processes (2–4). To facilitate those goals, the FDA coupled them with a process analytical technology (PAT) regulatory framework designed to support innovation and efficiency in manufacturing, pharmaceutical development, and quality assurance (5). Innovations and improved efficiencies are accomplished using many readily available PAT tools that can be applied to single-unit operations or to entire manufacturing processes. Such technologies are used for data acquisition, multivariate experimental design, process control, and product quality analysis, among other things.
Amgen has embraced opportunities presented by the PAT framework and promoted strategic digitalization initiatives to achieve improved reliability, efficiency, and agility across all operations, including biologic DS manufacturing. This digital transformation is driven by implementation of cloud-based data management systems that allow for retrieval, storage, processing, interconnectivity, analysis, and visualization of vast amounts of data that are collected through physical sensors and PAT tools.
Integrating such a data-rich environment with built-in data science and analytics systems has led to a culture across Amgen business operations that demands and relies on real-time monitoring, multivariate analysis, and online data visualizations. However, those tools mostly have been used — within Amgen and across the biotech industry as a whole — as “for information only” (FIO) in process monitoring (1, 6, 7), process understanding (4, 6, 7), and retrospective root-cause analysis (6, 7). Recently, researchers in the field have explored additional capabilities of PAT and data-science tools to build more advanced machine learning and predictive models (7–11), but such work also has operated as FIO or in a non-GMP environment.
Based on available knowledge and advances from colleagues across the field, Amgen is striving to go beyond such applications by exploring and implementing advanced real-time monitoring and predictive models in its manufacturing processes. Those models are used by manufacturing personnel for decision-making on the floor. We present herein four use cases of models that are used to provide real-time insights and predictions for making data-smart and reliable decisions during DS manufacturing operations.
The four use cases presented herein have been implemented for different products made at two different facilities. Since the deployment of the first predictive model, these use cases have been improving production run rates, increasing efficiencies in sample testing, and providing cost savings by reducing inefficient and time-consuming labor. These use cases provide a glimpse into our company’s future as it continues to identify opportunities to increase efficiency and execution speed through a digital transformation across all business operations.
Software
We built our models by applying innovative calculations and using the predictive capabilities of SIMCA software, version 16.0, from Sartorius (12). We used the SIMCA-online program, version 16.1, for real-time monitoring and predictions (13). Both platforms comply with the requirements of 21 CFR part 11 for electronic documentation and were implemented in manufacturing under computer-system validation procedures. The validated classification allowed us to build and implement models that can be used to support GMP processes and as part of GMP procedures.
Results and Discussion
Overview: In our DS manufacturing facilities, critical process parameters (CPPs) are monitored and controlled to ensure that each process is executed as expected and that each product is made to the desired level of quality (1). Samples are measured routinely for product quality attributes (PQAs) and typically analyzed using at-line or off-line test equipment. CPPs, PQAs, and many other batch records and laboratory data are stored in manufacturing execution systems (MES) and laboratory information management systems (LIMS). Additionally, a data-management system collects data continuously from process measurements read by hundreds of sensors and PAT tools. Those readings are stored in OSIsoft PI historian databases.
Our company’s data infrastructure contains tools for translating the abundance of data into an ecosystem of models and reports that are used constantly to monitor and evaluate all active manufacturing activities. That has opened an opportunity for us to explore more advanced models. The following four use-case models were developed and implemented in manufacturing not only to provide real-time FIO monitoring, but also to help operators make timely decisions on the manufacturing floor. Doing so ultimately increases plant productivity, preclude invasive activities, and improve efficiency during at-line and off-line sample testing.
The models in all four cases were implemented using a similar strategy. Although the model outputs in Cases 1–3 inform GMP procedures to make on-floor decisions, the actual and documented values come from traditional techniques (off-line or at-line testing). Thanks to the prediction models, however, those techniques no longer cause interruptions in process operations. For risk-mitigation purposes, the traditional techniques also serve as a backup when a predictive model does not activate for a particular batch, a prediction raises a model alarm, or a prediction’s uncertainty is too great.
Similar mitigation strategies also were implemented for Case 4, in which existing manual calculations and procedures could be applied when the advanced model is not available during a particular process activity. Table 1 briefly summarizes each case and lists the benefits obtained from implementing the models. Each case is described in more detail below.
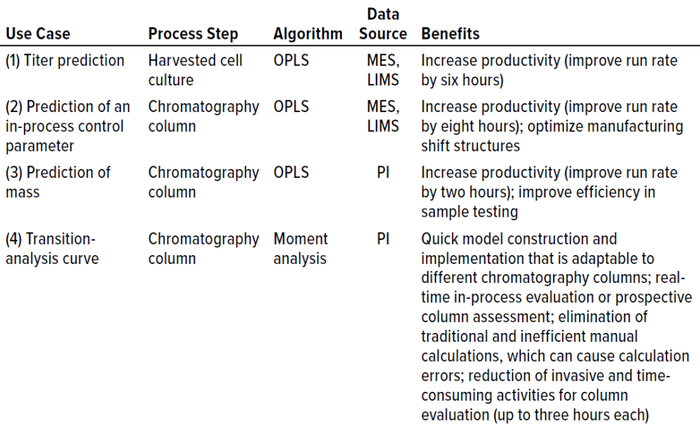
Table 1: Summary of use cases and associated models; OPLS = orthogonal partial least
squares, MES = manufacturing execution system, LIMS = laboratory information
management system, PI = OSIsoft PI historian.
Case 1 — Predicting Titer: For one of our biological products, the product titer in the cell-culture harvest determines the number of cycles needed at the next unit operation, the first chromatography column. Previously, titer was measured by taking a sample from the harvested pool and running an off-line test at an analytical testing laboratory. The results were made available and reported about six hours later, thus causing an idle period that lowered the process run rate and reduced plant productivity. That type of process bottleneck is common in the biomanufacturing industry (11), and it presented an opportunity to apply an advanced model to predict titer during harvest. Floor personnel now use such a model to make informed decisions on their activities and continue further processing with minimal idle time. The actual titer measured by the off-line test is recorded and eventually reported as the actual value.
The data set used for predicting titer consists of discrete data recorded in MES during cell culture and harvesting processes. Such records include parameters related to a cell culture’s environmental conditions (e.g., pH and dissolved oxygen (DO)), cell characteristics (e.g., viability and viable cell density), and metabolic concentrations (e.g., glucose and lactate). The data also include details of culture-feed timing and volumes as well as time elapsed for multiple process steps.
We built a batch-level model (BLM) applying an orthogonal partial least squares (OPLS) algorithm. In Figure 1, the predicted values appear as circles inside a confidence interval; diamond shapes represent the actual values. The model was configured in SIMCA-online software to provide real-time predictions during the harvest step. Our MES provides all input parameters, which are fed into the model one to two hours after being recorded. The prediction updates several times as new parameters become available during harvest. As a summary of fit, the model has a coefficient of determination (R2) of 0.91 and a predicted variation (“goodness of fit,” Q2) of 0.85.
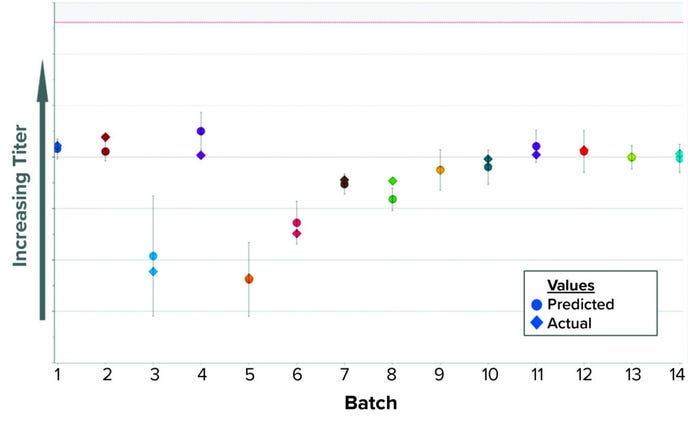
Figure 1: Historical predictions of harvest titer.
Case 2 — Predicting an In-Process Control Parameter: For a different biological product, downstream operations begin with several activities related to inclusion body (IB) recovery. Harvest material passes through a depth filter before reaching the first column chromatography (Figure 2). At the end of that first chromatography step, a pool sample is extracted to run an off-line test at an analytical testing laboratory. That test measures a required in-process control parameter that determines the mode of operation for the second column chromatography. Results from the off-line test can take up to 12 hours to be reported, thus causing a significant idle period that lengthens the overall process run time (Figure 2).
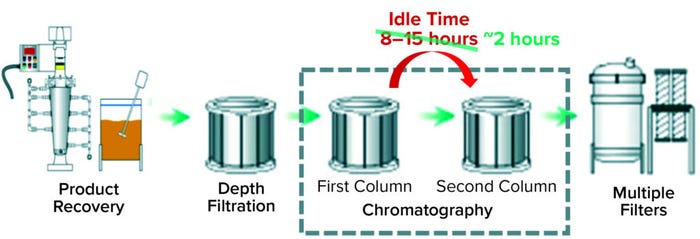
Figure 2: Recovery and purification processes of the biological product for which models in Cases 2 and 3 were built; Case 2 reduced idle time between the first and second chromatography columns to two hours, and Case 3 addressed the remaining delay.
Using the same approach as in Case 1 — applying an OPLS algorithm to BLM — we built a model to predict that in-process control parameter while the first column chromatography is running. In Figure 3, predicted values appear as circles inside a confidence interval; diamonds represent the actual values. Inputs to this model include parameters recorded in MES from all previous downstream steps up to the end of the first column chromatography. Most of those inputs come from the earliest steps (IB recovery) that occurred one or two days earlier. Hence, when the model is activated at the start of the first column, the initial predictions are highly accurate because most inputs are already available. Among the model’s input parameters are product concentration, quantity of recovered product, process elapsed time, weight, and equipment rotational speed. As a summary of fit, the model has a R2 of 0.64 and a Q2 of 0.53.
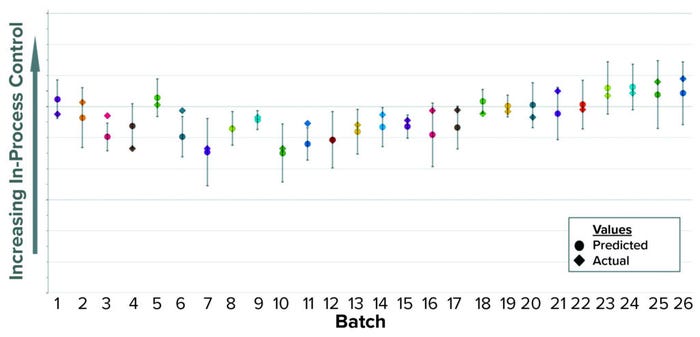
Figure 3: Historical predictions of an in-process control parameter.
Implementation of this predictive model in GMP procedures reduced the idle time between chromatography steps by about 10 hours, eliminating the need to wait for results from the laboratory. The time savings also increased efficiency by allowing for reallocation of laboratory and manufacturing resources, helping us to optimize our manufacturing shift structure. The actual in-process control parameter measured by the off-line test is recorded and eventually reported as the official result.
Although Case 2 significantly reduces idle time between the first and second column chromatographies, two hours of idle time remain from an at-line test required to measure protein concentration at the end of the first column. That remaining idle time presented an additional opportunity to apply a different predictive technique that had not been used at our commercial manufacturing plants before. This predictive technique is detailed in Case 3 below.
Case 3 — Predicting Mass: Overview: This work addresses the roughly two-hour idle time that remained between the first and second column chromatographies after implementing the model in Case 2 above. An at-line test required before the start of the second column measures pool concentration, which in turn is used to calculate product mass collected from the first column. That first column uses an equilibrated ion-exchange resin to bind the desired product while allowing other proteins to flow through. Then an elution buffer is used to displace the bound proteins and collect the product pool only during a specified range of UV-absorbance values. Thus, the UV signal is measured continuously during the process and recorded in PI historian.
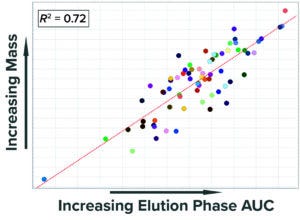
Figure 4: Correlation of mass collected at
the end of the elution phase with the area
under the curve (AUC) of UV absorbance
measured during the same step.
Previous analyses demonstrated that the numerical integration (area under the curve (AUC)) of UV absorbance during the elution phase (pool collection) correlates well with the collected product mass (Figure 4). Given that correlation, we built a SIMCA model that calculates the AUC of the UV signal during the elution phase and uses that value to predict accurately the mass collected from the first column. UV absorbance recorded in PI historian is the only input parameter, which simplifies building and configuration of the model.
Model Building: Assume that f(t) is a function that describes an equipment signal measured over time, t. Thus, the AUC for that signal from time a to time b is ∫ab f(t) ∙ dt. That integration can be estimated numerically using the Trapezoidal Rule method (14).
If the signal is measured and recorded at equal time intervals i, and the two heights of trapezoid x are defined as f (a + (x ∙ i)) and f (a + (x + 1) ∙ i), then area Ax can be obtained through Equation 1. Hence, the estimated AUC of the signal is expressed by Equation 2. The numerical integration described therein can be implemented in SIMCA software to estimate AUC for UV absorbance. Those calculations require use of the mathematical functions in the “SIMCA Functions” box, which are readily available in the software.
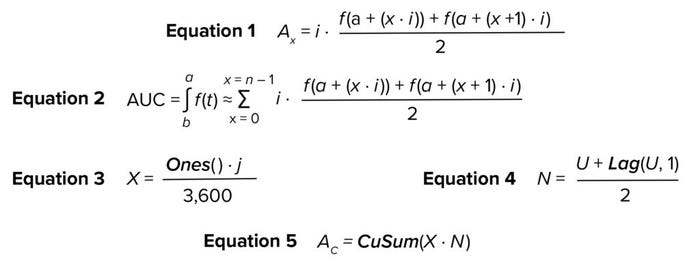
Equations
Let U be a vector containing UV absorbance values measured over a specified period (e.g., duration of column chromatography elution). Thus, the first step is to calculate a vector X, for which all values are the rate of collection of the UV absorbance measurements. Vector X has a length equal to U and represents the width of the trapezoids. X can be obtained through Equation 3, where Ones() is a function that returns a vector in which all values are one; j is the collection rate of UV absorbance in seconds (e.g., 10 seconds) and 3,600 is a factor to convert seconds to hours. Equation 3 corresponds to all values of i in all the terms being summed in Equation 2. Let N be a vector that contains the average height of each trapezoid; N is obtained through Equation 4, in which Lag(U,1) returns a vector that lags U by one step. N corresponds to the second factor in all terms being summed in Equation 2. Finally, Equation 5 calculates AC as a vector containing the cumulative sum of the trapezoidal areas.
For a given batch, the last value obtained with AC represents the total AUC of the UV absorbance signal over a specified phase duration. Figures 5a and 5b show the raw values of UV absorbance and their corresponding AC values, respectively, for different batches. Up to this point, the data set containing UV absorbance and AC are arranged as a time series in which each column contains a single parameter, and the values for each parameter are arranged by rows in time sequence. This data set format is used for generating batch evolution models (BEMs), which are useful for monitoring continuous process parameters of a batch as it progresses over time. To build the predictive model, however, the original AC values need to be transformed to a BLM data set.
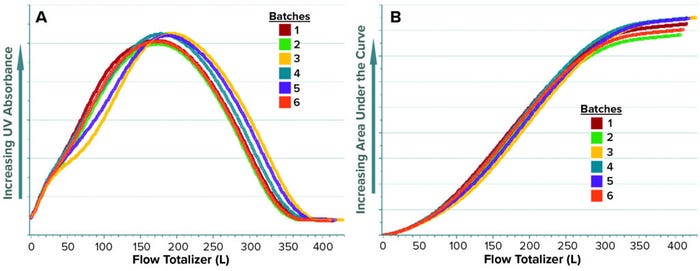
Figure 5: Time-series trends of UV absorbance (a) and corresponding total area under the curve (AUC), AC (b) for elution phase of multiple batches.
The data transformation entails transposing the entire column of AC values into a new data set containing one batch per row. Time-series values for each batch now are arranged horizontally, and columns are aligned by time to ensure that each column has data for the same time point. Historical values of step mass are added later as a new column and matched by batch number. The mass column becomes the predictive variable when OPLS is applied to the new BLM. When configured in SIMCA-online software, the model predicts mass at the end of the elution phase using only the recorded UV signal. In Figure 6, predicted values appear as circles inside a confidence interval; diamond shapes represent the actual values. As a summary of fit, this model has a R2 of 0.86 and a Q2 of 0.83.
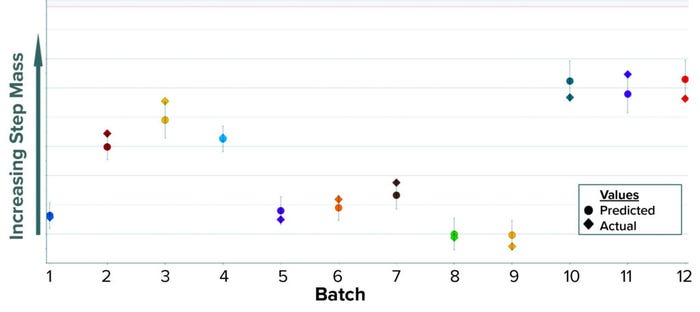
Figure 6: Historical predictions of step mass at the end of the elution phase for the first
column chromatography.
Benefits: The mass-prediction model addressed the roughly two-hour idle time that remained between the first and second column chromatographies, thus further reducing the batch process execution time after the Case 2 model was applied. This Case 3 model also improves efficiency in sample testing by optimizing use of the equipment required for measuring protein concentration. Finally, the model was significantly faster and easier to build and configure than are other typical predictive BLM models (e.g., Cases 1 and 2) because UV absorbance was the only input parameter required.
Case 4 — Transition Analysis (TA) Curve: We regularly monitor the integrity and efficiency of our column chromatography unit operations to ensure that they perform as desired. We often monitor them with transition analysis (TA), which is a common technique used in the biopharmaceutical industry to evaluate the condition, degradation, and efficiency of a chromatography column. TA consists of collecting high-frequency data and processing them with complex algorithms for filtering, interpolating, and obtaining a first derivative (15). Historically in DS manufacturing, TA has been performed by manually pulling process data into spreadsheet software (e.g., Microsoft Excel) to perform subsequent calculations. Such programs often provide extensive lists of mathematical functions, some of which facilitate TA. However, the spreadsheet method is prone to errors because it requires manually querying and transforming process data. The approach is also time-consuming and thus delays associated operations.
We developed a method to compute a TA curve in real time, during column testing. SIMCA mathematical functions are limited and do not include those functions necessary to generate the TA curve. However, we combined available mathematical functions to mimic the complex functions required to generate the TA curve. It is obtained and plotted in near real time as soon as a manufacturing column activity concludes (Figure 7). Full details of the new method we developed to compute the TA curve are published elsewhere (15).
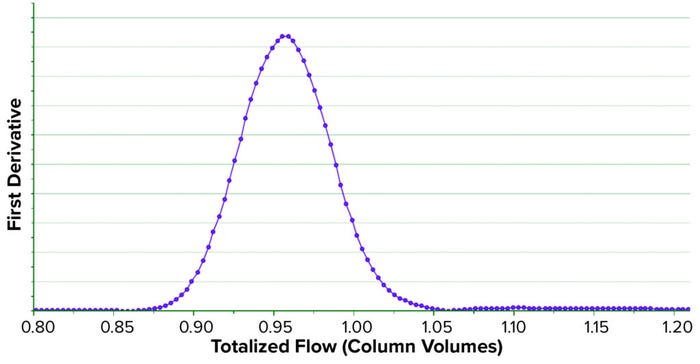
Figure 7: Transition analysis curve (TAC) obtained in near real time during the storage
phase of a column chromatography.
Benefits: The model replaces the time-consuming and tedious process of computing TA off-line. The TA models are easy to build because they require querying and processing of only a few continuous process parameters. The models also can be adapted and built easily for any desired chromatography step and activity within that unit. Therefore, they can be used to evaluate columns during normal batch-process operations or during nonroutine testing activities. We believe that such models soon will be able to reduce and replace invasive, expensive, and time-consuming activities that are conducted presently for evaluating the state of chromatography columns.
Demonstrated Usefulness
Cases 1 and 2 above showed what is possible when building a predictive BEM that uses discrete data recorded in data systems such as MES and LIMS. Although both models are accurate, they take time to build and implement because of the large number of input parameters that needed to be queried, organized, and configured. Whereas the model in Case 3 provided predictions through a BEM, the model input is simply one parameter read from PI historian. That provides a model that is easier and faster to implement than those in Cases 1 and 2. Case 4 demonstrated that advanced models do not necessarily consist in those with predictive capabilities; instead, powerful real-time models can be produced through clever use of simple and readily available mathematical functions.
All four use cases were made possible by our company’s data infrastructure, which enables seamless collection, storage, retrieval, and interconnectivity of many data systems. That provides the foundation on which our data science and analytics platforms have been built. The four cases above demonstrate that such platforms are useful for more than just R&D, process development, or business operations; they also present major opportunities in commercial manufacturing. We took advantage of those opportunities and proved that digital innovation can help maintain product consistency, increase efficiency, and ensure product quality. These four use cases represent models applied in DS biomanufacturing, but they illustrate just a fraction of all the digital innovations currently being pursued throughout our company in its continued efforts to serve “every patient, every time.”
Acknowledgments
We recognize the following Amgen colleagues for all their contributions to the work presented here: Melvin Ortiz, Giselle Barreto, Ruby López, Cynthia Castro, Christopher Garvin, Christine O’Sullivan, Michelle Burgos Ortiz, Pablo Rolandi, Ayush Anand, Omayra Rivera Denizard, Miguel Ayala, and Edgar Acevedo.
References
1 Wasalathanthri, et al. Technology Outlook for Real-Time Quality Attribute and Process Parameter Monitoring in Biopharmaceutical Development — A Review. Biotechnol. Bioeng. 117(10) 2020: 3182–3198; https://doi.org/10.1002/bit.27461.
2 Pharmaceutical CGMPs for the 21st Century: A Risk-Based Approach — Final Report. US Food and Drug Administration: Rockville, MD, September 2002; https://www.fda.gov/media/77391/download.
3 Pharmaceutical Quality for the 21st Century: A Risk-Based Approach — Progress Report. US Food and Drug Administration: Rockville, MD, May 2007; https://www.fda.gov/about-fda/center-drug-evaluation-and-research-cder/pharmaceutical-quality-21st-century-risk-based-approach-progress-report.
4 Sokolov M, et al. Fingerprint Detection and Process Prediction by Multivariate Analysis of Fed-Batch Monoclonal Antibody Cell Culture Data. Biotechnol. Prog. 31(6) 2015: 1633–1644; https://doi.org/10.1002/btpr.2174.
5 Guidance for Industry: PAT — A Framework for Innovative Pharmaceutical Manufacturing and Quality Assurance. US Food and Drug Administration: Rockville, MD, 2004; https://www.fda.gov/media/71012/download.
6 Maiti S, Spetsieris K. Advanced Data-Driven Modeling for Biopharmaceutical Purification Processes. BioProcess Int. 19(9) 2021: 44–51; https://bioprocessintl.com/manufacturing/process-monitoring-and-controls/advanced-data-driven-mvda-modeling-for-biopharmaceutical-purification-processes.
7 Mleczko M, Maiti D, Spetsieris K. Multivariate Data-Driven Modeling for Continued Process Verification. BioProcess Int. 19(10) 2021: 40–50; https://bioprocessintl.com/2022/september-2022-featured-report/development-of-a-stand-alone-monitoring-application-for-purification-processes-in-biomanufacturing.
8 Bayrak ES, et al. Product Attribute Forecast: Adaptive Model Selection Using Real-Time Machine Learning. IFAC PapersOnLine 51, 2018: 121–125; https://doi.org/10.1016/j.ifacol.2018.09.286.
9 Tulsyan A, Garvin C, Ündey C. Advances in Industrial Biopharmaceutical Batch Process Monitoring: Machine-Learning Methods for Small Data Problems. Biotechnol. Bioeng. 115, 2018: 1915–1924; https://doi.org/10.1002/bit.26605.
10 Tulsyan A, et al. Automatic Real-Time Calibration, Assessment, and Maintenance of Generic Raman Models for Online Monitoring of Cell Culture Processes. Biotechnol. Bioeng. 116, 2019: 2575–2586; https://doi.org/10.1002/bit.27205.
11 Rüdt M, et al. Real-Time Monitoring and Control of the Load Phase of a Protein A Capture Step. Biotechnol. Bioeng. 114(2) 2017: 368–373; https://doi.org/10.1002/bit.26078.
12 SIMCA® Multivariate Data Analysis Solution. Version 16.0.2.10561 (64-bit). Sartorius Stedim Data Analytics AB: Goettingen, Germany, 2020.
13 SIMCA®-Online. Version 16.1.1.16164 (64-bit); Sartorius Stedim Data Analytics AB: Goettingen, Germany, 2020; https://www.sartorius.com/en/products/process-analytical-technology/data-analytics-software/support/knowledge-base/simca-online-1611-550538.
14 Rousan KA. Trapezoidal Rule: A Method of Numerical Integration. Cantor’s Paradise 2 July 2020; https://www.cantorsparadise.com/trapezoidal-rule-a-method-of-numerical-integration-5772838657b3.
15 Rosado PJ, et al. Real-Time Transition Analysis Curve in Column Chromatography with SIMCA®. Euro. Pharm. Rev. 26(5) 2021: 62–66; https://www.europeanpharmaceuticalreview.com/article/164272/real-time-transition-analysis-curve-in-column-chromatography-with-simca.
Pablo J. Rosado ([email protected]) is a process development data scientist, Badua Merheb ([email protected]) is a data sciences senior manager, and Alejandro Toro ([email protected]) is currently the executive director of drug substance process development, all at Amgen Manufacturing Limited in Juncos, Puerto Rico, supporting commercial operations for bacterial fermentation and mammalian cell culture manufacturing plants.
SIMCA is a registered trademark of Sartorius AG; Sepharose is a registered trademark of Cytiva.
You May Also Like


