Product Quality Attribute Shifts in Perfusion Systems, Part 1: Identifying Shifts When They OccurProduct Quality Attribute Shifts in Perfusion Systems, Part 1: Identifying Shifts When They Occur
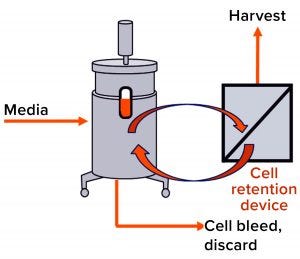
Figure 1: Simple schematic overview of a mammalian cell culture perfusion system
Perfusion cell culture processes are continuous, with fresh media continuously added and spent media (harvest) removed simultaneously through a cell-retention device (Figure 1). To maintain specific bioreactor cell density, cells are removed periodically as cell bleed or discard.
Perfusion systems offer a number of advantages over batch and fed-batch culture modes such as lower capital costs and an ability to support higher cell densities with better viability over longer manufacturing campaigns requiring shorter turn-around times. However, perfusion systems require complex operations monitoring and control because of their cell-retention systems.
At a steady state, a cell culture perfusion system has attained a target cell density with constant parameters such as media and harvest flow rate, cell viability, and pH and O2/CO2 levels. At this point, typically maintained throughout the production campaign, cells are expected to generate a consistent product quality profile. Here we discuss a case study of a routine cell culture campaign run at a steady state in which an atypical trend in one product quality attribute (PQA) was observed at the drug substance (DS) stage (Figure 2). Investigational analysis of a number of cell culture and purification process parameters indicated in this case that a decrease in cell-retention device efficiency had led to the observed atypical PQA.
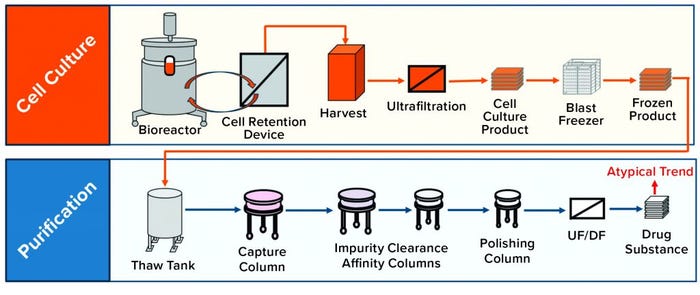
Figure 2: Case study schematic overview of a mammalian cell culture perfusion system and subsequent purification process; an atypical product quality trend was observed at the drug-substance (DS) stage.
Case Study: Figure 2 gives an overview of the mammalian cell culture perfusion system and subsequent purification process. During routine perfusion cell culture campaigns, which can last up to several months, it is typical to start collecting harvest/product after the process has attained a steady state. In one of these routine cell culture campaigns, an atypical PQA trend was observed at the DS stage (Figure 2) in the early-to-middle campaign stage. This atypical trend was an upward shift in the level of low–molecular-weight (LMW) product variations present (Figure 3a), indicated by one region in the size-exclusion chromatography (SEC) profile for the product (Figure 3b).
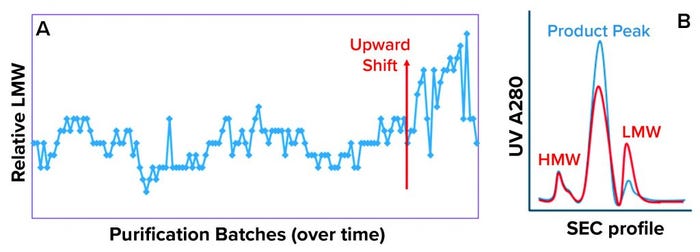
Figure 3: (a) Low–molecular-weight (LMW) drug-substance trend shows the start of an upward shift (red arrow); (b) size-exclusion chromatography (SEC) profile shows high–molecular-weight (HMW), product peak, and LMW regions. The blue profile indicates typical quality, whereas the red profile indicates atypical quality observed during the upward shift in the LMW trend.

Figure 4: Investigational approach used to identify the cause of upward shift in the LMW trend
Preliminary Investigation
Figure 4 shows the approach we used to identify the root cause for the upward shift in the LMW trend. Our investigation started by confirming that all critical process parameters (CPPs) had remained within operational ranges for the entire cell culture and purification process. We performed an extensive evaluation of raw-material batches, secondary vendor changes, and process changes (Figure 5). That work included multivariate analysis (MVA) using the raw materials’ certificates of analysis (CoA).

Figure 5: Extensive evaluation of raw material variations, secondary vendor, and process changes as potential causes for atypical LMW trend
Results: We found no correlation between process and raw material changes and therefore ruled out both as potential root causes for the upward shift in the LMW trend (Figure 5). Subsequently, we moved our investigational focus on to PQA correlations with the upward shift in the LMW trend. So we performed a correlation analysis for all DS PQAs (e.g., process step yield, protein concentration, host-cell impurity concentration, and glycosylation pattern) with the LMW trend. Our analysis indicated that all the DS quality attributes maintained typical trends and had no correlation except for one: the step yield from the affinity chromatography column (ACC).
LMW Correlation with Process Step-Yield Trend: The upward shift in the LMW trend was indirectly correlated with the ACC process step-yield trend (Figure 6). To confirm or rule out whether a specific ACC resin batch and/or pack lot (used during the purification process) was the root cause of the upward shift in the LMW trend, we performed a historical analysis (>500 DS large-scale lots) using the Tukey-Kramer method (Figure 7). This analysis confirmed an indirect correlation between LMW and ACC process step yield, which indicates that the levels of LMW present generally affect ACC process step yields. Thus, the specific ACC resin/pack lot was ruled out.
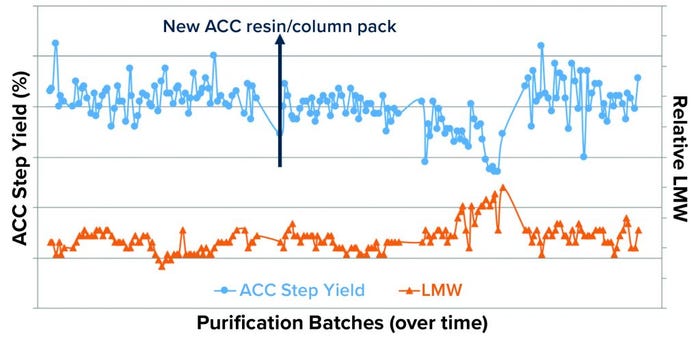
Figure 6: Plot of DS-stage LMW and purification intermediate ACC process-step yield trends shows an observable correlation between the upward shift in the LMW trend and downward shift in ACC step yields.
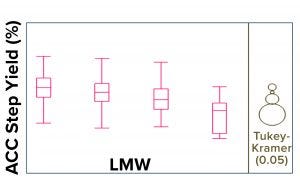
Figure 7: Historical Tukey-Kramer analysis (1) of >500 DS large-scale lots confirms an indirect correlation between LMW and affinity-chromatography column (ACC) process step yield.
The focus of our investigation then shifted to the incoming purification starting material and cell culture batches produced in two different buildings (A and B). We plotted the DS LMW data from both buildings as in Figure 8. The upward shift in the LMW trend was specific to cell culture batches produced in building A. Therefore, despite the indirect correlation between LMW and ACC step yields (Figures 6 and 7), we hypothesized that a root cause within the purification train was unlikely because if that were the case, then the high-LMW trend would have occurred in both of the cell culture buildings.
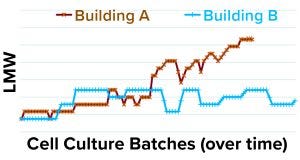
Figure 8: LMW data (y axis) for drug substance lots with cell culture batches/time (x axis) produced in buildings A and B.
Small-Scale Study Rules Out the Purification Process: To confirm that cell culture batches produced in building A were the only concern, we further assessed whether the large-scale purification process could be ruled out definitively as the cause for the upward shift in LMW trend in a scale-down study. We used a scaled-down model 1/300 of the large-scale purification process for our small-scale study.
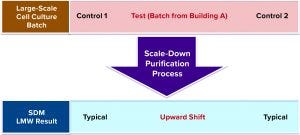
Figure 9: Small-scale study design with control (1 and 2) and large-scale cell culture test batches, which were purified using same scale-down purification process
As Figure 9 shows, the small-scale study was designed such that both the control and the test (large-scale) cell culture batches were purified using the same scale-down purification process. As expected, both control batches 1 and 2 yielded typical LMW values, and the test cell culture batch obtained from building A (Figure 8) gave higher LMW value. Therefore, we ruled out Building B cell culture batches as a root cause for high LMW trend.
Investigational Analysis
Cell Culture Operations in Building A: Because the upward shift in the LMW trend was observed in building A but not in building B, we narrowed down our investigation to only the cell culture operations in building A. There, cell culture parameters (see box above) had typical values or profiles throughout the cell campaign.
Cell Culture Operational Parameters in Building A
Base consumption Cell aggregation Cell density Cell discard levels Cell return pump rate Cell viability Cell-specific perfusion rate Dissolved oxygen levels Glucose levels Glucose/lactate ratio Harvest cell viability | Harvest flow rateHarvest viable cell densityHead spaceJacket temperatureLactate levelsMedia temperaturepCO2pHSettler temperatureSparge rateVibration intensity |
Multivariate Analysis (MVA): To determine whether the parameters listed in the box influenced the upward shift in LMW trend, we performed MVA and found that MVA trends for three parameters (Figure 10) correlated with the upward shift in the LMW trend. All three parameters are indicators of cell retention performance.
The cell-discard frequency trend indirectly correlated with the LMW trend, whereas harvest viable-cell density (VCD) and cell culture aggregation trends both correlated directly with the LMW trend. Further evaluation of the cell culture operations during the early to midcampaign stage in Building A revealed that an abrupt change/adjustment had been made to the media and harvest flow rates. The media flow rate was decreased by 10% to accommodate limited harvest storage capacity. That change kept the flow rates within the system operational range and therefore had not been flagged during operations.

Figure 10: Multivariate analysis (MVA) trends for three cell culture parameters — cell discard frequency, harvest viable cell density (VCD), and cell culture aggregation — that have a correlation with the low–molecular-weight (LMW) trend in drug substance (product quality attribute). The x axis tracks cell culture campaign age, and the y axis shows the LMW trend. The color scheme of the data points correlates to the LMW values. Blue corresponds to lower LMW values, and increasing intensity colors from green to yellow to red correspond to an upward shift.
Application of Cell Culture Process Understanding: To explain the correlation between the lower media flow rate and increasing LMW trend, we applied our cell culture process understanding to the three parameter trends identified by the MVA results. Cell aggregation in bioreactors increases as a perfusion campaign goes on. When cell aggregation increases, the performance of the cell-retention device starts to decrease in efficiency as cells accumulate inside it. A key point to note here is that the bioreactor operates at a relatively high temperature, whereas the cell-retention device operates at a relatively lower temperature.
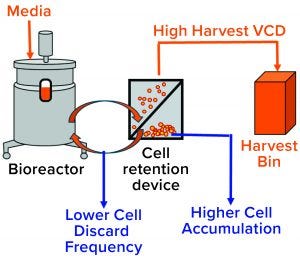
Figure 11: Higher cell accumulation in the cell retention device results in more viable cells getting swept into the harvest flow and lower cell discard frequency.
Identified Enhanced Cell Residence Time in Cell-Retention Device as the Root Cause for High LMW: After the media flow rate was lowered during the early to midcampaign stage (in combination with the cell aggregation that typically occurs), accumulation in the cell-retention device most likely increased significantly because of lower harvest and cell-return flow rates (from the cell-retention device to the bioreactor) compromising the performance of the cell-retention device. Higher cell accumulation in the cell-retention device caused more viable cells to being swept into the harvest flow and thus fewer to be discarded (Figure 11). Because the cell-retention device operates at lower temperatures compared with the bioreactor, we hypothesize that the enhanced cell residence time at such lower temperatures in the cell-retention device caused the upward shift in the LMW trend.
 Small-Scale Cell Culture Studies
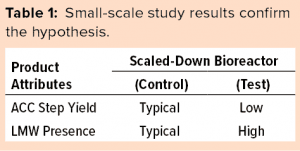
To confirm our hypothesis that enhanced cell residence time in the cell-retention device was the root cause for the high-LMW trend, we performed a small-scale cell culture study using bioreactors that were 15× smaller than in the large-scale process. We ran this small-scale study in scaled-down model bioreactors, one in a control condition (typical operational conditions) and the other in a test condition (abrupt change in media flow rate by 10%). The scaled-down model’s control- and test-condition cell culture batches were purified using the scaled-down purification model illustrated in Figure 9.
The results of our small-scale study (listed in Table 1) confirm that the test condition not only caused higher LMW, but also resulted in lower affinity chromatography yield in the downstream process.
In BPI’s November–December issue, the conclusion of this two-part article will provide further insight into the underlying cellular mechanisms that contribute to the upward shift in the LMW trend.
Acknowledgments
We are grateful to our Bayer colleagues in Berkeley for their help: Gary Chiueh for leading the investigation and, for supporting it, Danny Hernandez, Alan Goyke, Hung Ly, Amelia Ng, Ananth Parampalli, Carmen Chin, Kostas Spetsieris, Lidia Wojnowski, and Cary Matanguihan.
Corresponding author Prasad Pathange is director, and Venkatesh Srinivasan is vice president of manufacturing sciences and technology; and Yuval Shimoni is principal quality assurance specialist in the quality risk and knowledge management group; all at Bayer US LLC, 800 Dwight Way, Berkeley, CA 94710; [email protected].
You May Also Like


