Deciphering Nutritional Needs in Bioprocess Optimization: Targeted and Untargeted Metabolomics with Genome-Scale ModelingDeciphering Nutritional Needs in Bioprocess Optimization: Targeted and Untargeted Metabolomics with Genome-Scale Modeling
Microbiology has risen as a major part of global industry over the past three decades. Industrial microbiology, biotechnology, biopharma and now biointelligent production systems (1) embrace a wide range of manufacturing platforms and product areas involving microbes, animal cells, and plant cells — as well as whole organisms. The multibillion-dollar applications of biomanufacturing display great variety. They include microbial-based production of such valuable metabolites as amino acids, vitamins, solvents, and organic acids as well as larger products such as enzymes, vaccines, and antibiotics. Even larger protein molecules requiring eukaryotic secondary processing are expressed by higher animal cells, mainly Chinese hamster ovary (CHO) cell lines.
Recombinant DNA technology has improved many parameters in production of those products (2). Advanced molecular manipulations have been added to mutational techniques as a means of increasing expression titers and yields of both microbial and animal-cell–based processes while contributing to bioprocess intensification (3–5). Such improvements have been aided by smart factories and Industry 4.0, digitalization, and automation concepts (6). They have become major contributors in expanding the biopharmaceutical and bioingredients industries along with those producing health supplements and active biomass (probiotics and prebiotics) originating mainly from the large Lactobacilli group.
To date, only a limited number of published studies have demonstrated the application of metabolomics to the optimization of precision fermentation (PF) and culture media in light of key technical parameters in industrial-scale bioproduction. Our aim herein is to evaluate dynamics of spent-media metabolomics coupled with genome-scale modeling to decipher the nutritional needs of selected production hosts. It is increasingly imperative to control the manufacturing costs of all biomanufactured goods, including costs arising from culture media. Reasons include the number of emerging high-volume bioproducts (e.g., cultured meats, nutraceuticals, and microbiome-related therapies) in development, a widespread desire for the democratization of life-saving cell-based therapies, and the increasing number of PF and cell-sourced bioingredients companies entering the market. Media composition requires individual optimization to the needs of each production host, process mode, scale, and product type (7). And media need to be cost effective, safe, and compliant with regulatory requirements around the world.
Culture Media in Bioprocesses
To achieve the highest possible yield, whether a product is a metabolite or an active biomass, media for microbial fermentation and animal cell culture require tailoring and specific optimization for each cell platform (5–7). Meanwhile, bioprocess intensification is applied increasingly to improve the results from biomanufacturing. Historically, optimization of industrial bioproduction processes has been based on empirical and one-factor-at-a-time (OFAT) design approaches. Now companies must adopt more rational, knowledge- and data-driven, multiparametric approaches to identifying essential process, nutritional, and factor requirements for advancing industrial-scale bioproduction.
Typically, optimization of cell culture processes is performed by varying a few parameters (e.g., culture media composition, pH, and time) that are known beforehand to be critical to process outcomes. Culture media have been designed and optimized for each process — frequently even for different stages of the same process — ultimately resulting in a breadth of media formulation requirements. The main impetus of most fermentation and cell-culture media optimization efforts has been to reduce cost while maintaining high yields and quality of biomass production. Usually that is accomplished during transfer of new bulk products into large-scale production. And it is especially critical for cellular agriculture (CA), from which end products need to be affordable (see the “Cellular Agriculture” box).
PF processes and cell culture media are critical elements in all biomanufacturing that affect process yield, product quality, and price directly. Careful analysis of media variance and prediction of performance is highly important. The essential purpose of culture media is to provide an optimal physiological environment supporting large-scale culturing of cells so that they remain healthy for an appropriate period either to accumulate required biomass or express sufficient product with the necessary critical quality attributes (CQAs).
Many CQAs are affected directly by culture media and by specific, often unidentified changes in their composition (e.g., raw material variability), which can be the root cause of serious consequences in product quality/yield. To prevent expensive waste and low-density culture toxicity, special monitoring effort is directed to eliminating excess substrate components that simply would be discarded when active biomass or metabolites are separated from culture broth.
Growth limitations related to premature depletion of critical nutrients should be identified and mitigated as well. Key nutrients and metabolites need to be determined and their quantity and bioavailability monitored both in raw materials and in-process cultures through use of process analytical technologies (PATs). Finally, building a multidimensional design space around ideal process values by following the knowledge of limiting nutrients and accumulation of toxic secondary metabolites can be a means of growth maximization and yield improvement.
Most culture media made without animal serum nonetheless are complex molecular and elemental mixtures of salts, carbohydrates, nitrogen sources (e.g., free amino acids and/or peptides), vitamins, key metals, growth factors, and lipids. Among the raw material components used in culture media manufacturing, key nutrients often come in the form of hydrolysates from different protein sources such as yeast, soy, casein, and so on. Those hydrolysates themselves are complex mixtures of amino acids, peptides of different sizes, vitamins, minerals, and myriad other (often unknown) molecules and biochemical complexes. Hydrolysates — primarily yeast-based nutrients (YBNs) — contain many more distinct molecular components than do chemically defined media (8, 9).
Thus, hydrolysate-based media can display greater molecular and elemental variance that must be considered in biomanufacturing process development. That drawback is often mitigated by the superior strain latitude, robustness, and operational performance of such media over those of chemically defined formulations. That is in addition to the primary argument of the lower cost of goods (CoG) that hydrolysates can support. Increasing analytical knowledge and leveraging findings obtained through PAT regarding such complex bioprocesses should contribute to development of better and more streamlined media while reducing unit costs.
Fast Analytical Methods for Bioprocess Optimization
Before the institution of PAT — with its extensive use of in-line and at-line sensors — fermentation and cell culture processes traditionally were investigated using high-performance liquid chromatography (HPLC) coupled with mass spectrometry (LC-MS) for amino acids and sugars. Such analyses tended to be carried out at critical fermentation time points (e.g., around the optimal harvest point).
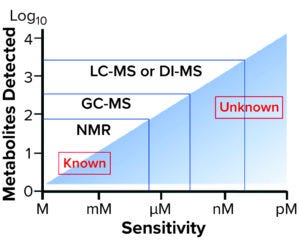
Figure 1: Sensitivity and performance of different platforms used in metabolomics — adapted from Goldansaz SA et al. (12) DI-MS: direct-infusion mass spectrometry GC-MS: gas chromatography with mass spectrometry LC-MS: liquid chromatography with mass spectrometry NMR: nuclear magnetic resonance
Although amino acids and sugars are the main substrates by mass in biochemical reactions, their measurement is not sufficient to characterize complex bioprocess requirements comprehensively. Untargeted gas chromatography coupled with mass spectrometry (GC-MS) complements LC-MS with robustness and sensitivity to volatiles and semivolatiles, making the technique popular for component dynamics interpretation and modeling based on rich metabolite databases. Using both methods enables developers to assign and quantify robustly the relative concentrations of hundreds of compounds in culture-media samples (Figure 1). The combination is used widely in a number of food-control and nutritional-metabolomics applications in spite of significant limitations related to the nonvolatility of many metabolites.
Many spectroscopic analytical methods have different sensitivities that can be applied to culture media analysis. A large number of recent literature reviews describe the need for PAT in both biopharmaceutical and bioingredients manufacturing (10, 11). Those publications provide extensive background detail on how rapid spectroscopic techniques could be incorporated into bioprocess development and biomanufacturing control, making them directly relevant to culture-media analysis. The most potent methods include electronic spectroscopies including UV–vis absorption and fluorescence; vibrational spectroscopies including near-infrared (NIR) absorption and Raman scattering; and nuclear magnetic resonance (NMR) spectroscopy. Correct application of a comprehensive set of analytical methods (Figure 1) requires an in-depth appreciation of practical difficulties in dealing with chemically complex mixtures. Raw-materials analysis of culture media plays a critical role in the collection of precise, accurate, and reproducible data required for development of robust analytical methods for bioprocess optimization.
Over the years, multiple analytical strategies for improving process control have been implemented in media profiling using NMR and NIR — which are the most frequently applied strategies because of their ability to provide rapid access to significant compositional information (13, 14). The limited sensitivity of both techniques nevertheless prevents detection of many media components that may be present at levels below parts-per-billion. For example, chemometric profiling of YBNs analyzed by NMR have failed to demonstrate clear correlation between hydrolysate lots and antibody titers — presumably because of the limited number of features originally determined through such an approach. By contrast, LC methods coupled with MS detection can provide improved sensitivity and selectivity, facilitating quantitation of trace-level components (Figure 1).
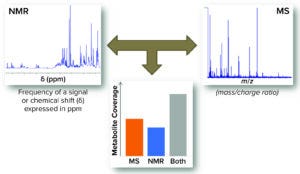
Figure 2: Complementarity of nuclear magnetic resonance (NMR) and mass spectrometry; combining data from both technologies provides a higher metabolome coverage and consequently improves overall quality of the study — adapted from Marshall and Powers (17).
Metabolomics, a Comprehensive Biochemical Profiling: High-throughput “-omics” technologies for genomics, transcriptomics, proteomics, and metabolomics have emerged as important tools for understanding the biology of organisms and their response to environmental stimuli and genetic perturbation (15, 16). As Figure 2 illustrates, leveraging a chemometric approach coupled with metabolomics (LC-MS and NMR) supports generation of new insights into the metabolism of a given biological host (whether microbes or cells). Combined with PAT, that can provide a holistic method for monitoring and dynamically fine-tuning PF and cell culture processes.
Metabolomics is comprehensive analysis of metabolites in a biological entity or sample. This emerging technology offers promise for optimizing PF and cell-based bioprocesses. It includes the study of biochemical pathways and fluxes involving metabolites: small-molecule intermediates and metabolism end products. Metabolomics provides a first-line means of phenotyping cells/microbes, tracking variations in their metabolite levels, and mapping those through fitting biochemical pathways. Overall, this represents a powerful approach to improving our understanding of the nutritional needs of cells and microbes for highlighting their potential auxotrophies.
Metabolome refers to the complete set of metabolites in a biological system. No single profiling experiment can be comprehensive enough to cover a whole metabolome because of the diversity of small molecules that it contains (18). Metabolomics makes use of two technologies: mass spectrometry and nuclear magnetic resonance. The MS usually is coupled with either gas or liquid chromatography; NMR requires no prior separation of constituents before analysis. Although some overlap exists, different analytical techniques give access to different “portions” of the metabolome. For that reason, combining two or more methods such as NMR and LC-MS increases overall metabolome coverage to provide a more complete view of the system’s global composition than either can provide alone.
We have succeeded in applying both untargeted and targeted approaches for comprehensive characterization of YBNs (yeast extract and yeast peptones) by LC-MS, NMR, and GC-MS, which together enabled us to quantify hundreds of biochemical components (Figure 3).
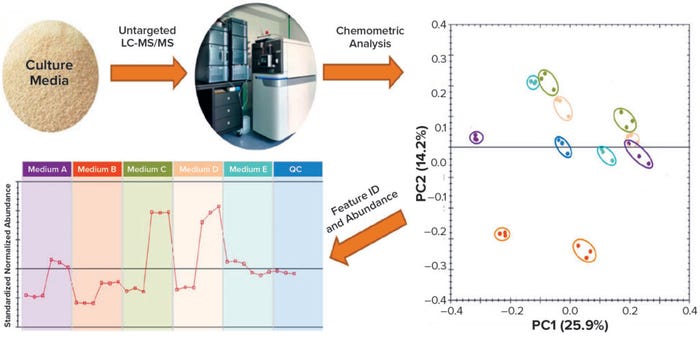
Figure 3: Culture-media metabolomics analysis approach from an untargeted method based on liquid chromatography with tandem mass spectrometry (LC-MS/MS) to data curation, pooling, and assignation; PC = principal component.
Metabolic Modeling at the Genome Scale
Mathematical computer modeling is an established tool for biology. As models improve and relevant analytics/databases grow, they should provide more reliable system-wide predictions from (and elucidation of) currently understood metabolic and phenotypic activities.
A genome-scale metabolic model (GEM) is a mathematical representation of the metabolism for an organism. GEMs provide extensive gene-to-reaction-to-metabolite connectivity through two matrices: the S matrix for associating metabolites to reactions and the rxnGeneMat matrix associating reactions with corresponding enzymes and genes.
GEMs have yet to be developed for most microorganisms and cells used in bioprocessing. A lack of comprehensive and high-quality GEMs for model organisms restricts translational use of -omics data accumulated from empirical growth and expression models. Hence, construction of high-quality, strain-specific, genome-scale metabolic networks is an important goal in systems biology (19). GEM has the significant advantage of leveraging the value of an exponentially growing pool of genomics data and enabling their integration with other biological knowledge in a structured format (20). Converting a network reconstruction into a GEM enables quantitative and qualitative analysis of reconstructed metabolic networks using constraint-based methods.
Genome-scale metabolic networks of model strains and cell lines preferably are reconstructed through a semiautomated approach. Draft network reconstructions can be generated using the Model SEED database (https://modelseed.org), from which reaction identifiers can be converted to reaction identifiers in the BiGG database (http://bigg.ucsd.edu). The corresponding reaction descriptions, metabolite identifiers, and reaction formulas are subsequently retrieved from the latter database (21). Draft reconstructions should be subjected to manual curation following a pathway-by-pathway approach that ultimately can provide for an improved functional genome annotation of a given cell line or strain. The resulting model can be reinforced by integrating information from multiple databases that can be accessed through the Integrated Microbial Genomes system (https://img.jgi.doe.gov) (22).
When biochemical, physiological, or genomic evidence of further reactions is found, they can be included in the draft reconstruction from the BiGG database. Similarly, reactions that originally were included in the draft reconstruction can be removed later if their presence in the strain and/or cell line cannot be verified. Finally, the refined metabolic network reconstructions of a model microorganism or cell can be converted to a mathematical format by construing the stoichiometric coefficients of curated reactions using the COnstraint-Based Reconstruction and Analysis (COBRA) Toolbox within MATLAB software (23).
Determination of Nutritional Requirements: Designing the most efficient culture media for a model organism requires primary assessment of their nutritional requirements. Subsequent to the initial model debugging and refinements, individual GEMs as described above can be used to identify the essential nutritional requirements for each model through in silico single- and multiple-omission experiments. In such an approach, the uptake rate is set to zero for one nutrient at a time before optimization for biomass or metabolite formation, for instance. As a result, if no growth is predicted, the nutrient or the group of nutrients can be deemed essential. Developers can leverage their initial observations to identify several candidate key nutrients for use in formulating more effective growth media later.
With the objective of identifying which potential key nutrients are essential for model organisms, in vitro omission experiments are performed in basal media, with one or more nutrients omitted at a time (or together). For example, trace elements, vitamins, and amino-acid requirements can be evaluated using both pure substrates and complex YBNs. In silico predictions regarding the models’ prototrophy for those nutrients that were already included in the generic culture media are validated experimentally.
Applied Metabolomics and Genome-Scale Modeling Results: Metabolomics is a profiling strategy that enables rapid and simultaneous evaluation of numerous extracellular metabolites and culture media constituents. Monitoring primary and secondary metabolites is crucial for bioprocess optimization (24). The approach enables rational development of PF and cell culture media by enabling insights into cell/strain nutritional needs. Use of metabolomics in fermentation monitoring — called fermentanomics PF — reveals metabolically stimulatory, inhibitory, and inactive compounds in culture media or broth (25).
The Need for Analysis
During culture, media or broth are consumed: depleted of primary metabolites, metabolically active components, substrates, stimulatory raw materials, and nutrients. Cells in culture also produce secondary metabolites: products of culture, metabolism end-products, and inhibitory waste. Although metabolomics can be applied to individual samples, the strategy’s purpose is to provide information through comparison of two or more samples, states, or groups to detect differentiating molecule/marker levels.
Simply knowing the composition of a given sample in excruciating detail is potentially useless. However, identifying a metabolite that makes for a difference in bioprocess yield can be extremely useful. Metabolomics has been applied to cells and microorganisms mainly to help scientists understand their metabolic activities and pathways (26, 27). In such a context, small-molecule dynamics are considered to be an expression of the biological system’s phenotype. Until recently, few published studies have focused on cell nutrition through culture-media composition monitoring (28, 29). Using such an approach makes it possible to identify essential nutrients and active metabolic end-products simultaneously.
Means of Analysis: NMR is a powerful technique for identifying metabolites even in complex mixtures (Figure 4). The NMR profile of a sample can be thought of as its “fingerprint,” with inherent information to identify or support conclusions regarding raw-material features, culture conditions, culture-media components, and so on. That spectrum output from an NMR analysis contains both qualitative and quantitative information (30). Both position and profile of a signal in that spectrum characterize specific metabolites to allow their identification. The intensity of those signals in a spectrum is proportional to the concentration of metabolites generating those signals (Figure 4).
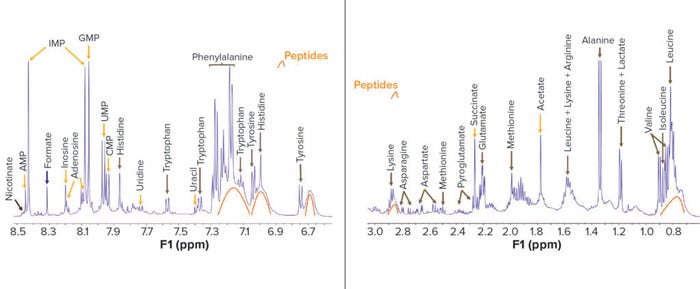
Figure 4: Qualitative information obtained from the proton NMR spectrum of a yeast-based nutrient with identified molecules tagged; a molecule can show more than one signal in the spectrum. Here, two portions of the spectrum show components present at concentrations of 3.0–0.6 ppm and 8.5–7.9 ppm. In 2D NMR, the frequency axes are F1 (indirect dimension) and F2 (direct dimension). AMP: adenosine 5′-monophosphate CMP: cytidine 5′-monophosphate GMP: guanosine 5′-monophosphate IMP: inosine 5′-monophosphate UMP: uridine-5′-monophosphate
NMR can be used to analyze small metabolites that are present down to micromolar concentrations. A single comparison of the medium from before inoculation of a culture (t0) to that remaining after fermentation/cell culture (tf) provides information on nutritional needs and potential auxotrophies of the cultured microorganism or cell type (Figure 5), the metabolic pathways involved, and the nature of inhibitory secondary metabolites.
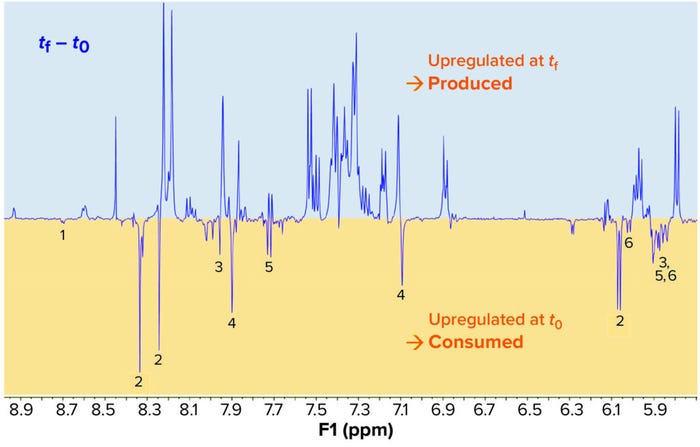
Figure 5: In this fermentation kinetics study using NMR-based metabolomics, a yeast-based nutrient was used as the source of nitrogen, glucose, and carbon in culture of a model microorganism. Only a portion of the whole spectrum is presented here (9.0–5.7 ppm).
1Niacinamide (vitamin B3) 2Adenosine 3Guanosine 4Histidine 5Uridine 6Cytidine
Applying Results to Optimization: Upward signals come from molecules produced during culture/fermentation; downward signals arise from consumed nutrients. Qualitative analysis of the resulting graph from a single experiment provides a great deal of information. Compared with defined media and single-component omission, this approach offers more agility in identifying essential nutrients.
Another easy way to discover differences between spectra is to superimpose them. In Figure 6, production of organic acids during fermentation is clear. Statistical analysis of the spectral data can provide a biplot graph in which compounds overexpressed between t0 and tf become obvious (Figure 7). A biplot is a variable projection graph comparing two states or samples. In this case, the plot was built from the most discriminant variables. Each of those represents a molecule and shows the state/sample in which its concentration is highest. Thus, trajectories pointing to t0 show molecules that are consumed during fermentation, and those pointing to tf show molecules that are produced in the course of microbial or cell growth. Figure 6 shows production of organic acids along with some free amino acids and nucleobases (Figure 7).
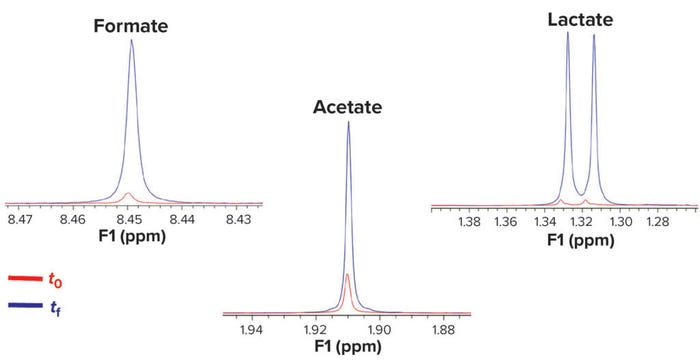
Figure 6: Kinetic study superimposes NMR spectra at initial (t0) and final (tf) fermentation times; production of organic acids (formic, acetic, and lactic) appear in this example.
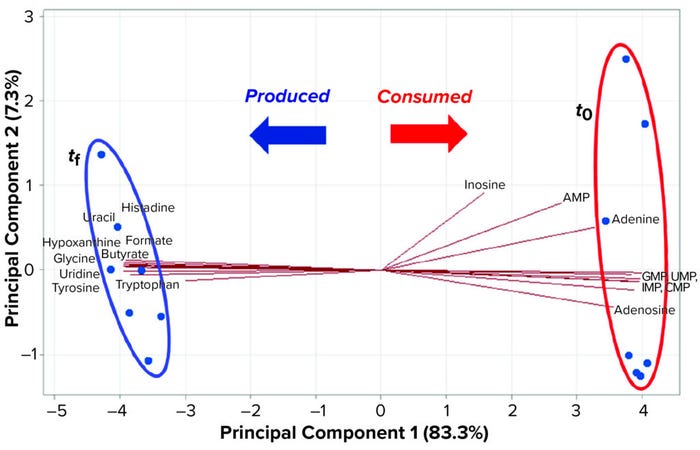
Figure 7: Biplot of a kinetic study using NMR-based metabolomics compares spent culture medium (tf) with medium before inoculation (t0) with the most differentiating metabolites selected. Through data analysis, upregulated and downregulated compounds can be singled out, and consumed and produced molecules can be identified easily.
Macromolecules such as peptides/proteins and polysaccharides give broad signals in NMR spectra (Figures 4, 5, and 7). Even though no information on their exact identity can be derived from the spectrum, their presence and approximate abundance in a sample can be detected based on the “bumps” they generate. For example, in yeast extracts/peptones, such bumps can be seen in the regions where signals of amino acids are located. Moreover, peptide consumption/degradation into free amino acids can be detected by comparing the heights of those bumps in between spectra.
LC-MS is a profiling technique that frequently is demonstrated to be of great value. The evolution of a culture medium from inoculation to the end of fermentation/culture can be monitored using this technique as well (Figure 8). Moreover, the end of a growth phase can be detected in the growth curve by the means of composition surveillance. When cultured in the test conditions, the specific microorganism reported in Figure 8 enters its stationary phase after eight hours of fermentation, as evidenced by a stagnant composition. The relative concentration change of each differentiating component can be monitored over time (Figure 9).
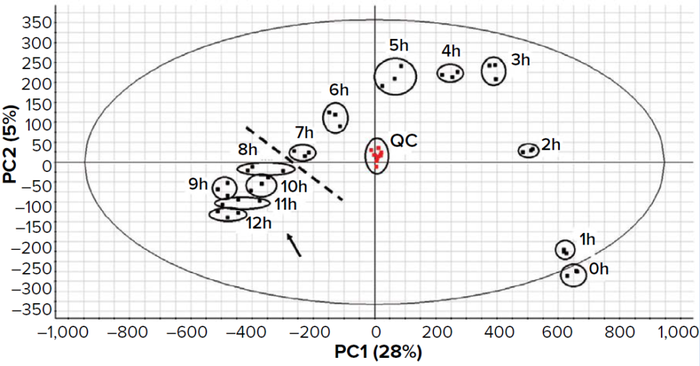
Figure 8: Principal component analysis of biological triplicate results from a kinetic study and culture-medium monitoring in a probiotic manufacturing process. The composition changes progressively across time points from the start of fermentation to the stationaryphase onset. QC = quality control (a pool of all analyzed samples at equal concentrations) injected several times through the series of analyses.
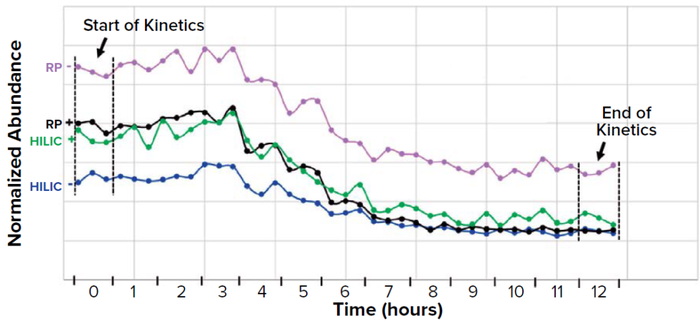
Figure 9: Relative concentration of a metabolite progresses during fermentation in four selected LC-MS conditions (+/– detection modes). Each three consecutive points represent biotriplicate samples taken at the same time.
RPreverse-phase column HILICHydrophilic interaction chromatography column
Another option is to compare tf and t0 directly using biplots or box plots (Figure 10a). A biplot of product levels implies pathways that are upregulated in one state or the other, allowing analysts to single out compounds that are either produced or consumed during the course of a culture. Through data analysis, upregulated and downregulated compounds can be singled out. In Figure 10a, adenosine and guanosine are consumed, whereas inosine is produced, in most of the tested media. Adenosine is deemed to be a limiting nutrient for the target microorganism because the spent culture medium (tf) is fully depleted of that molecule in every tested culture medium (Figure 10b).
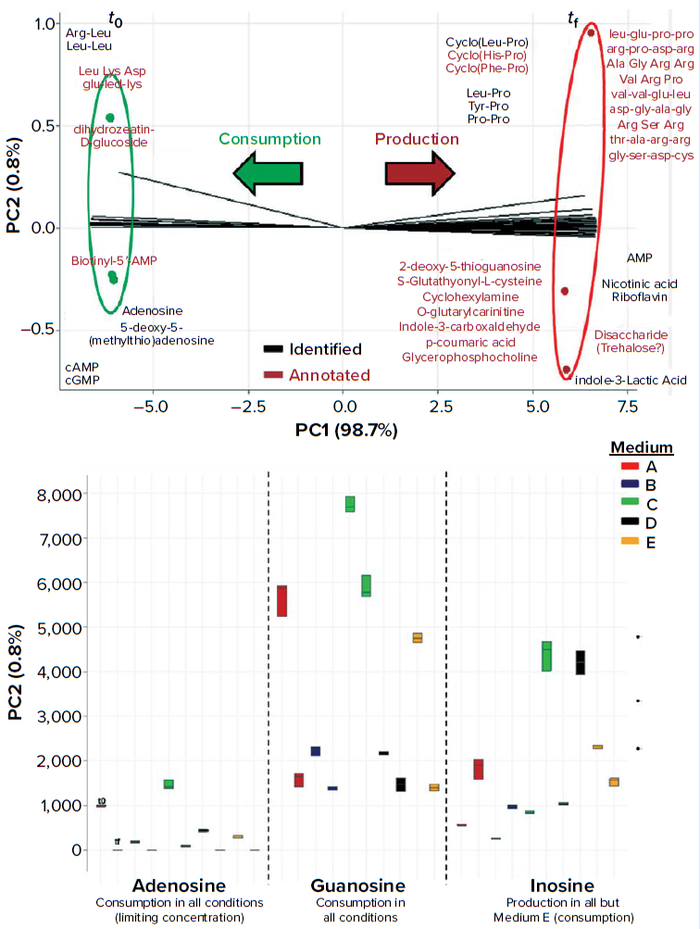
Figure 10: (a, top) Biplot of a fermentation kinetic study using LC-MS metabolomics; the most differentiating features were selected with an S-plot. After compound identification/ annotation, a principal component analysis (PCA) variable-projection graph was plotted to compare culture media composition before inoculation (t0) and after fermentation (tf). (b, bottom) Box plot shows relative abundance of purine nucleosides in different culture media at t0 and tf.
Other Uses for Results
Raw-material qualification is another application for metabolomics. Comparing proton NMR profiles of raw materials or different batches of the same culture medium can give insights on its compositional variability and thus indicate its suitability for a specific application (Figure 11). The presence and relative concentration of potential inhibitors also can be accessed with such profiling.
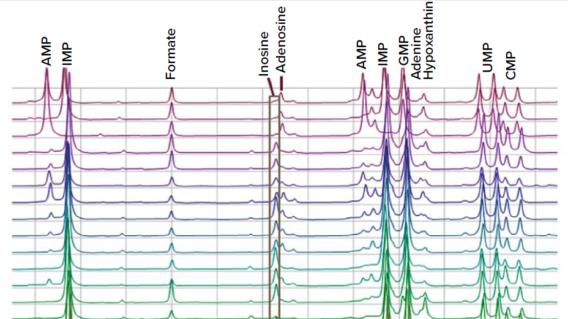
Figure 11: In comparing different raw materials with different iterations of yeast-based nutrients, variations can be detected easily. Only a portion of the proton NMR spectra is included here.
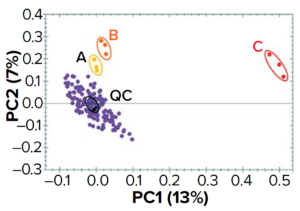
Figure 12: Comparing batches of a raw material (a yeast-based nutrient) with LC-MS metabolomics; samples were injected in triplicate. Three “atypical” batches (A, B, and C) stand out.QC = quality control (a pool of all samples at equal concentrations) injection at several points over the course of this series of analyses.
Culture-media batch comparison using LC-MS metabolomics can give helpful insights on interbatch variability. After chemometric analysis, you can build a principal component analysis (PCA) graph, its area representing the “composition space” for a given medium (Figure 12). The center of the PCA corresponds to the average composition of all samples analyzed and shows where the quality control (QC) sample is located. A cloud of points will surround the center of the PCA, corresponding to batches showing a “standard” composition. Note that three batches in Figure 12 are separate from that cloud and thus represent “atypical” compositions that could have affect bioprocess yields. By comparing the composition of “atypical” and “standard” (or “golden”) batches, analysts can hypothesize reasons for deviations that arise. Knowledge generated by such analyses can help raw-material producers as well as end users to mitigate process deviations.
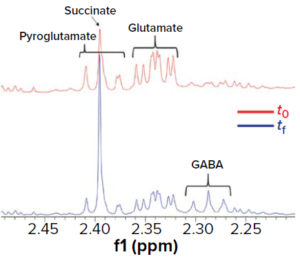
Figure 13: NMR fermentation kinetics show consumption of glutamic and pyroglutamic acids along with production of γ-aminobutyric acid (GABA) in comparing profiles of the culture medium before inoculation (t0) and after fermentation (tf).
An Example Application
To identify the influence of nutritional factors on growth of a model cell line, we monitored both a basic and a supplemented culture medium in small-scale incubations using 96-well microplates compared with a control. We studied newly formulated culture media to validate experimentally the capabilities of our GEM to simulate the influence of carbohydrates, including monosaccharides (mostly hexoses) and various nitrogen sources (mainly free amino acids and YBNs). Both the transport mechanism and the pathway of the breakdown for a given substrate determine the biomass yield, as predicted by the GEM. Finally, we could validate experimentally the in silico model predictions using batch fermentations. In agreement with model predictions, the model cell line grows on glucose preferably; no growth was recorded in the absence of a carbohydrate.
We observed that the initial glucose consumption led to production of such metabolites as formate, acetate, and lactate (Figure 6), probably through diffusion facilitated by glucose permease. Likewise, our culture media profiling shows a clear pattern of glutamate/pyroglutamate consumption and production of γ-aminobutyric acid (GABA) (Figure 13).
To identify the influence of vitamin on growth of a model strain as predicted by a specific GEM, we supplemented a generic culture medium with different essential B vitamins at three different dosages, either alone or in combination. The medium was formulated to provide for minimal growth under control conditions. Out of the seven tested vitamins, only B3 induced growth promotion when supplied as single component (Figure 14), as predicted in silico based on the multiple B-vitamin auxotrophies reported for that strain and according to published genome sequences annotated in the KEGG database.
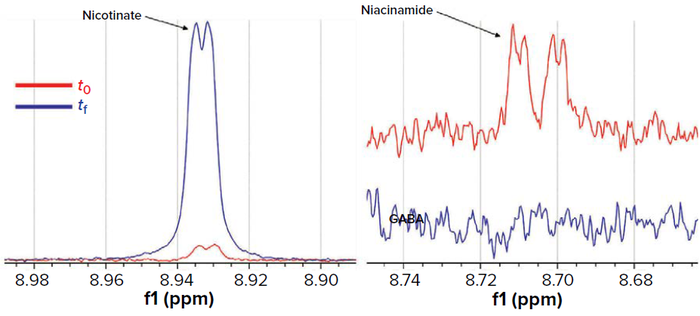
Figure 14: Production of nicotinic acid and consumption of niacinamide as evidenced in comparing 1H NMR profiles.
Nicotinic acid (nicotinate) and nicotinamide (niaciamide) are two forms of vitamin B3 that can serve as precursors for the biosynthesis of nicotinamide adenine dinucleotide phosphate (NADP+). The GEM predicted that the model strain could synthesize NADP+ from other sources, such as l-aspartate and fumarate, although it possesses all necessary genes for use of nicotinic acid or nicotinamide as precursors. In agreement with that prediction, the model strain grew only in generic media containing nicotinamide (Figure 14). The model also predicted that the strain has an absolute requirement for growth in nicotinic acid and an ability to use nicotinamide as an alternative NADP+ precursor. Our experimental results confirmed the absolute requirement for nicotinate that can be generated from niacinamide as predicted (Figure 14). Indeed, we confirmed presence of the gene for nicotinamidase using the KEGG database (EC 3.5.1.19).
Metabolism Matters
Metabolomics supports many functions in biotechnology. One key function is distinguishing autotrophies, prototrophies, essential or required nutrients, and valuable nutrients throughout the growth cycle of cells in culture. Media optimization often includes adding nonessential nutrients — e.g., lipids, peptides, and some tricarboxylic acid (TCA) cycle intermediates — that obviate certain energy-demanding pathways. Cells often use many nonessential nutrients, in the presence of which cultures tend to perform better. Cellular metabolic pathways are very dynamic, and relative levels of some nutrients will initiate both up- and down-regulation, which can alter the flux and use of other nutrients — even to switching between their generation or consumption by the culture.
Acknowledgments
We acknowledge contributions from Antoine Bessin, Emmanuel Poilpré, Alexandre Mery, and Aberrafek El Harras. We are also thankful to Pr. Diego Mora for valuable discussions.
References
1 Miehe R, et al. A Conceptual Framework for Biointelligent Production: Calling for Systemic Life Cycle Thinking in Cellular Units. Clean Technologies 3(4) 2021: 844–857; https://doi.org/10.3390/cleantechnol3040049.
2 Tripathi NK, Shrivastava A. Recent Developments in Bioprocessing of Recombinant Proteins: Expression Hosts and Process Development. Front. Bioeng. Biotechnol. 7, 2019: 420; https://doi.org/10.3389/fbioe.2019.00420.
3 Whitford W. Bioprocess Intensification: Aspirations and Achievement. BioTechniques 69, August 2020: 85–87; https://doi.org/10.2144/btn-2020-0072.
4 Whitford WG. Bioprocess Intensification: Technologies and Goals. Continuous Biomanufacturing: Process Control, Intensification and Digitalisation. Subramanian G, Ed.; in press.
5 Whitford W, Sourabié A, Varshney D. Enhancement of Cell-Based Vaccine Manufacturing Through Process Intensification. PDA J. Pharmaceut. Sci. Technol. 2021; https://doi.org/10.5731/pdajpst.2020.012583.
6 Narayanan H, et al. Bioprocessing in the Digital Age: The Role of Process Models. Biotechnol. J. 15(1) 2020: e1900172; https://doi.org/10.1002/biot.201900172.
7 Sargent B. Cell Culture Media Analysis in Upstream Biologics Development. Cell Culture Dish 18 October 2021; https://cellculturedish.com/cell-culture-media-analysis-upstream-biologics-development.
8 Proust L, et al. Insights Into the Complexity of Yeast Extract Peptides and Their Utilization By Streptococcus thermophilus. Front. Microbiol. 10, April 2019: 906; https://doi.org/10.3389/fmicb.2019.00906.
9 Proust L, et al. Multi-omics Approach Reveals How Yeast Extract Peptides Shape Streptococcus thermophilus Metabolism. Appl. Environ. Microbiol. 86(22) 2020: e01446-20; https://doi.org/10.1128/aem.01446-20.
10 Read EK, et al. Process Analytical Technology (PAT) for Biopharmaceutical Products: Part 1. Concepts and Applications. Biotechnol. Bioeng. 105(2) 2010: 276–284; https://doi.org/10.1002/bit.22528.
11 Rathore AS, Bhambure R, Ghare V. Process Analytical Technology (PAT) for Biopharmaceutical Products. Anal. Bioanal. Chem. 398(1) 2010: 137–154; https://doi.org/10.1007/s00216-010-3781-x.
12 Goldansaz SA, et al. Livestock Metabolomics and the Livestock Metabolome: A Systematic Review. PLoS ONE 12(5) 2017: e0177675; https://doi.org/10.1371/journal.pone.0177675.
13 Balthazar CF, et al. Nuclear Magnetic Resonance As an Analytical Tool for Monitoring the Quality and Authenticity of Dairy Foods. Trends Food Sci. Technol. 108, 2021: 84–91; https://doi.org/10.1016/j.tifs.2020.12.011.
14 Beć KB, Grabska J, Huck CW. Near-Infrared Spectroscopy in Bio-Applications. Molecules 25(12) 2020: 2948; https://doi.org/10.3390/molecules25122948.
15 Karahalil B. Overview of Systems Biology and Omics Technologies. Curr. Med. Chem. 23(37) 2016: 4221–4230; https://doi.org/10.2174/0929867323666160926150617.
16 Li B, et al. Development of a Non-Target Metabolomics-Based Screening Method for Elucidating Metabolic and Probiotic Potential of Bifidobacteria. Innov. Food Sci. Emerg. Technol. 77, 2022: 102971; https://doi.org/10.1016/j.ifset.2022.102971.
17 Marshall DD, Powers R. Beyond the Paradigm: Combining Mass Spectrometry and Nuclear Magnetic Resonance for Metabolomics. Prog. Nucl. Magn. Reson. Spectrosc. 100, 2017: 1–16; https://doi.org/10.1016/j.pnmrs.2017.01.001.
18 Sindelar M, Patti GJ. Chemical Discovery in the Era of Metabolomics. J. Am. Chem. Soc. 142, 2020: 9097−9105; https://doi.org/10.1021/jacs.9b13198.
19 Schöpping M, et al. Identifying the Essential Nutritional Requirements of the Probiotic Bacteria Bifidobacterium animalis and Bifidobacterium longum Through Genome-Scale Modeling. npj Syst. Biol. Appl. 7, 2021: 47; https://doi.org/10.1038/s41540-021-00207-4.
20 Henry CS, et al. High-Throughput Generation, Optimization and Analysis of Genome-Scale Metabolic Models. Nat. Biotechnol. 28, 2010: 977–982; https://doi.org/10.1038/nbt.1672.
21 King ZA, et al. BiGG Models: A Platform for Integrating, Standardizing and Sharing Genome-Scale Models. Nucleic Acids Res. 44(D1) 2016; D515–D522; https://doi.org/10.1093/nar/gkv1049.
22 Chen I-M A, et al. Improving Microbial Genome Annotations in an Integrated Database Context. PLoS One 12 February 2013; https://doi.org/10.1371/journal.pone.0054859.
23 Schellenberger J, et al. Quantitative Prediction of Cellular Metabolism with Constraint-Based Models: The COBRA Toolbox v2.0. Nat. Protoc. 6, 2011: 1290–1307; https://doi.org/10.1038/nprot.2011.308.
24 Sun Z, et al. High-Throughput LC-MS Quantitation of Cell Culture Metabolites. Biologicals 61, 2019: 44–51; https://doi.org/10.1016/j.biologicals.2019.07.003.
25 Bradley SA, et al. Fermentanomics: Monitoring Mammalian Cell Cultures with NMR Spectroscopy. J. Am. Chem. Soc. 132(28) 2010: 9531–9533.
26 Larive CK, Barding GA, Dinges MM. NMR Spectroscopy for Metabolomics and Metabolic Profiling. Anal. Chem. 87, 2015: 133−146; https://doi.org/10.1021/ac504075g.
27 Puig-Castellví F, et al. 1H NMR Metabolomic Study of Auxotrophic Starvation in Yeast Using Multivariate Curve Resolution-Alternating Least Squares for Pathway Analysis. Sci. Rep. 6, 2016: 30982; https://doi.org/10.1038/srep30982.
28 Mohmad-Saberi SE, et al. Metabolomics Profiling of Extracellular Metabolites in CHO-K1 Cells Cultured in Different Types of Growth Media. Cytotechnology 65(4) 2013: 577–586; https://doi.org/10.1007%2Fs10616-012-9508-4.
29 Fenhui S, et al. Optimization of the Nutritional Constituents for Ergosterol Peroxide Production By Paecilomyces cicadae Based on the Uniform Design and Mathematical Model. Sci. Rep. 12, 2022: 5853; https://doi.org/10.1038/s41598-022-09773-x.
30 Wishart DS. Quantitative Metabolomics Using NMR. Trends Anal. Chem. 27(3) 2008: 228–237; https://doi.org/10.1016/j.trac.2007.12.001.
Cecilia Socolsky, PhD, is head of discovery analytics in metabolomics and natural products discovery, and Alain M. Sourabié, PhD, is director of science technology and innovation at Lesaffre Group in Paris, France. A member of the BPI editorial advisory board, corresponding author William G. Whitford is the life-science strategic solutions leader for DPS Group; 1-435-757-1022; [email protected]; https://www.dpsgroupglobal.com.
Figures 8–14 appear only in the online-archived version of this article at https://bioprocessintl.com/category/october-2022. There, too, you will find a more detailed discussion of the “cellular agriculture” concept and how it incorporates precision fermentation strategies.
You May Also Like

