DoE Helps Optimize a Cell Culture Bioproduction SystemDoE Helps Optimize a Cell Culture Bioproduction System
October 1, 2009
Typical serum-free culture media used in bioprocessing can have 60–90 components at differing concentrations to feed a single cell line. Media used to grow different cell lines for bioprocessing applications may each require unique optimal chemical formulations. Adding complexity, optimal process conditions such as pH and stirring rate may also differ from cell line to cell line depending on the unique characteristics of process performance.
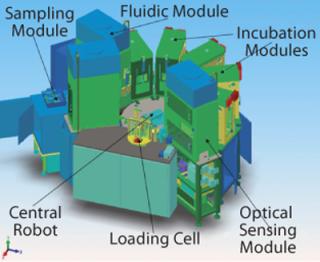
To tackle all those variables, we at Invitrogen Corporation of Carlsbad, CA (www.invitrogen.com/pddirect) use design-of-experiments (DoE) statistical methods, which reveal the complicated array of multifactor interactions involved in bioprocess development. Some experiments conducted include the use of high-throughput tools such as a robotically controlled microbioreactor system capable of conducting hundreds of simultaneous bioreactor experiments (Figure 1.

Figure 1: ()
We know that a sound DoE strategy combined with the right tools can be used to identify truly optimal formulations and operating conditions to maximize product output. DoE greatly reduces the number of experiments and thus the time needed to optimize many variables. Some of our methods present results in the form of a response surface map, which makes it possible for researchers to quickly zero in on the optimal value of each factor. DoE also provides valuable understanding of the design space: the possible operating intervals of all factors during a final application. Such information, which could not be easily obtained before DoE, will help our process developers establish threshold levels for robust manufacturing.
The Challenge of Animal-Origin–Free Media
Most biotechnology companies are moving away from media containing undefined components, such as bovine serum and plant hydrolysates. They prefer media without those for three major reasons. First, sera and other components of animal origin have the potential to contaminate a final product with adventitious agents such as viruses and prions. Second, plant hydrolysates in media sometimes contribute to high lot-to-lot variation in protein production. And third, animal-sourced components can introduce other contaminants that need to be eliminated during protein purification.
Although some suppliers of plant hydrolysates have been taking steps to improve their manufacturing processes and reduce lot-to-lot variability, Invitrogen has chosen to develop a portfolio of cell culture products that is completely free of serum, hydrolysates, and animal-origin materials. This portfolio has been attained by balancing the concentrations of other medium components and by substituting plant, microbial, or synthetic chemicals for animal-derived raw materials. To ensure that bioreactors operate at maximum efficiency and consistency, it is often necessary to optimize a culture medium to the nutritional requirements of a particular cell line — hence the need for statistically designed experiments.
The traditional approach to optimizing media and operating conditions involves running one-factor-at-a-time (OFAT) experiments. The concentration of a component (or the value of a processing condition) is varied while all other components and conditions are held constant. One problem with this approach is that there are too many factors to optimize a medium fully for a particular cell line. Running batch or fed-batch experiments might tie up a 5-L research bioreactor for two weeks. If each of 10 factors were tested sequentially, that could require several months! Another problem is that the OFAT approach does not account for interactions among components and conditions. Even if all OFAT experiments were completed, the combined results would miss optimal performance.
Enabling New Methodology
Invitrogen’s PD-Direct service applies DoE methods to both reduce the number of runs required and increase the experimental space evaluated. These methods account for multiple variables and their interactions by testing all factors simultaneously in balanced statistical designs.
To reduce the number of runs required, we use instruments such as the SimCell high-throughput cell-culture system from BioProcessors (now Seahorse Biosciences) of North Billerica, MA (www.seahorsebio.com). It allows us to grow animal cell cultures in microbioreactor chambers with ∼700 µL working volume. Each microbioreactor array (MBA) has six chambers in the same footprint as a standard 96-well plate. As MBAs rotate around a spindle inside an incubator, an air bubble within each chamber traverses the perimeter to provide continual stirring of the suspended cell culture. On-line measurements of cell density (optical refraction), pH, and dissolved oxygen enable daily monitoring. The pH within each chamber is controlled to a set point by automatic addition of a basic solution when the pH reading dips below a programmed threshold. Gas concentrations (CO2 and O2), temperature, and rotation speed within each incubator are also adjustable. Various feed solutions can be programmed for introduction into the chambers during specific run cycles. Chamber suspensions can also be sampled into 96-well plates throughout a run to enable off-line measurements of such parameters as viability and protein production.
The type of experiments we need for optimizing media are complex and would be impractical to design and analyze manually. Fortunately, software is available that greatly reduces the time required for experimental design and results analysis. We use Design-Expert software from Stat-Ease, Inc. of Minneapolis, MN (www.statease.com), because it offers a choice of experimental designs and provides an intuitive user interface. PD-Direct researchers often use fractional factorials and minimum-run designs to identify key effects and interactions. Sometimes we augment those to central composite designs (CCDs), which enable response surface maps that help us more fully understand our results.Table 1: Factor level definitions for central composite design (CCD) experiment

Table 1: Factor level definitions for central composite design (CCD) experiment ()
For example, if the response continues to rise at one edge of our design space, the optimum probably lies outside the tested range of factors. A steep curve around the optimum indicates that the response is very sensitive to one or more factors. On the other hand, a flat surface or shallow curvature near the optimum indicates that the response is more robust and less likely to be affected by changes in those particular factors.
Central Composite Design Experiment
We recently performed a designed experiment that confirms the ability of the microbioreactor and DoE to optimize complex cell-culture media. We used a fractional CCD with eight factors at five levels (Figure 2) provided by the software and requiring 192 runs. A full five-level factorial experiment would have required 390,625 runs. We ran 192 microbioreactor experiments in parallel over a total of eight days. I then entered the results into the software, which provided a complete statistical analysis.

Figure 2: ()
Table 2: Selected outcomes for
Figure 4

Table 2: Selected outcomes for Figure 4 ()
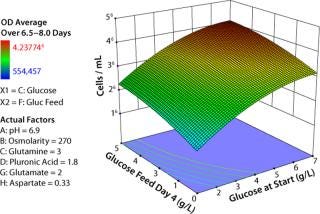
The response surface map in Figure 3 confirms our understanding developed over years of OFAT experiments regarding how glucose enables growth. The vertical axis depicts model-generated average cell densities at late-phase growth (days 6–8). The axis moving off the origin to the right represents increasing amounts of glucose in the initial media, and the axis moving off to the left represents increasing amounts of glucose added to the bioreactor at day 4 of incubation.

Figure 3: ()
The response surface is lowest when glucose both at start and fed are minimal and highest when both are maximal. The surface curvature illustrates that predicted cell density is much less sensitive to changes in glucose near the highest tested concentrations than near the minimum concentrations. These results align with what we expected, which reinforced our confidence in the equipment and our experimental design.
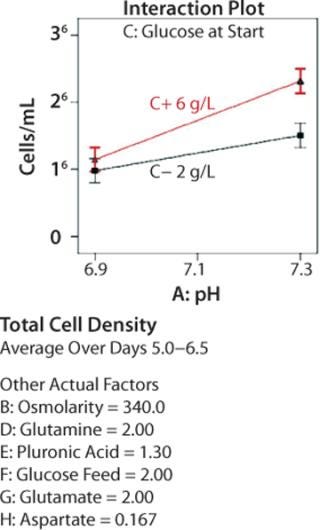
We generated additional statistical output to investigate interactions between two factors. Figure 4 depicts the effects of pH on average total cell density in mid-to-late log-phase growth (days 5–6.5) for cultures begun with different initial glucose concentrations. When the initial concentration was low, changing pH had very little effect on cell growth. When initial glucose was high, cultures at pH 7.3 grew to considerably higher densities than those at pH 6.9. The error bars represent ±0.5 least significant difference (LSD) at α = 0.05 (95% confidence); nonoverlapping bars indicate a significant difference between means. The ability to understand these types of multivariable interactions — not visible in OFAT experiments — is a key advantage of using DoE.

Figure 4: ()
Optimizing Cell Density and Productivity
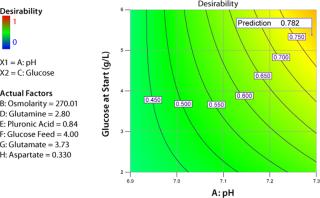
Figure 5 shows another way of looking at the results of an experiment. I defined a desirability function that includes cell densities in mid-late and late growth phases of the experiment and production of tissue plasminogen activator (tPA). The computational weights associated with three parameter inputs are 3, 3 and 5, respectively. The range of each factor was limited to the core region of the CCD. Based on experimental results, the software identified a set of optimal values for each factor (left side of Figure 5), resulting in a desirability value of 0.819 on a scale of 0 to 1.
This experiment demonstrates how a robotically controlled microbioreactor system can be combined with DoE methods to optimize cell-culture media and feeding strategies. The new process is rich in information and provides a solid understanding of the most influential factors affecting performance of specific cell lines. As companies integrate these techniques into their media design and manufacturing processes, they can develop media and feeds that greatly enhance bioreactor performance.
For Further Reading
Optimizing Design of Experiments for Fluid Bed Coating. pharma QbD September 2008; www.pharmaqbd.com/?q=node/115.
Fireman J. Build a More Efficient Tablet Press Process: How One Company Solved a Problem with Tablets Sticking. Pharmaceut. Formulation Quality Feb/March 2009: 45–47.
Find several more articles on design of experiments on the Stat-Ease website: www.statease.com/articles.html.
You May Also Like


