Host-Cell Protein Analysis to Support Downstream Process Development: A High-Throughput Platform with Automated Sample PreparationHost-Cell Protein Analysis to Support Downstream Process Development: A High-Throughput Platform with Automated Sample Preparation
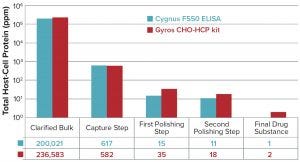
Figure 1: Comparing the Gyros Chinese hamster ovary host-cell protein (CHO HCP) kit with the CYGNUS F550 enzyme-linked immunosorbent assay (ELISA) kit for case 1
In the past few years, increasing numbers of biotherapeutics have been approved for market (1). Among all the regulatory concerns for commercial biotherapeutics, host-cell proteins (HCPs) are a major class of process-related impurities that remains a critical quality attribute (CQA) for bioprocess development because of associated risks to product quality, safety, and efficacy. HCP identification, clearance, assay setup, and process control are critical points for health authorities, and many guidelines aim for better control of HCP content in final biologic products (2–5). Through BioPhorum, the biotechnology industry has released a guideline and a risk assessment tool (6, 7) that covers management of HCPs during bioprocess development.
Several recently published studies have illustrated the diversity of HCPs and related issues with final products. For example, patient immune responses to phospholipase B-like 2 (PLBL2) have been reported during lebrikizumab clinical trials (8), necessitating a late process change. Similarly, MCP-1 HCP has been detected in several projects (9), requiring one clinical trial to be put on hold because of severe adverse effects. And many potentially immunogenic HCPs have been identified and reported (10, 11). Others such as cathepsin D and L can induce product degradation in final biologic products (12, 13).
As a first mitigation effort for overcoming — or even better, preventing — such pitfalls, the strategy is to minimize HCP content in a process stream during early manufacturing steps. Based on increasing design of experiments (DoE) performed for downstream development, improved HCP clearance can be reached by selecting efficient conditions for each process step, a goal realized through deeper process understanding.
Therefore, automation of analytical technology is necessary to manage increasing numbers of samples without timeline delay or loss of quality compared with the gold-standard approach such as enzyme-linked immunosorbent assays (ELISAs). The Gyrolab xP platform (Gyros Protein Technologies AB) has demonstrated performance and robustness as a reliable tool for high-throughput immunoassay analysis. Gyros technology is used widely as a high-throughput tool for toxicology and pharmacokinetics in preclinical and clinical studies (14–16), even in regulated environments. Such technology also has been described for detection of HCPs (17), and it is used as an efficient approach to delivering analytical results according to the needs of downstream process (DSP) laboratories (18, 19).
At Sanofi, we have benefited from the great potential of this equipment and expanded its use for high-throughput analysis of residual HCPs across our bioprocess analytics laboratories for many years. However, we face two major challenges in using this tool. First, a bottleneck shift has been observed: The Gyrolab xP platform enables analysis of many samples in a single assay, providing rapid access to the results, but it dramatically increases sample-preparation workloads. Second, it is necessary to prevent bias between the high-throughput method and that used for batch release.
Some teams have automated ELISAs to solve those problems (20, 21). And Gyrolab sample preparation has been automated for pharmacokinetics (PK) purposes (22). We combined automated sample preparation with the analytical potential of our Gyrolab xP workstation to answer the throughput challenge. The Gyros technology presents a number of advantages that supported our choice: such as the requirement for low-volume reagents and samples, fewer matrix effects (with a dynamic microfludic approach than with static, plate-based technologies), and a highly competitive dynamic range.
Here, we present the implementation of a Gyrolab xP immunoassay system as an analytical platform for high-throughput HCP analysis, illustrating its comparability with our gold-standard ELISA method. Additionally, we applied the Bravo automated liquid-handling platform (Agilent Technologies) to increase sample-preparation throughput and quality while reducing workload and sample-dilution errors. Below, we demonstrate the performance of this platform through the comparison of results generated across three Sanofi biologics development sites.
Materials and Methods
Cases 1–10: All projects are internal Sanofi products expressed from Chinese hamster ovary (CHO) cell lines — monoclonal antibodies (MAbs) and fragments.
ELISA: We used a third-generation CHO-HCP ELISA kit supplied by Cygnus Technologies (catalog #F550) as the reference ELISA for this study. This assay was carried out following an instruction protocol provided by the supplier and using the CHO-HCP standard provided in the kit. For the washing steps, we used a BioTek ELx50 plate washer. Optical densities (ODs) were read at 450 nm on a Molecular Devices M5e spectrophotometer. We determined the standard curves and concentrations of unknown samples with SoftmaxPro software using a four-parameter logistic curve.
In-House Gyrolab CHO-HCP Assay: Polyclonal anti-CHO-HCP antibodies used as both capture and detection reagents came from Cygnus Technologies (goat anti-CHO 3G HCP affinity-purified catalog #CYG-3G-0016-AF and biotinylated affinity-purified goat anti-CHO 3G HCP catalog #3G-0016-AFB). Biotin labeling of the capture reagent was achieved with EZ-Link Sulfo-NHS-LC-Biotin and labeling kits from Thermo Fisher Scientific (catalog #21935) following supplier protocols. For alexafluor labeling of the detection reagent, we used an Invitrogen Alexa Fluor 647 antibody labeling kit from Thermo Fisher Scientific (catalog #A20186) and followed the supplier’s protocol. We used Rexxip A, A-max, and F from Gyros Protein Technologies as sample and reagent diluents, respectively (catalog #P0004820 and #P0004825). Finally, Gyros Protein Technologies provided Gyrolab Bioaffy 1000 compact disks (catalog #P0004253).
Gyrolab CHO-HCP Kit Number 1: We used a Gyrolab CHO-HCP kit #1 (catalog #P0020246) from Gyros Protein Technologies and followed the supplier protocol for running it on the Gyrolab xP workstation. The workstation is controlled and data are collected using Gyrolab Evaluator software, version 3.4.0.24.
Gyrolab CHO-HCP 3G Kit: We used a Gyrolab CHO-HCP 3G kit (catalog #P0020605) from Gyros Protein Technologies and followed the supplier’s protocol for running it on the Gyrolab xP workstation, again controlled and with data collection by Gyrolab Evaluator software.
Dilution was automated by a Bravo automated liquid-handling system from Agilent Technologies with a 96 LT head. We use V-Work software, version 12.3.0, for its control and programming.
Development and Validation of the HCP Assay
Comparing an In-House Gyrolab CHO-HCP Assay with a Gyrolab CHO-HCP Kit: As a well-known and robust analytical method, ELISAs are the gold-standard approach to monitoring HCP clearance from bioprocess development steps to quality control (QC).
However, the traditional plate-based ELISA method does not work as an efficient analytical support to meet the growing throughput required by DSP development teams. Classical CHO-HCP plate-based ELISAs require significant hands-on preparation and analysis time, with multiple incubation and washing steps, which gives them limited sample throughput. Moreover, the ELISA’s narrow dynamic range (±100 ng/mL) necessitates a considerable number of retest analyses, especially during process development studies. Even if automation could provide a throughput improvement, the narrow dynamic range of the assay remains a major limitation.
In that context, we explored the Gyros technology as a means of increasing throughput and reducing retest needs with its significantly wider dynamic range of ±10,000 ng/mL. The Gyrolab xP workstation is a microfluidic affinity platform that performs disk-based sandwich immunoassays at nanoliter scale. A compact disk (CD) support is divided into 12 segments, each containing eight microstructured affinity columns coated with streptavidin beads. Biotin–streptavidin affinity allows construction of a sandwich immunoassay using a biotin-labeled capture reagent and a fluorescently labeled detection reagent. Laser-induced fluorescence recorded from each column allows for determination of analyte concentration by back-calculation from a five-parameter standard curve.
The first approach we evaluated was an in-house Gyrolab CHO-HCP assay on Bioaffy 1000 CDs with a classical sandwich assay format. We used polyclonal goat anti-CHO-HCP antibodies for both capture and detection. We also used three different labeling approaches, comparing home-made labeling with Gyros labeling and commercially available labeled reagents. We tested different combinations of capture and detection reagents, and test results illustrated an important effect of labeling quality on assay sensitivity. Our in-house approach did not provide sufficient sensitivity for samples with low-HCP content and showed insufficient correlation with manual ELISA results because of that lack of sensitivity (no data shown). Furthermore, the reached limit of quantitation (LoQ) of ~16ng/mL was unsatisfactory compared with that of the ELISA assay (~3 ng/mL).
Our second test evaluated a Gyrolab CHO-HCP kit 1 (“No. 1”). It is based on the same assay format as the in-house method and contains ready-to-use capture and detection reagents. The anti-CHO-HCP antibodies come from the same supplier as those used in the in-house assay. However, the CD supports included in the kit are Bioaffy 1000 high-capacity CDs, which use porous (rather than nonporous) streptavidin beads. Using this turn-key kit eliminates the labeling issues above and improves assay robustness, with considerable savings in development time.
The first test of the No. 1 kit provided satisfactory sensitivity, with a LoQ at 3.2 ng/mL that remained consistent throughout our evaluation. Consequently, sufficient sensitivity was reached for samples with low HCP content, and this approach correlated well with ELISA reference results (Figure 1).
Because of the rapid gain in assay sensitivity and robustness, and to ensure batch-to-batch consistency among kits, we chose to implement that second approach . We decided not to pursue detection-reagent labeling improvements of the in-house assay method, but rather, to continue with implementation of the No. 1 kit for high-throughput HCP quantification in our process development studies.

Qualification of Gyrolab CHO-HCP Kit
Next we qualified the No. 1 kit to ensure the method’s suitability for its intended use. Our qualification protocol was the same as that for a CHO-HCP ELISA, with comparably fixed acceptance criteria. Our initial qualification with one MAb project (Figure 1) was based on well-established product/process knowledge and sample availability. We qualified the analytical method in terms of model suitability, specificity, accuracy, linearity of dilution, LoQ, limit of detection (LoD), repeatability (intraassay precision), and intermediate precision (interassay precision). As listed in Table 1, all acceptance criteria defined in the qualification protocol were fulfilled.
Comparison with Gold-Standard ELISA: To compare the high-throughput HCP analysis using the Gyrolab system with the gold-standard CHO-HCP ELISA, we evaluated them side by side for several projects.
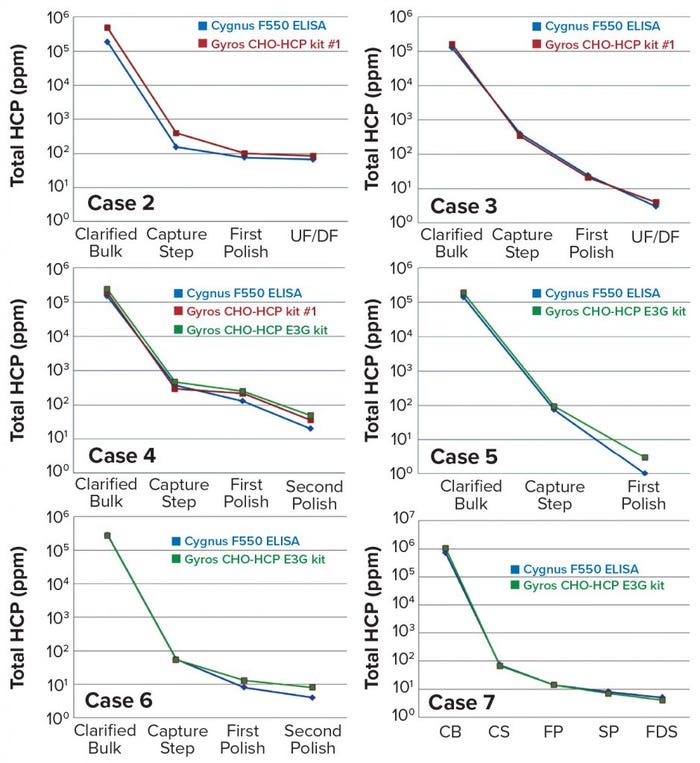
Figure 2: Comparing the Gyros CHO-HCP kit with CYGNUS F550 ELISA kit results for cases 2–7
The Gyrolab CHO-HCP kit we started with (No. 1) uses antibodies from Cygnus Technologies and covers a broad spectrum of HCPs. When the Gyrolab CHO-HCP E3G kit was launched, we preferred it to the No. 1 kit. The newer kit includes exactly the same antibody reagents as Cygnus Technologies’ 3G CHO-HCP F550 ELISA kit that corresponds to our reference ELISA method. Results obtained with both kits (Figure 2) show very good correlation between the Gyros and classic ELISA results both for clearance and total HCP quantification. The six benchmark cases presented represent the diversity of molecules developed within our group (antibodies, fragments, and multispecifics). They enable us to provide full high-throughput support for early DSP development for such projects with reductions in bench time, cost, and retesting, while increasing our analytical turnover.
For process 1 of Case 5 (Figure 3), however, the Gyros assay unexpectedly overestimated by threefold compared with the traditional ELISA from the capture step to the final product. Dilution linearity issues arose for both methods, with the Gyros assay showing a wider linearity range. Using both approaches, we addressed linearity issues following USP <1132> recommendations. Even though clearance was observed in both cases, we had to investigate the overestimation. HCP profiling of process samples showed the abundant presence of a copurifying HCP from the capture step to the final product. So we developed the process further to reduce the amount of the copurifying protein at the capture step and eliminate it with the first polishing step. A new bridging study then showed significantly better linearity of dilution and correlation between the two assays (case 5, process 2).
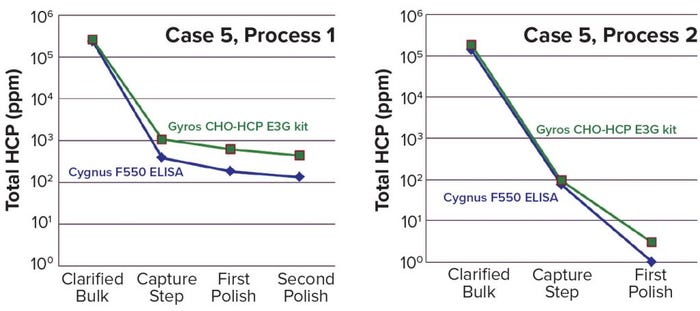
Figure 3: Process impact on comparison between Gyros and ELISA methods in Case 5
That led us to conclude that the large amount of copurified protein could have been the reason for the Gyrolab method’s overestimation. Even though we have not demonstrated it formally yet, we did observe the same behavior in a previous project with the presence of another copurifying HCP. So the observed difference seems to be linked to the preponderance of a specific HCP. Even in Case 5, the Gyros assay provided an efficient high-throughput analytical support for process development studies, with the same clearance obtained by both methods even as the high-throughput technology systematically overestimated HCP content.
Cross-Site Evaluation
Finding Gyrolab technology to be an efficient and robust tool, we selected it as a global harmonized platform to support process development across all of Sanofi’s biologics development locations. That facilitates project and knowledge transfer from one site to another. For this implementation, samples were shared among three development sites and analyzed using a harmonized procedure.
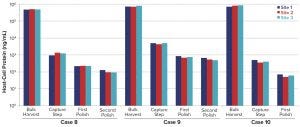
Figure 4: HCP cross-site testing using a Gyrolab platform
Figure 4 shows results from the cross-site study expressed in ng/mL. Those data confirm highly comparable results among Sanofi sites for all tested projects and related process steps. This robust method allows us to detect even small changes among subsequent process steps.
High-Throughput Automation Approach
The Gyrolab system has demonstrated benefits and presents good comparability with the gold-standard ELISA method. The new assay offers excellent dynamic range, linearity, repeatability, and precision. In addition, the 5CD Gyrolab platform can run a sequence of 480 analyses. Such throughput gives us a major advantage, allowing for one sample to run at several dilutions for testing linearity, recovery, and matrix effects by spike addition. However, such an approach greatly increases the necessary manual sample-preparation effort and brings a high risk of dilution and sample-mixing errors.
For example, a DSP DoE of 60 samples led to 360 different dilutions (each sample tested at three dilutions with spiking). Automation is needed to handle that many samples, allowing us to increase throughput, quality, and reproducibility of results while gaining time and decreasing dilution mistakes and retesting. To achieve that, we used a Bravo automated liquid-handling platform from Agilent Technologies. With 96 disposable tips, this robot is very efficient to work with. You can use either the full head or part of it (in rows or columns) as needed.
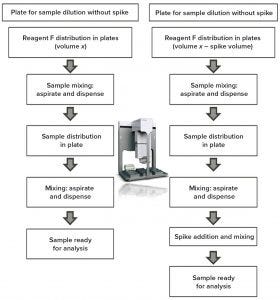
Figure 5: Automation approach
Figure 5 presents our automation strategy. A sample is diluted for analysis and again diluted to check spike recovery. First, reagent F (Gyrolab sample diluent) is dispatched in daughter plates at different volumes for selected dilutions and spike additions. Then, to ensure a sufficient homogeneity, samples are mixed by the robot tips. A new set of tips is used for sample dilution, with different volumes for the selected dilutions.
The most critical step in this assay development appears to be mixing of samples with reagent F to obtain good comparability with the manual assay as well as good reproducibility. Liquid class and the number and speed of aspirates and dispense cycles are the main parameters to screen for developing a robust assay.
After this critical step, a sample is ready to be analyzed or ready to be spiked for analysis. The resulting automated process allows us to prepare 90 samples in 10 minutes for a given dilution. A set of samples can be prepared quickly even if several dilutions are required.
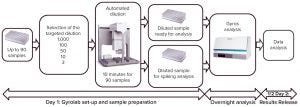
Figure 6: High-throughput analytical workflow for HCP analysis
As Figure 6 shows, this automation workflow allows us to perform an assay and release results in just a day and a half. On the first day, we set up the equipment and dilute samples using the automated Bravo protocol. The Gyrolab assay can run by the end of the day, with results available the next morning for data treatment in a Microsoft Excel–based template. This automated approach and organization enables us to provide efficient support to the DSP development laboratories: We can offer rapid analytical turnover (results released on day +1), good throughput (up to 90 samples per run, with two dilutions and spiking), and high confidence in the results by analyzing several dilutions and spikes in the same run. This automated approach improves our internal efficiency in the analytical department and eradicates the need for retesting due to dilution mistakes It also improves analysis quality and greatly reduces hands-on time from that required for manual sample preparation.
The final question raised by this automation strategy concerns comparability. To ensure data consistency and prevent a gap during the switch in routine analysis from manual to automated sample preparation, we performed a statistical equivalence study to compare both approaches. Two critical parameters were considered: the intermediate-precision coefficient of variance (CV) and bias between the two approaches. For this study, three operators generated analyses over four independent days using both manual and automated sample preparation of four dilution levels. For each series, three independent preparations of each dilution were performed and analyzed in triplicate. With a large amount of data generated, we were able to reach a clear conclusion as presented in Table 2.
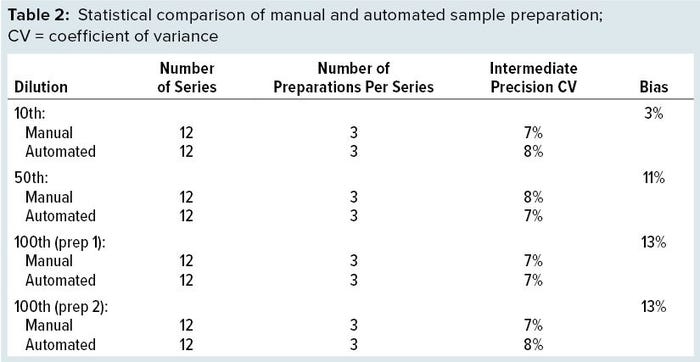 CV results were unexpected, showing strong similarity between manual and automated sample preparation. With more samples to deal with in a real experiment, the robot would remain consistent whereas human skills could become a limitation. Bias was found to be acceptable for an immunoassay. With 25% as the upper limit, we achieved results much lower than that. Those results gave us a green light to switch from manual sample preparation to the Bravo-automated method. They also helped us choose between different dilution strategies on the robot. A 100 dilution is possible with a single dilution (preparation 1) or a two-step dilution (preparation 2) such as done manually, with results showing no difference between them. So we implemented the single dilution to gain time and save on consumables.
Discussion and Conclusion
The Gyrolab platform has been used intensively in our laboratories for many years. It has become an efficient tool for high-throughput HCP analysis as a robust and reliable system that offers results comparable with those from an ELISA approach. This platform aids us in providing DSP support. However, the Gyros instrument alone cannot solve high-throughput needs. Increasing numbers of samples shift the laboratory bottleneck to sample preparation and data treatment. As presented herein, we now manage sample preparation using a robotic liquid-handling system (the Agilent Bravo robot) with a homemade protocol. That has allowed us to eliminate all manual sample preparation for HCP analysis.
The resulting automated approach has brought a major increase in throughput, quality, and repeatability of analytical results while greatly decreasing hands-on time and sample retest requirements. Our next steps and challenges will be to focus on data analysis. We had found the Gyrolab software to be inefficient for that, so a strong spreadsheet-based system has been developed internally. But new solutions will need to be explored, including the latest version of the Gyrolab Evaluator program.
Acknowledgments
We sincerely acknowledge Emilie Lespinasse for manuscript review.
References
1 Grilo AL, et al. The Increasingly Human and Profitable Monoclonal Antibody Market. Trends Biotechnol. 37(1) 2019: 9–16; doi:10.1016/j.tibtech.2018.05.014.
2 <1132> Residual Host Cell Protein Measurement in Biopharmaceuticals. US Pharmacopeia 39, 2016.
3 2.6.34 Host-Cell Protein Assays. European Pharmacopoeia 9, 2017.
4 ICH Q6B. Specifications: Test Procedures and Acceptance Criteria for Biotechnological/Biological Products. US Fed. Reg. 64, 1999: 44928; https://database.ich.org/sites/default/files/Q6B_Guideline.pdf.
5 ICH Q11. Development and Manufacture of Drug Substances (Chemical Entities and Biotechnological/Biological Entities). US Fed. Reg. 77(224) 2012: 69634–69635; https://database.ich.org/sites/default/files/Q11_Guideline.pdf.
6 Wang F, et al. Host-Cell Protein Risk Management and Control During Bioprocess Development: A Consolidated Biotech Industry Review, Part 1. BioProcess Int. 16(5) 2018: 18–25; https://bioprocessintl.com/business/risk-management/host-cell-protein-risk-management-and-control-during-bioprocess-development-a-consolidated-biotech-industry-review-part-1.
7 Wang F, et al. Host-Cell Protein Risk Management and Control During Bioprocess Development: A Consolidated Biotech Industry Review, Part 2. BioProcess Int. 16(6) 2018: 42–47; https://bioprocessintl.com/business/risk-management/host-cell-protein-risk-management-and-control-during-bioprocess-development-a-consolidated-biotech-industry-review-part-2.
8 Fischer SK, et al. Specific Immune Response to Phospholipase B-Like 2 Protein, a Host Cell Impurity in Lebrikizumab Clinical Material. AAPS J. 19(1) 2017: 254–263; doi:10.1208/s12248-016-9998-7.
9 Vanderlaan M, et al. Experience with Host Cell Protein Impurities in Biopharmaceuticals. Biotechnol. Prog. 34(4) 2018: 828–837; doi:10.1002/btpr.2640.
10 Bailey-Kellogg C, et al. CHOPPI: A Web Tool for the Analysis of Immunogenicity Risk from Host Cell Proteins in CHO-Based Protein Production. Biotechnol. Bioeng. 111(11) 2014: 2170–2182; doi:10.1002/bit.25286.
11 Gilgunn S, et al. Challenges to Industrial MAb Bioprocessing: Removal of Host Cell Proteins in CHO Cell Bioprocesses. Curr. Opin. Chem. Eng. 22, 2018: 98–106; doi:10.1016/j.coche.2018.08.001.
12 Bee JS, et al. Trace Levels of the CHO Host Cell Protease Cathepsin D Caused Particle Formation in a Monoclonal Antibody Product. Biotechnol. Prog. 31(5) 2015: 1360–1369; doi:10.1002/btpr.2150.
13 Luo H, et al. Cathepsin L Causes Proteolytic Cleavage of CHO Expressed Proteins During Processing and Storage: Identification, Characterization, and Mitigation. Biotechnol. Prog. 35(1) 2018: e2732; doi:10.1002/btpr.2732.
14 Liu R, et al. Accelerating Regulated Bioanalysis for Biotherapeutics: Case Examples Using a Microfluidic Ligand Binding Assay Platform. AAPS J. 19(1) 2017; 82–91; doi:10.1208/s12248-016-0006-z.
15 Noguchi Y, et al. Pharmacokinetics of an Intracerebroventricularly Administered Antibody in Rats. MAbs 9(7) 2017: 1210–1215; doi:10.1080/19420862.2017.1345834.
16 Jordan G, et al. Platform Switching from ELISA to Gyrolab™: A Novel Generic Reagent Omits the Need to Change Critical Reagents. Bioanalysis 8(8) 2016: 807–814; doi:10.4155/bio-2015-0011.
17 Zimmermann E, et al. High-Throughput Methods Evaluation Impurities Determination During Upstream and Downstream In-Process Development. BioProcess Int. 14(2) 2016: 24–32; https://bioprocessintl.com/wp-content/uploads/2016/02/14-02_Zimmerman.pdf.
18 Welsh JP, et al. Domain Antibody Downstream Process Optimization: High-Throughput Strategy and Analytical Methods. Eng. Life Sci. 16, 2016: 133–142; doi:10.1002/elsc.201400255.
19 Ichihara T, et al. Integrated Flow-Through Purification for Therapeutic Monoclonal Antibodies Processing. MAbs 10(2) 2018: 325–334.
20 Cai H, et al. Automation of ELISAs and Evaluation of Emerging Technologies for High Throughput Quantitation of Protein Impurities. Pharm. Bioproc. 3(7) 2015: 427–441; doi:10.4155/pbp.15.26.
21 Rey G, et al. Full Automation and Validation of a Flexible ELISA Platform for Host Cell Protein and Protein A Impurity Detection in Biopharmaceuticals. J. Pharm. Biomed. Anal. 70, 2012: 580–586; doi:10.1016/j.jpba.2012.05.02.
22 Patel V, et al. Automating Bioanalytical Sample Analysis Through Enhanced System Integration. Bioanalysis 5(13) 2013: 1649–1659; doi:10.4155/bio.13.123.
Corresponding authors Suzana Petrovic (analytical scientist, [email protected]) and Yann Fromentin (analytical team manager, [email protected]) are in bioprocess analytics at Sanofi R&D in Vitry-sur-Seine, France. Pascale Pelluet and Jordi Nombret are R&D technicians, Mickael Jegat was a Sanofi R&D technician (now with Oncodesign), Hervé Dubois is an analytical scientist, Laura Borges is an analyst, Patrick Kreiss is an analytical team manager, Benedicte Laborderie is head of bioprocess analytics, and Laurent Duhau is head of biologics development, all at Sanofi R&D in Vitry-sur-Seine, also. Marina Hincapie is head of bioprocess analytics, and Lina Karetsky is an analytical scientist at Sanofi Genzyme in Framingham, MA. Martina Kirsch is head of bioprocess analytics, Stefanie Unger is an R&D technician, and Angela Schoch is the former analytical team manager at Sanofi-Aventis Deutschland GmbH in Frankfurt am Main, Germany.
You May Also Like


